3.2.3.4. Analytics
The Analytics is one of the components of OpenNAC Enterprise. This node is deployed through an OVA file. Core and its administration layer extract the information from the Analytics and it is shown as a component in the administration portal called Analytics.
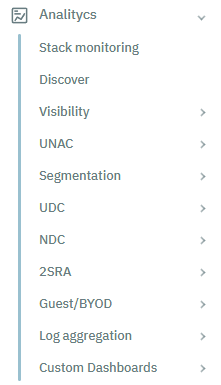
By default, the Analytics provides dashboards and a search engine.
Stack monitoring: Allows users to monitor the health, performance, and usage of their Elasticsearch cluster, as well as other components of the Elastic Stack.
Discover: The search and analytics engine that allows us to search based on fields or free text, logical expression (AND, OR, and others) can be used.
Visibility: Dashboards created for the visibility use case.
UNAC: Dashboards created for the UNAC use case.
Segmentation: Dashboards created for the Segmentation use case.
UDC: Dashboards created for the User Device Compliance use case.
NDC: Dashboards created for the Network Device Compliance use case.
2SRA: Dashboards created for the 2SRA use case.
Guest/BYOD: Dashboards created for the Guest/BYOD use case.
Log aggregation: Dashboards created with the information of Network Devices Syslog.
Custom Dashboards: Customized dashboards created in the Configuration > Dashboards section.
- 3.2.3.4.1. Stack monitoring
- 3.2.3.4.2. Discover
- 3.2.3.4.3. Visibility
- 3.2.3.4.4. UNAC
- 3.2.3.4.5. Segmentation
- 3.2.3.4.6. UDC
- 3.2.3.4.7. NDC
- 3.2.3.4.8. 2SRA
- 3.2.3.4.9. Guest/BYOD
- 3.2.3.4.10. Log aggregation
- 3.2.3.4.11. Custom Dashboards