3.2.2.4.5. Dashboards
The Analytics component collects and organizes data to display in form of dashboards in the Operate > Analytics section. Part of this information is shown in dashboards and they can be added and managed in the section Dashboards.
From this section, you can create new dashboards and manage the existing ones.
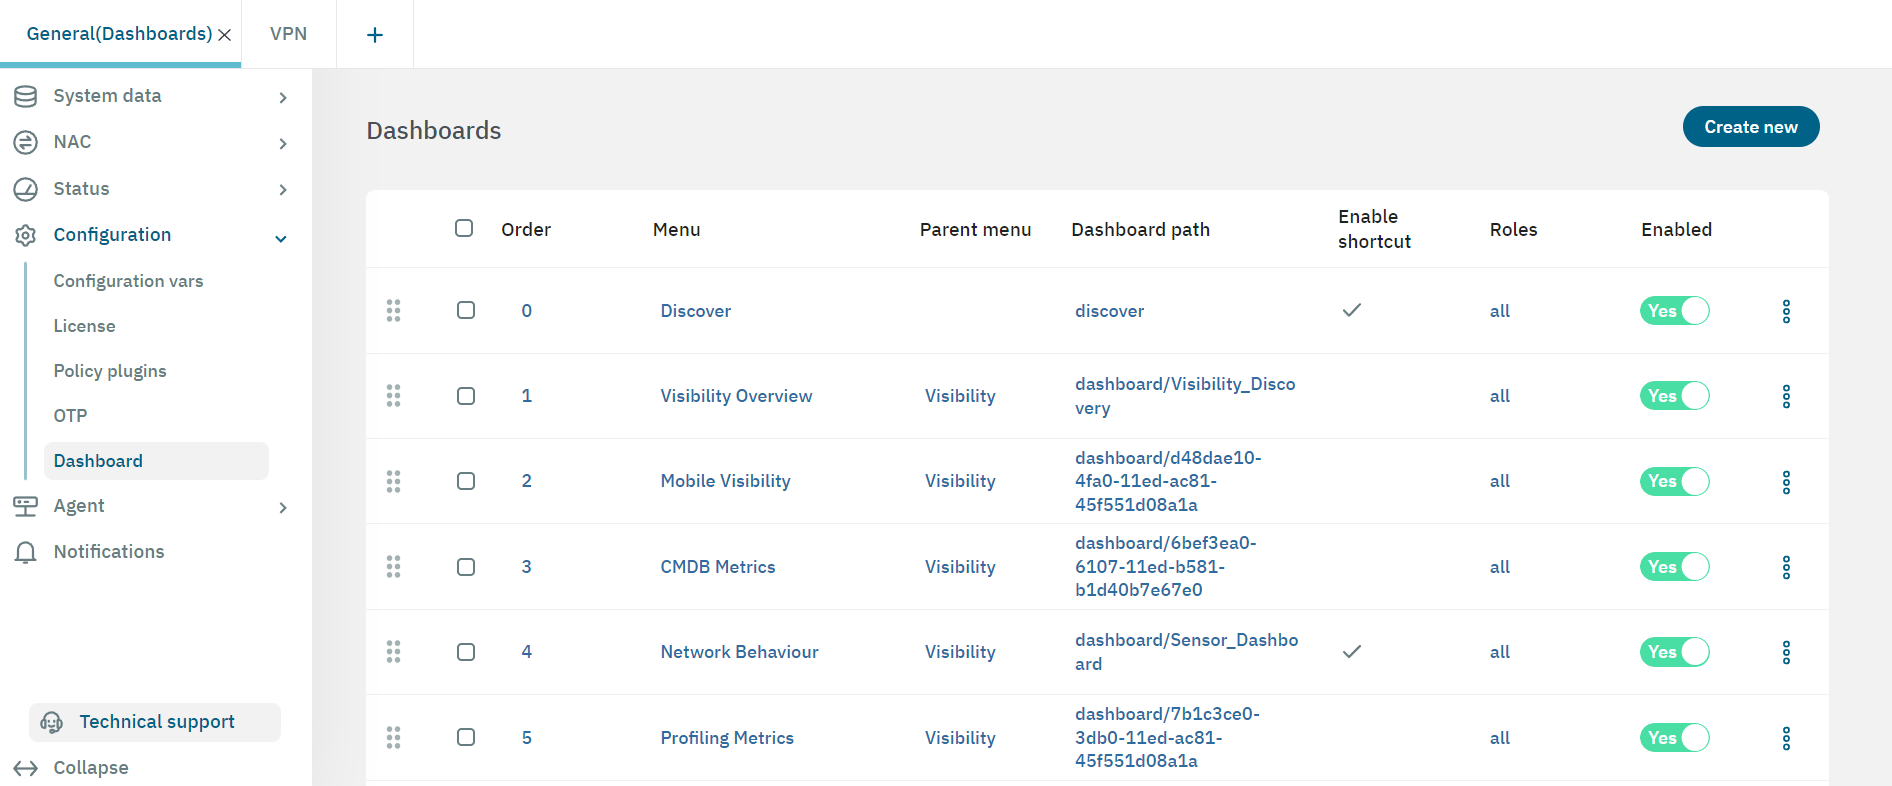
3.2.2.4.5.1. Creating a new dashboard
Click on the Create new button located at the upper-right corner. It will display the following window.
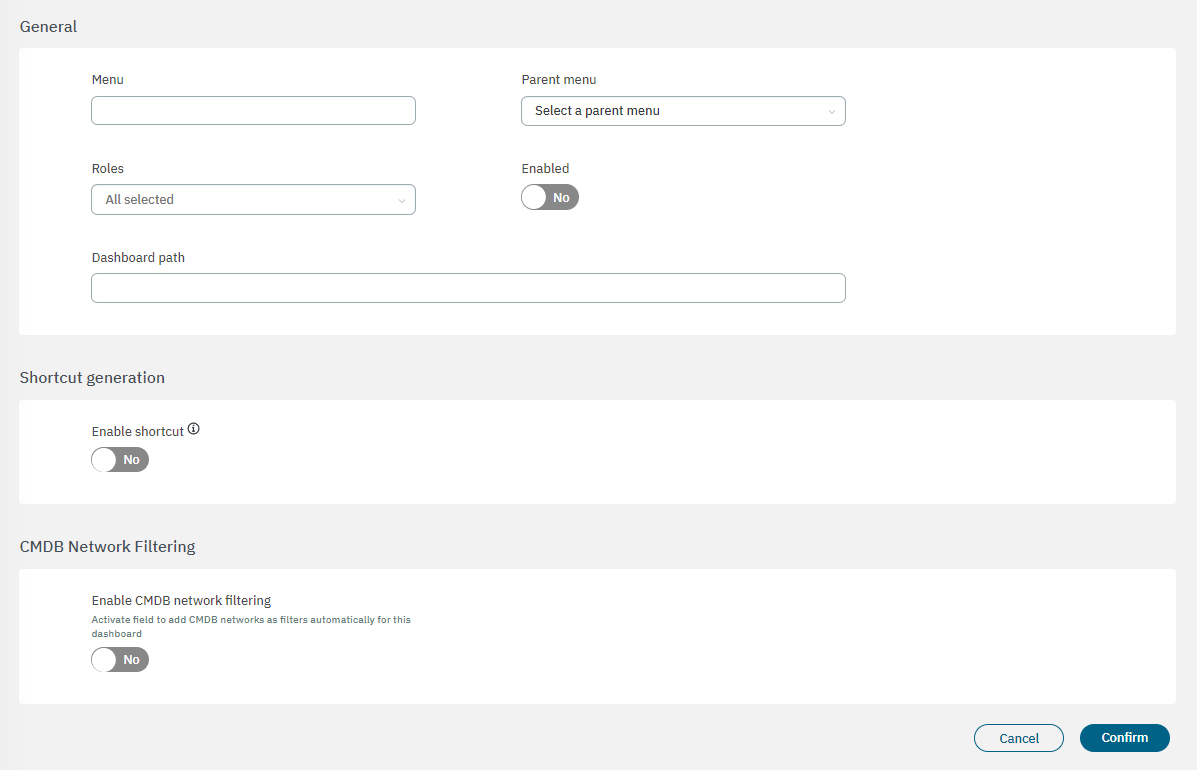
The parameters for creating a new dashboard are the following:
General
Menu: Name of the menu that will bring the user to the dashboard.
Parent menu: This refers to the name of the menu under which the dashboard will be located in the Analytics component. It provides a hierarchical structure.
Roles: User roles that will be able to see this dashboard menu. The roles displayed in this drop-down selector are the ones created in System data > Security > Roles.
Enabled: Enables the dashboard menu.
Dashboard path: Location of the dashboard in Kibana. Normally the dashboards are found in the path dashboard/{DASHBOARD_ID}.
Shortcut generation
Enable shortcut: Shortcuts appear in the Business profiles and User devices tables which allow you to see, in Kibana, the data of a specific element. By enabling this flag, it will display the following fields:
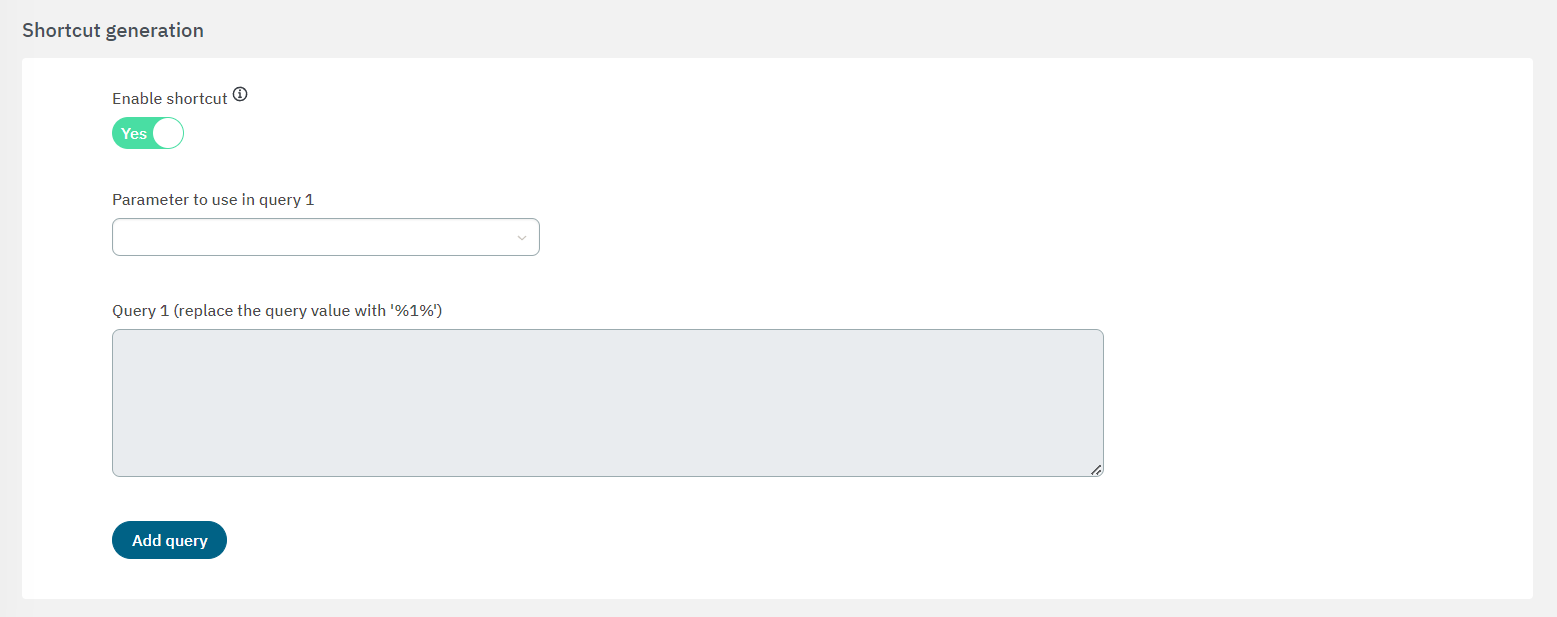
Parameter to use in query: Parameter for the query that can be URI, MAC, IP, User ID, Device User ID.
Warning
The URI is deprecated. It should be replaced for User device ID.
Query X (replace the value of the query with ‘%1%’): Query used in the shortcut. The ‘%1%’ variable will substitute the parameter into the query.
CMDB Network Filtering
Enable CMDB Networks Filtering: Enabling this field automatically adds the CMDB Networks as a filter for this dashboard. By enabling this flag, it will display the following fields:
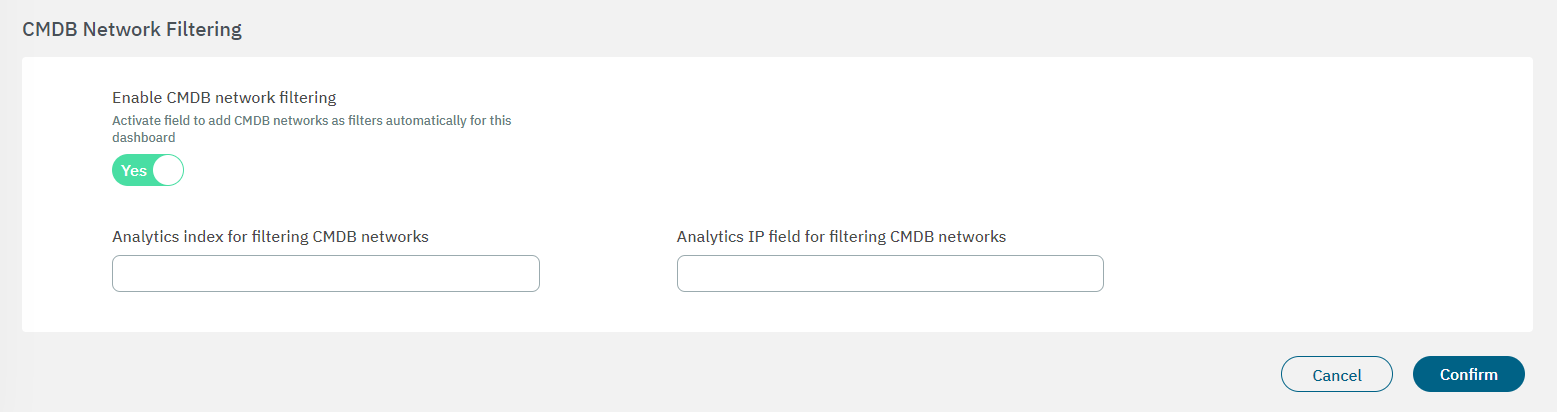
Analytics index for filtering CMDB networks
Analytics IP field for filtering CMDB networks
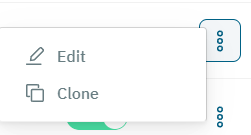
You can also, edit, or clone an existing dashboard by clicking on the three-dot icon located at the right corner of a dashboard row.