3.2.3.4.8.2. 2SRA Metrics
The 2SRA Metrics dashboard displays various metrics and statistics related to the 2SRA use case:
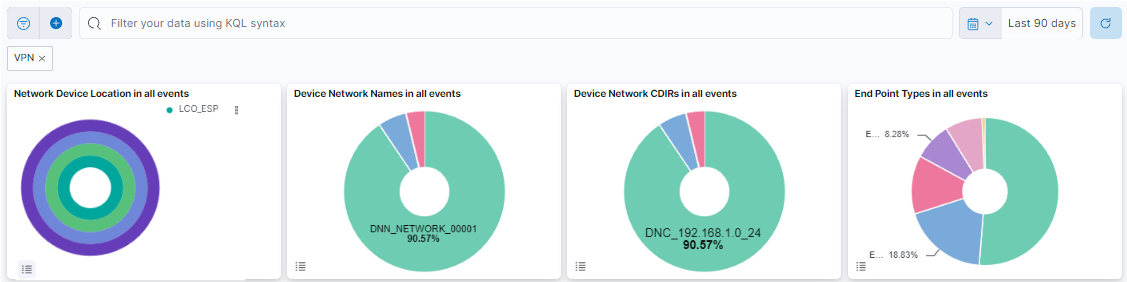
This header composed of four dashboards allows filtering by Network Device Location, Device Network Name, Device Network CDIRs, Endpoint Types. It will always look for the temporary index that is regenerated every day. In this toolbar, filter your data using KQL syntax.
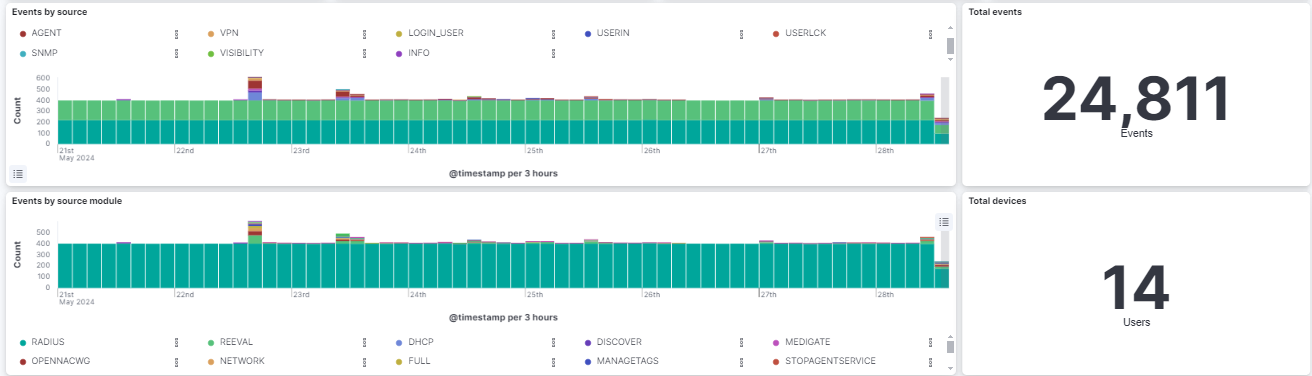
Events by source: The timeline of events by source (SNP, 8021XUSER, IP, VPN, etc.).
Total events: The total number of opennac events.
Events by source module: The timeline of events by source module (RADIUS, REEVAL, DISCOVER, STOPAGENTSERVICE, DHCP, etc.).
Total devices: The total number devices that generate opennac events.
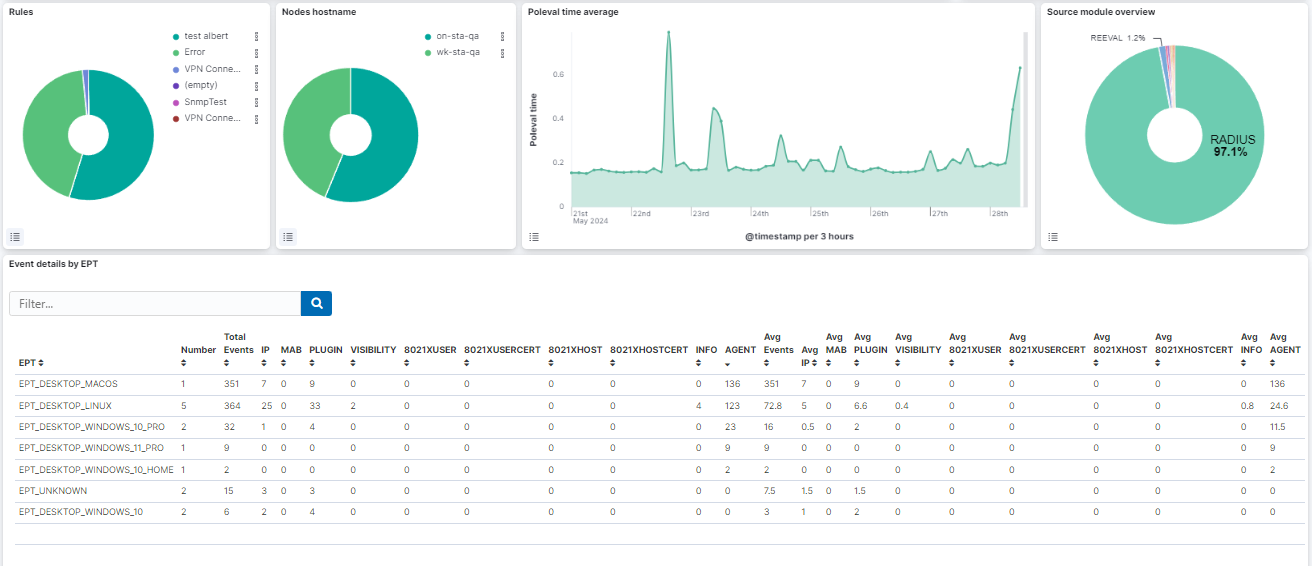
Rules: A pie chart showing the policies of the user devices.
Nodes hostname: A pie chart showing the hostnames of the farm nodes.
Poleval time average: A timestamp that shows the poleval time average.
Source Module overview: A pie chart showing the source module.
Event details by EPT: A table that shows the details of each event by EPT (number of events, source, etc).
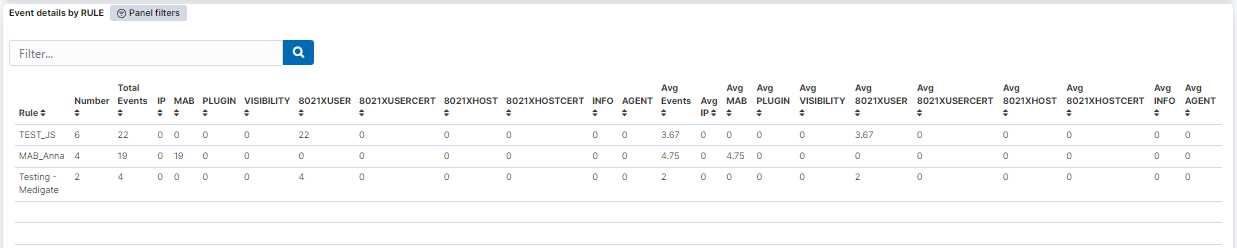
Event details by RULE: A table that shows the details of the events by policy.
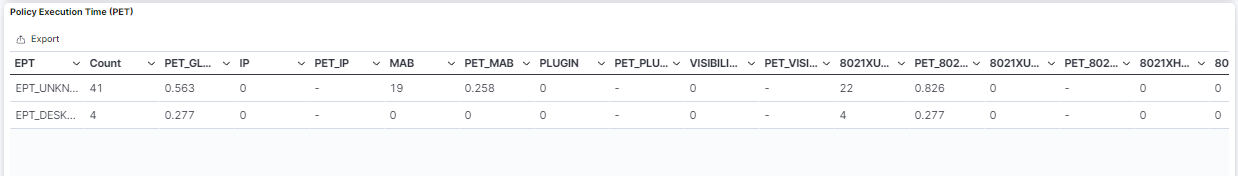
Policy Execution Time (PET): A table that shows the poleval execution time.