3.2.3.4.8.3. VPNGW
The VPNGW dashboard displays information about VPN Gateway events, metrics, and statistics.
3.2.3.4.8.3.1. Header
The three available views in the UNAC Overview section show different information about user devices and network devices. However, they have a common header, which refers to a consistent section at the top of each view that contains shared information.
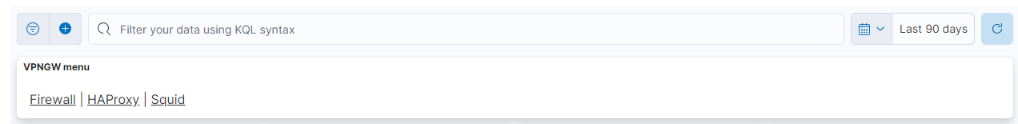
VPNGW Menu
The menu features different windows, such as Firewall, HAProxy, and Squid. Each window offers distinct dashboard views, allowing you to navigate between these sections. The following topics will explore these menu options in detail.
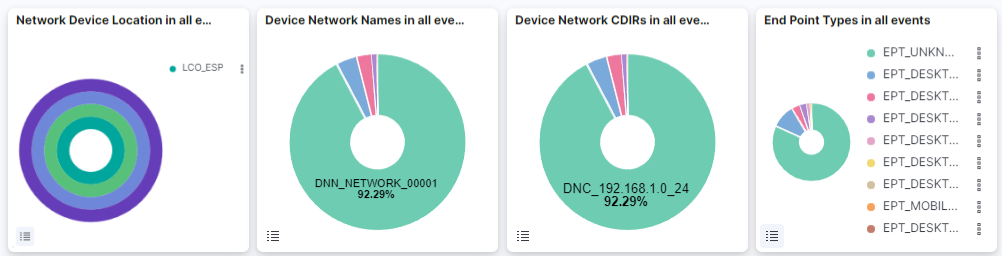
This header composed of four dashboards allows filtering by Network Device Location, Device Network Name, Device Network CDIRs, Endpoint Types. It will always look for the temporary index that is regenerated every day. In this toolbar, filter your data using KQL syntax.
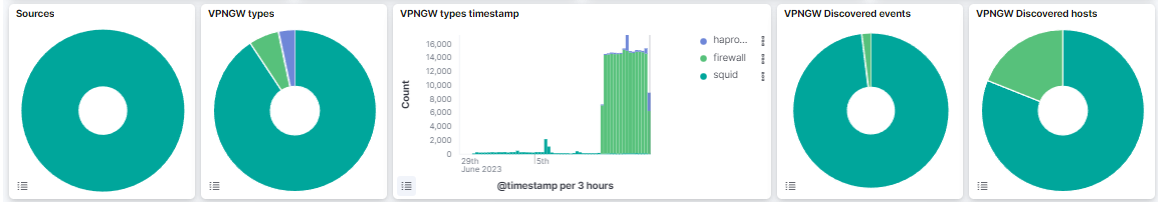
Sources: Graphic representation of the VPNGW sources.
VPNGW types: Graphic representation of the VPNGW types.
VPNGW types timestamp: VPNGW types timestamp per 3 hours.
VPNGW Discovered events: Graphic representation of discovered and unknown events.
VPNGW Discovered hosts: Graphic representation of discovered and unknown devices.
3.2.3.4.8.3.2. Firewall
The Firewall window displays firewall events and statistics information.
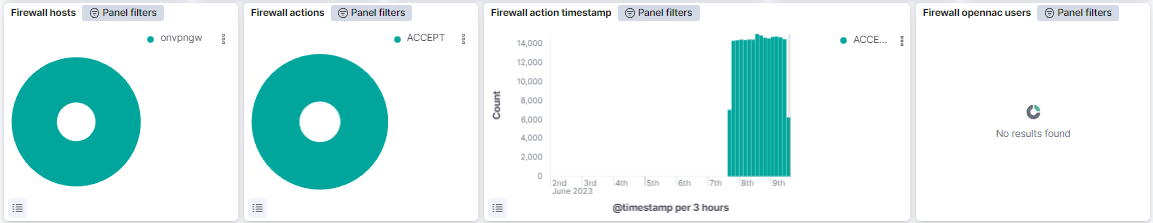
Firewall hosts: Graphic representation of firewall hosts.
Firewall actions: Graphic representation of firewall acceptance and rejection.
Firewall action timestamp: Firewall action timestamp per 3 hours.
Firewall opennac users: Graphic representation of firewall opennac users.
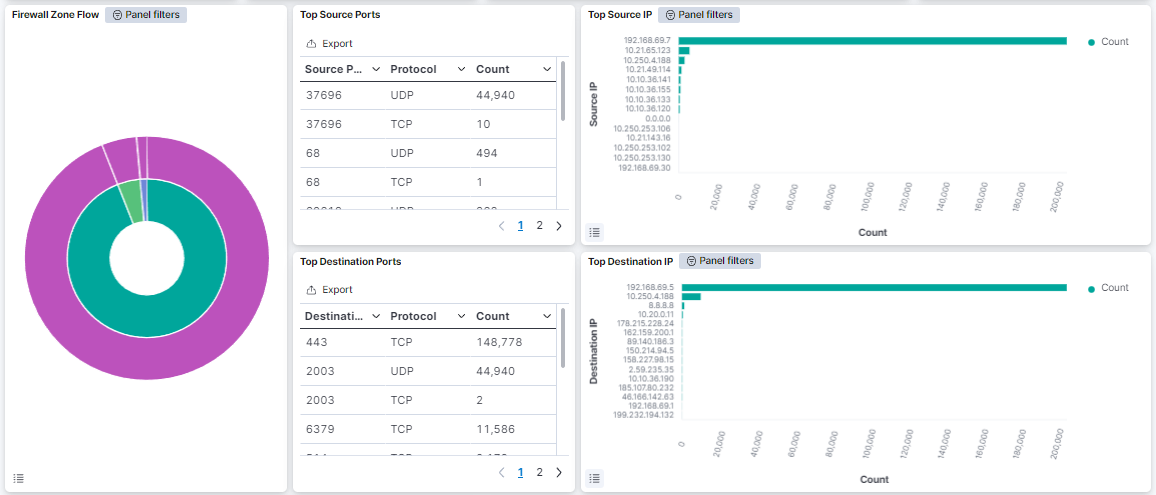
Firewall Zone Flow: Graphic representation of the firewall zone flow, where the inside pie chart shows the untrust connection data and the exterior pie chart shows the accepted connection data.
Top Source Ports: Table that features top source ports, protocols used and count of events.
Top Source IP: Graphic that represents the top source IP count.
Top Destination Ports: Table that features top destination ports, protocols used and count of events.
Top Destination IP: Graphic that represents the top destination IP count.
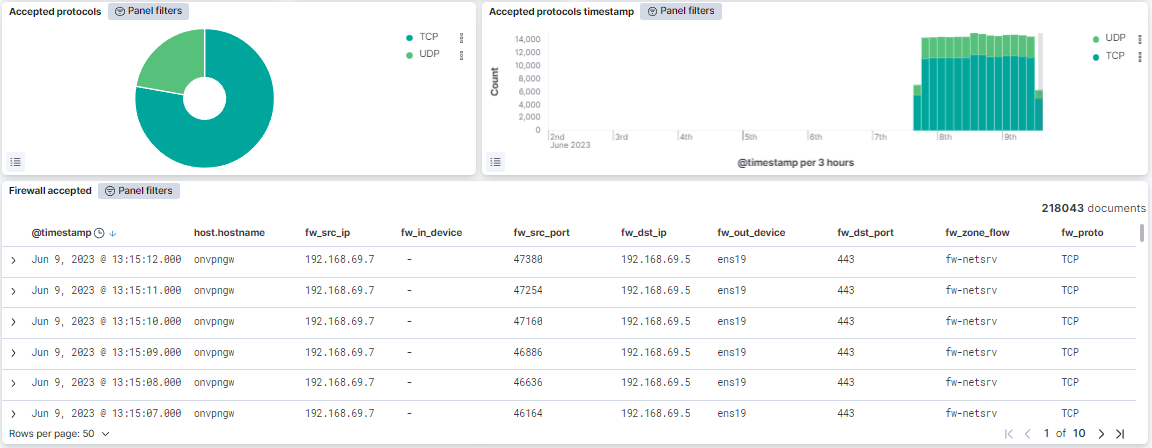
Accepted protocols: Graphic representation of accepted protocols (TCP, UDP,ICMP).
Accepted protocols timestamp: Accepted protocols timestamp per 3 hours.
Firewall accepted: Table that features the an overview of firewall accepted events.
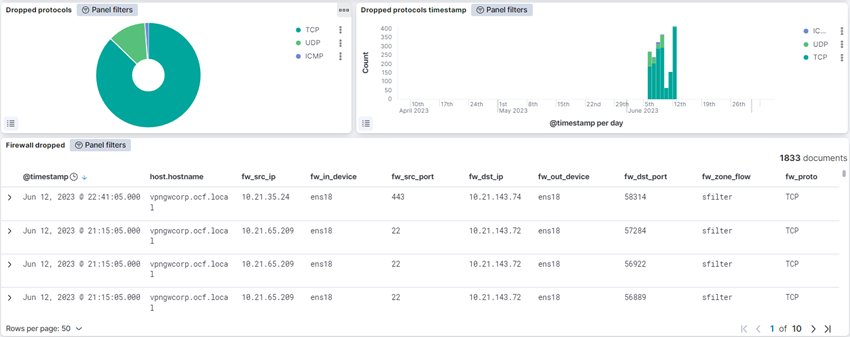
Dropped protocols: Graphic representation of the dropped protocols (TCP, UDP, ICMP).
Dropped protocols timestamp: Dropped protocols timestamp per 3 hours.
Firewall dropped: Table that features the an overview of firewall dropped events.
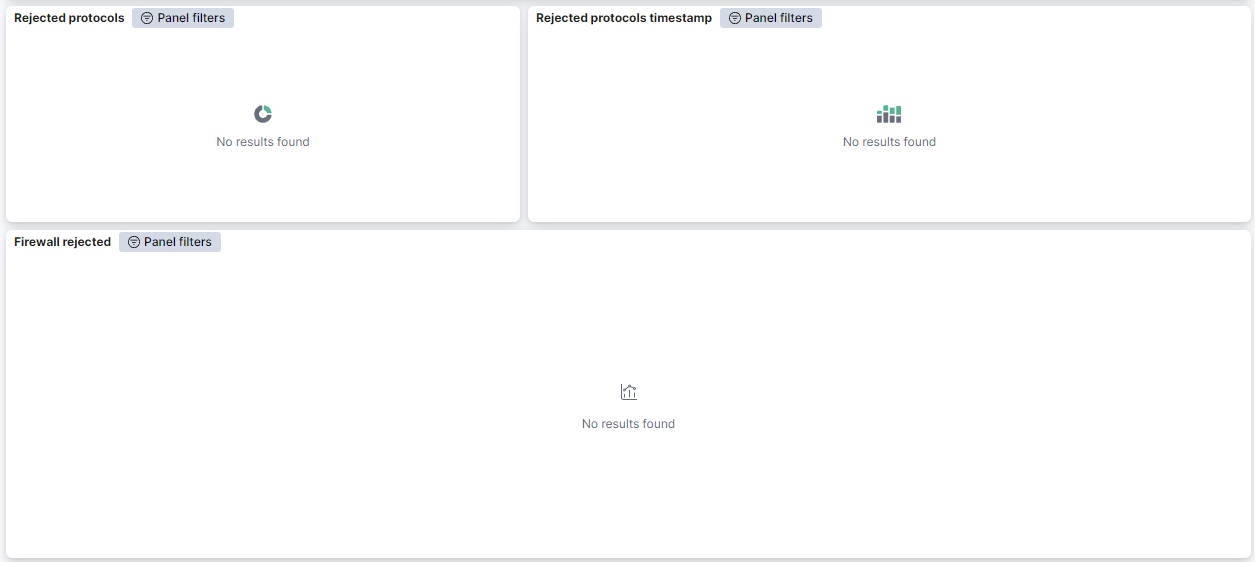
Rejected protocols: Graphic representation of the rejected protocols (TCP, UDP, ICMP).
Rejected protocols timestamp: Rejected protocols timestamp per 3 hours.
Firewall rejected: Table that features the an overview of firewall rejected events.
3.2.3.4.8.3.3. HAproxy
This window displays information about HAproxy servers, actions and requests.
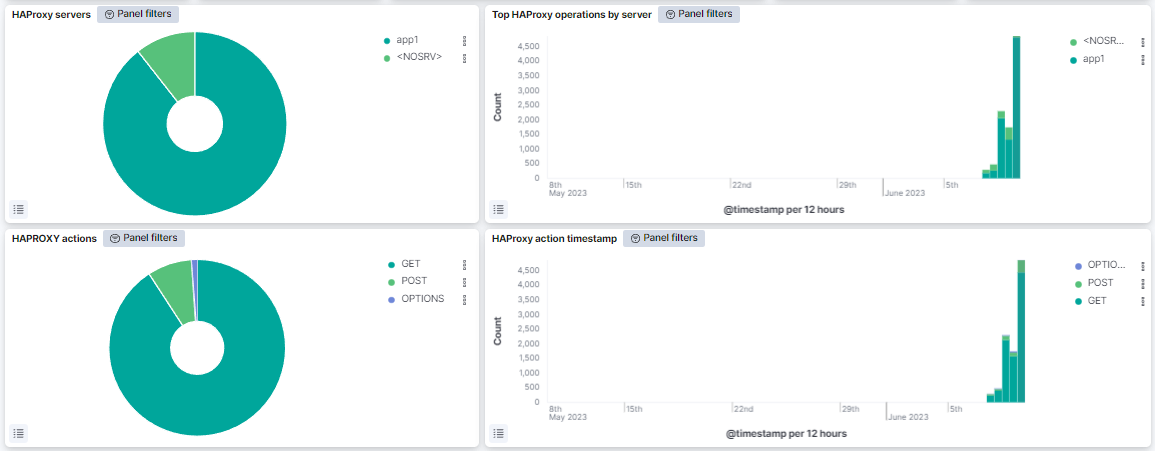
HAProxy servers:
Top HAProxy operations by server:
HAPROXY actions:
HAProxy action timestamp:
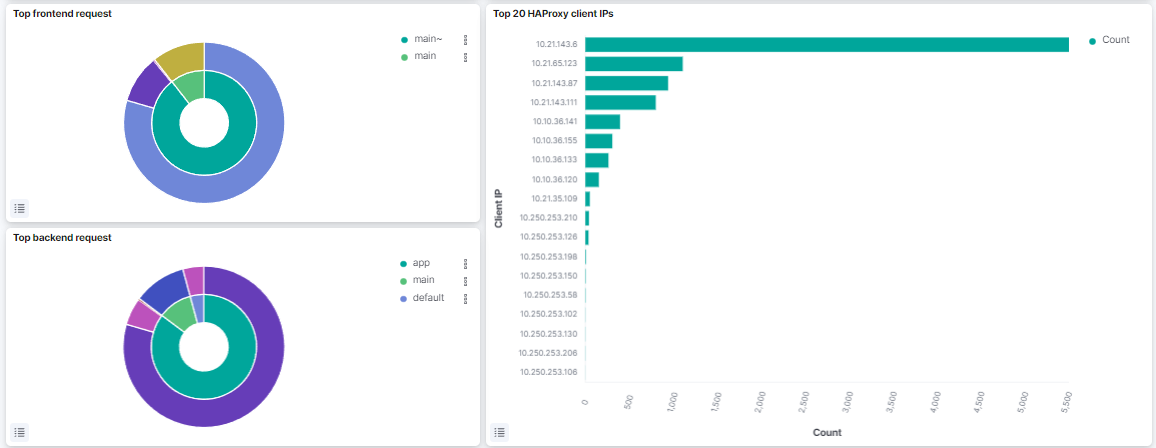
Top frontend request:
Top 20 HAProxy client IPs:
Top backend request:
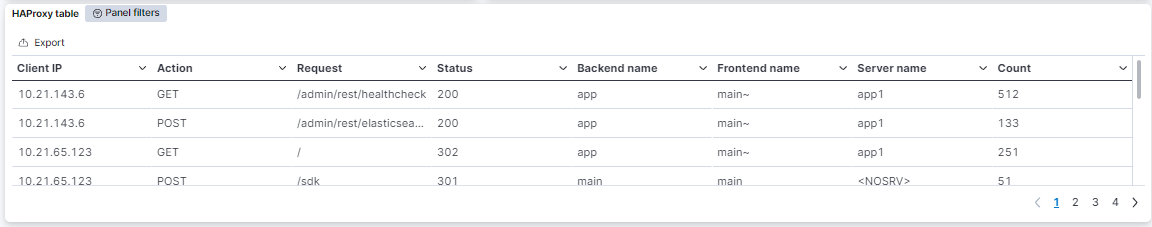
HAProxy table:
3.2.3.4.8.3.4. Squid
This window displays information about Squid Proxy Server statistics and metrics.
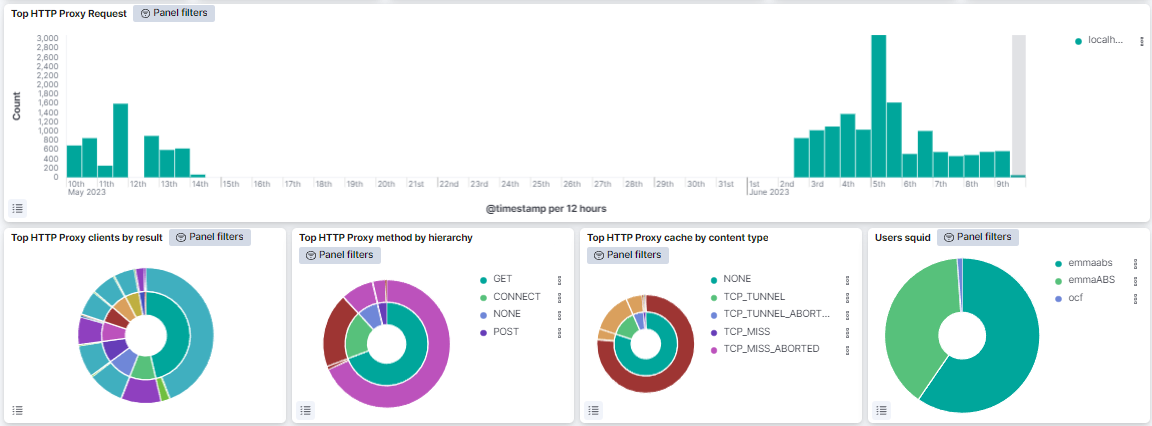
Top HTTP Proxy Request:
Top HTTP Proxy clients by result:
Top HTTP Proxy method by hierarchy:
Top HTTP Proxy cache by content type:
Users squid:
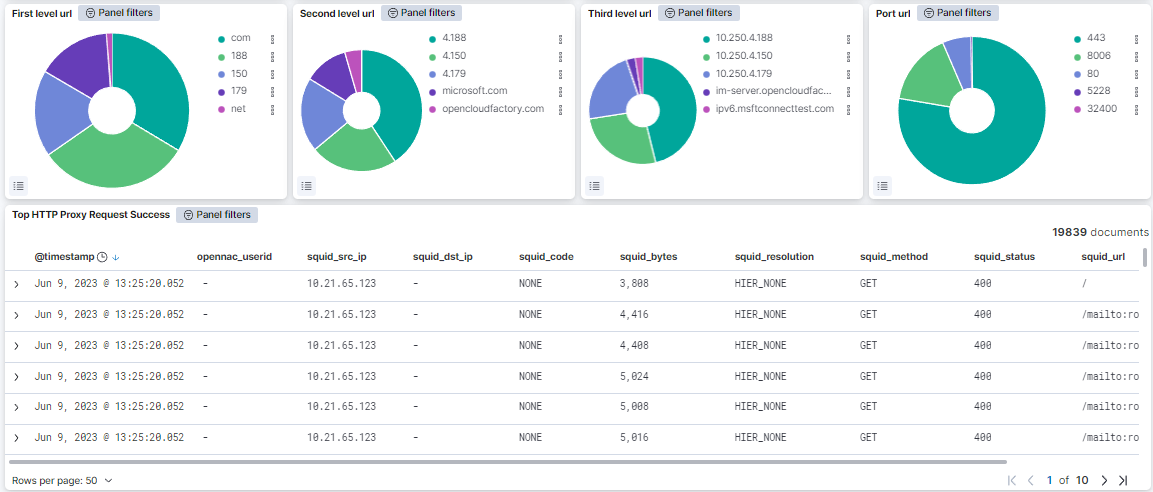
First level url:
Second level url:
Third level url:
Port url:
Top HTTP Proxy Request Success: