3.2.3.4.8.1. 2SRA Overview
The 2SRA Overview dashboard displays VPN connections and their features. We can see the following views on this dashboard, starting from the header:
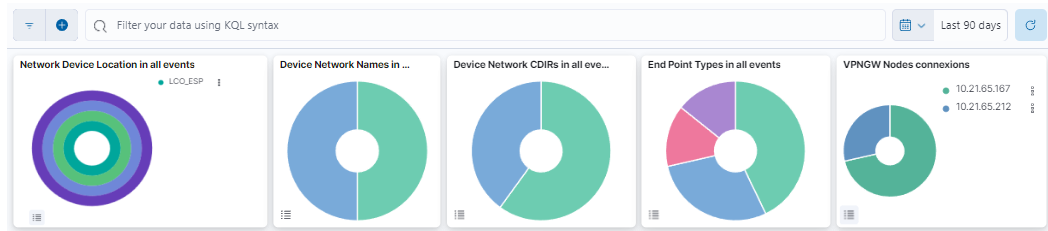
This header composed of five dashboards allows filtering by Network Device Location, Device Network Name, Device Network CDIRs, Endpoint Types, and VPNGW Nodes connections. It will always look for the temporary index that is regenerated every day. In this toolbar, filter your data using KQL syntax.
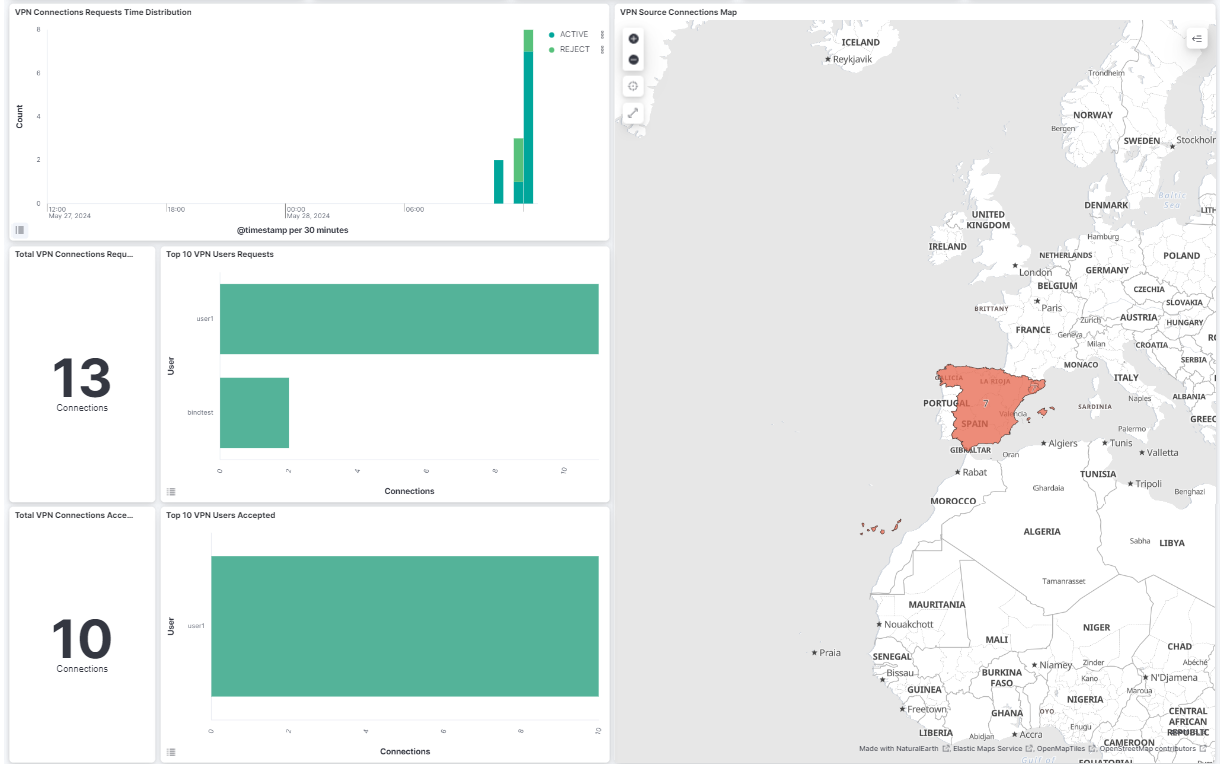
VPN Connection Requests Time Distribution: Shows the total of VPN events separated by active and rejected on a timeline.
VPN source connection map: A map displaying the locations of VPN connections.
Total VPN Connection Requests: Shows the number of total VPN connection requests.
TOP 10 VPN User Requests: Shows the top 10 users that generates the VPN requests, with the number of requests for user.
Total VPN Connections Accepted: NShows the number of total VPN connections accepted.
TOP 10 VPN Users Accepted: Shows the top 10 users that generates the VPN requests, with the number of accepted requests for user.
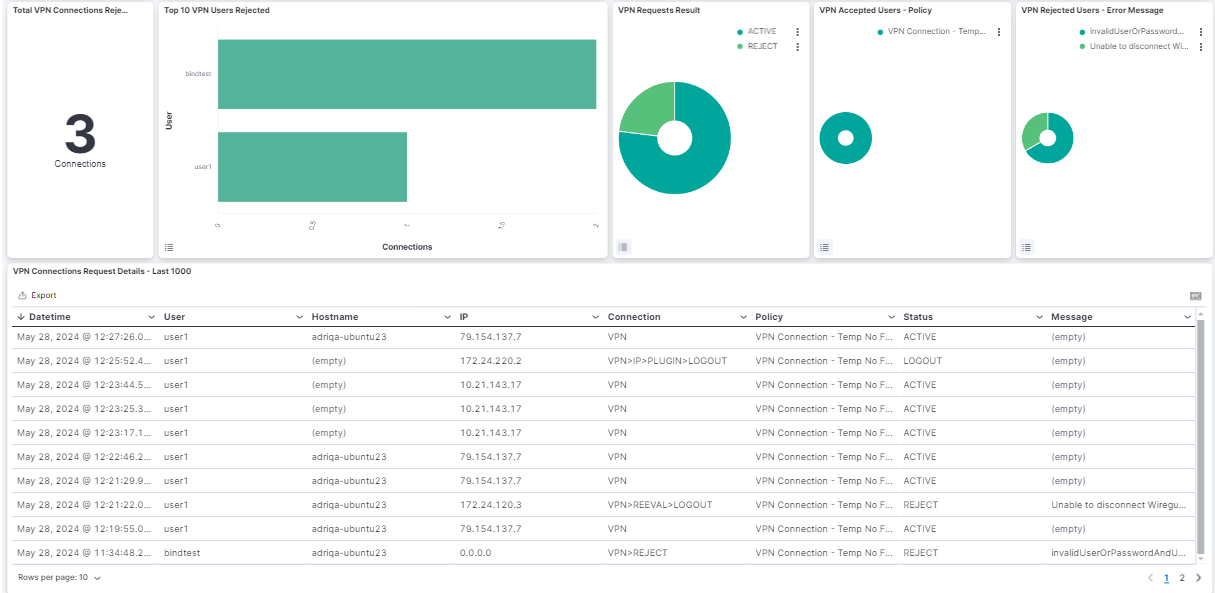
Total VPN Connections Rejected: Number of connections rejected.
TOP 10 VPN Users Rejected: Shows the top 10 users that generates the VPN requests, with the number of rejected requests for user. .
Connection Requests - VPN Servers: Represents the percentage of network devices VPN events.
VPN Requests Result: Represents the percentage of network devices VPN events results.
VPN Accepted Users - Policy: Represents the percentage of accepted users by policy.
VPN Rejected Users - Error Message: Represents the percentage of rejected users by error messages.
Connections Request Details - Last 1000: Shows a table with the last 1000 VPN connection requests details. In this table timestamp is represented, as well as the user, the hostname, the IP, the connection type, the policy rule and the message.