3.2.3.4.3.4. Network Behaviour
The Network Behaviour Dashboard displays all the information captured from the ON Sensor that is stored in the index of “bro-”.
3.2.3.4.3.4.1. Header
The three available views in the Network Behaviour section show different information captured by the sensor. However, they have a common header, which refers to a consistent section at the top of each view that contains shared information.
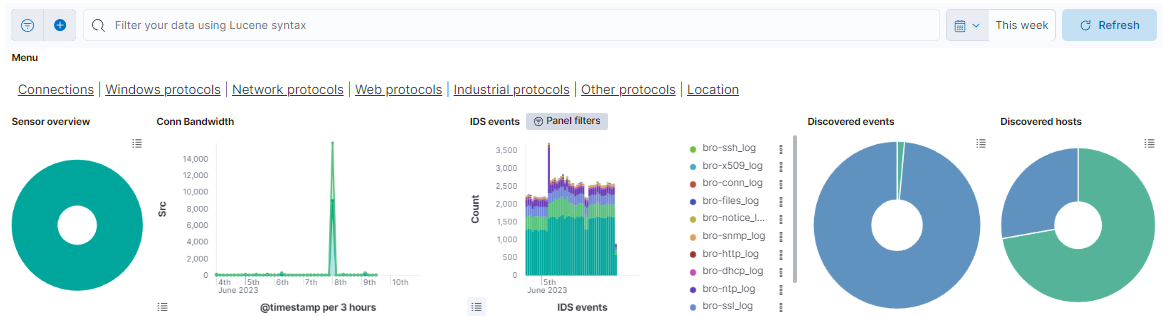
Menu
The menu features different windows, such as Connections, Windows protocols, Network protocols, Web protocols, Industrial protocols, Other protocols, and Location. Each window offers distinct dashboard views, allowing you to navigate between these sections. The following topics will explore these menu options in detail.
Sensor overview: Represents the percentage of the different ON Sensor that are generating the events.
Conn Bandwidth: Shows the total bandwidth of requests and responses to see the traffic that the bro index is generating on a timeline.
IDS events: Shows the total of events of bro separated by the event type on a timeline. The different event types are: bro-conn_log, bro-dns_log, bro-http_log, bro-files_log, bro-dhcp_log, bro-notice_log, bro-ssl_log, bro-x509_log, bro-kerberos_log, bro-radius_log, bro-ssh_log, bro-snmp_log, bro-sip_log, bro-dpd_log, bro-smtp_log, bro-arp_log, bro-modbus_log, bro-rfb_log, bro-rdp_log, bro-ntlm_log, bro-socks_log, bro-tunnel_log, bro-rpc_log, bro-pe_log, bro-smb_files_log, bro-smb_mapping_log, bro-s7comm_log, bro-profinet_log, bro-bacnet_log, bro-enip_log, bro-dnp3_log and bro-syslog_log.
Discovered events: Represents the total of events discovered by OpenNAC Enterprise versus the events that can’t be discovered and represent unknown devices. One device can generate many events.
Discovered hosts: Represents the total of devices discovered by OpenNAC Enterprise versus the devices that can’t be discovered and represent unknown devices.
3.2.3.4.3.4.2. Connections
This window displays the connections logs captured by the ON Sensor.
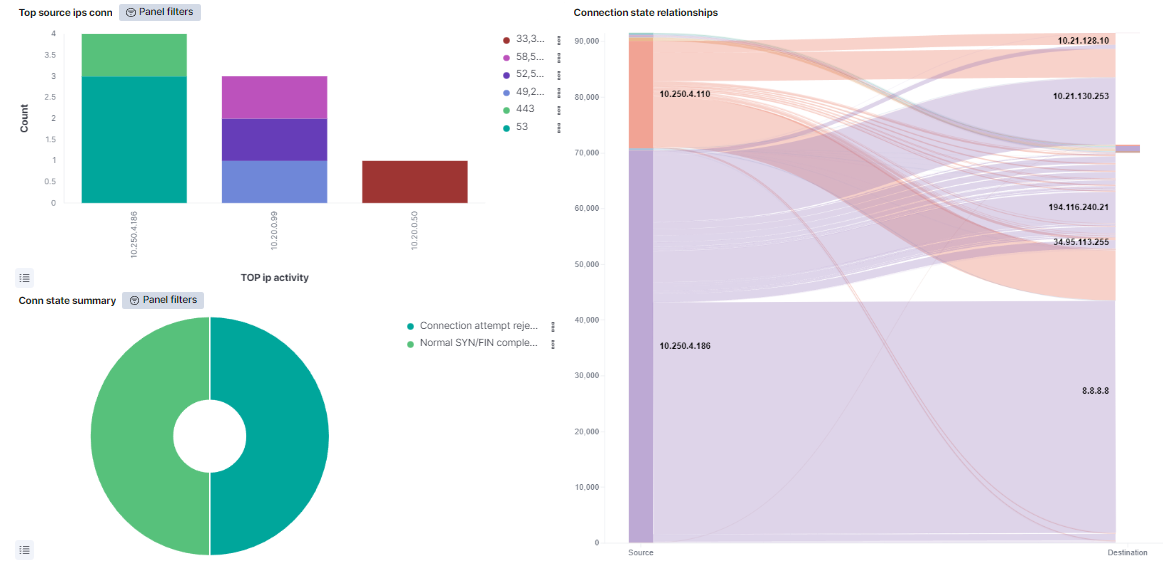
Top source ips conn: Shows the top 10 IPs with more connections indicating in the Y axis the total of connections. The connections are divided by the destination port of the connection
Conn state summary: Represents the percentage of the top 10 most found connection states.
Connection state relationship: Shows the connection relationship between the different IPs separating in the left the source IPs and in the right the destination IPs.
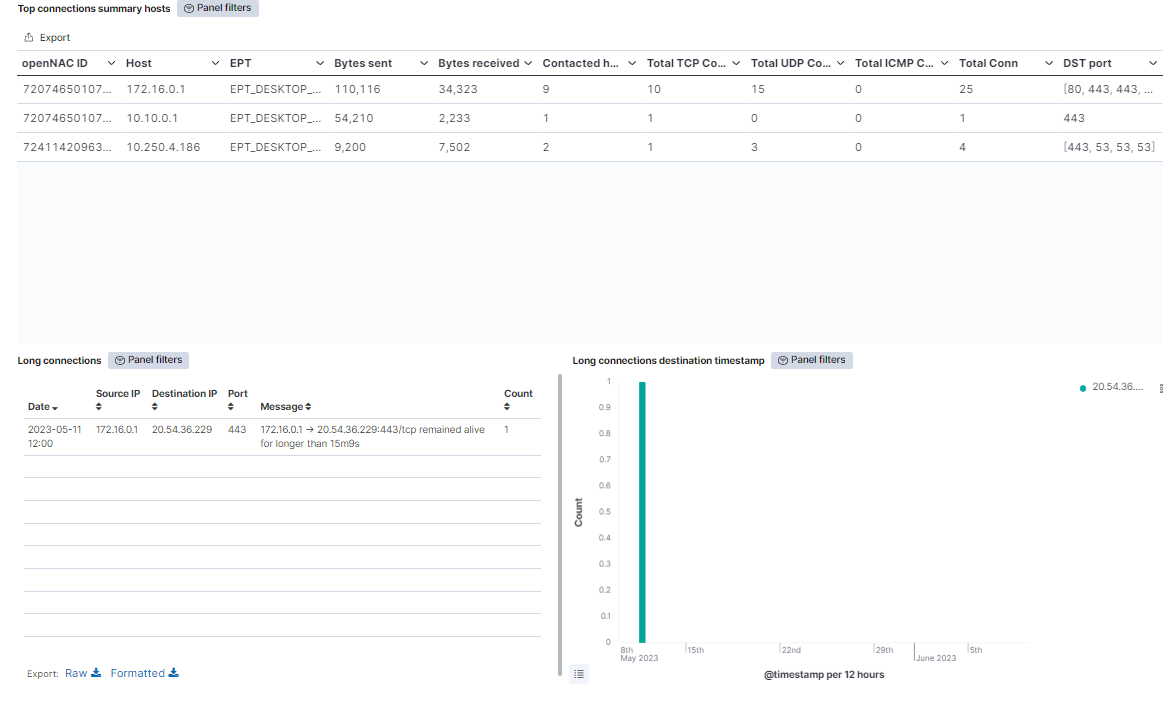
Top connections summary hosts: Shows a table of the top 100 connections showing the OpenNAC Enterprise ID, the host IP, the EPT type, the bytes send and received, the contacted host, the total TCP connections, the total UDP connections, the total ICMP connections, the total connections (the summarization of TCP, UDP and ICMP connections), and the last five destination port.
Long connections: Shows a table with the connections tagged as long. These connections are those that are running during a large period of time, like hours or days. In this table the Date when an event of long connection is detected is shown, and also the source and the destination IP of the connection, the port and the message, that shows the time the connection has been alive.
Long connections destination timestamp: Show over time when the long connections are noticed, separated by destination IP.
3.2.3.4.3.4.3. Windows protocols
This window displays windows protocols logs captured by the ON Sensor. These protocols are NTLM (windows New Technology Local area network Manager), SMB (Server Message Block), DCE RPC (Data Circuit-terminating Equipment Remote Procedure Call), RDP (Remote Desktop Protocol), RFB (Remote Frame Buffer) and PE (Portable Executable).
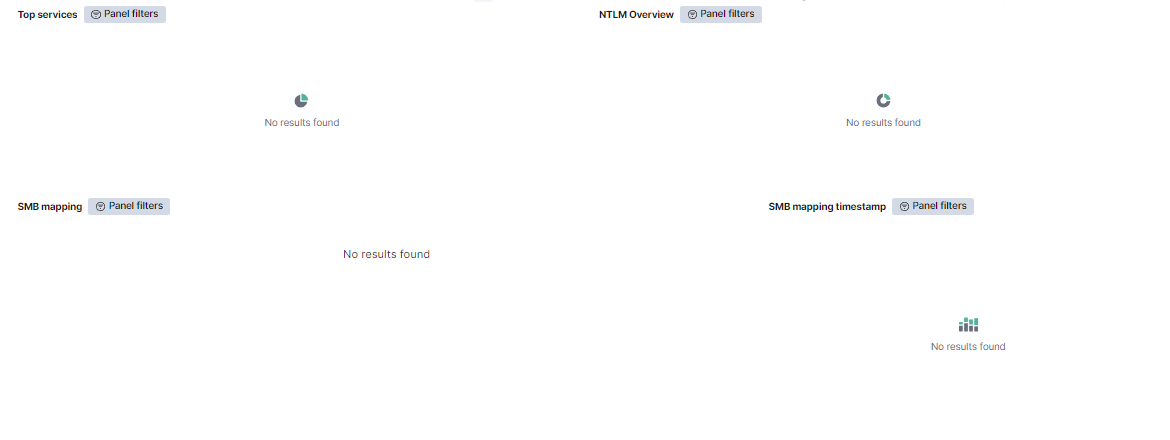
Top services: The internal pie represents the percentage of the events that exist from each service. Some of these services are dns, ssl, nto, krb, http, dce_rpc, dhcp, ssh. The external pie represents the percentage of messages of every event.
NTLM Overview: The internal pie represents the percentage of the top 10 NTLM hostnames, and the external pie, the username of the NTLM host.
SMB mapping: Shows a table with the SMB mapping events. This table has the source IP and the destination IP, the path, the share type, and the count each event has been repeated.
SMB mapping timestamp: Shows all the SMB mapping events, separated by destination IP on a timeline.
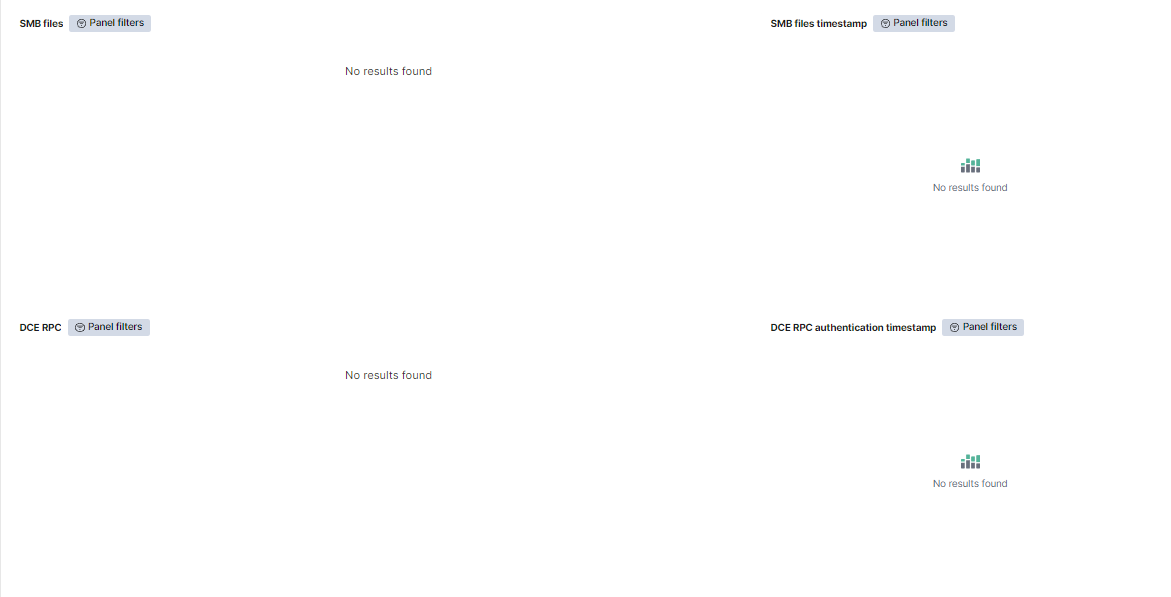
SMB files: Shows a table with the SMB files events. This table represents the source IP and the destination IP of each connection, the name of the file, the action of SMB over the file, the path, the size, and the amount of times this event is repeated.
SMB files timestamp: Shows all the SMB file events, separated by destination IP on a timeline.
DCE RPC: Shows a table with DCE RPC events. In this table the source IP and the destination IP of each connection is represented, as well as the endpoint, the operation, the named pipe, and the amount of times this event is repeated.
DCE RPC authentication timestamp: Shows all the DCE RPC events, separated by destination IP on a timeline.
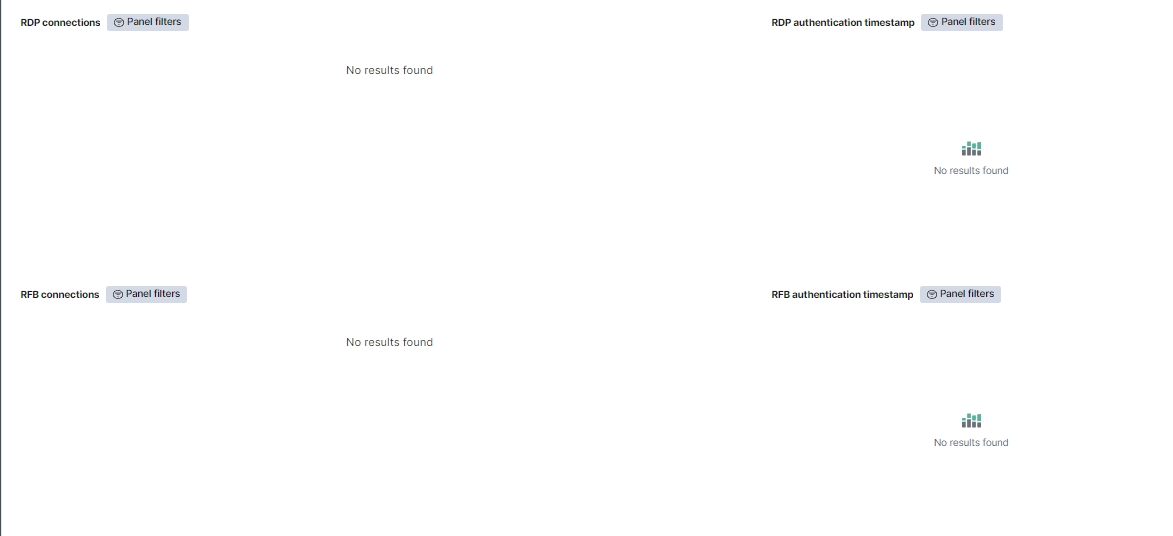
RDP connections: Shows a table with RDP events. In this table the source IP and the destination IP of each connection is represented, as well as the hostname, the result, the security protocol, the certificate count, and the amount of times this event is repeated.
RDP authentication timestamp: Shows all the RDP events, separated by destination IP on a timeline.
RFB connections: Shows a table with RDP events. This table represents the source IP and the destination IP of each connection, as well as the authentication method, the desktop, and the amount of times this event is repeated.
RFB authentication timestamp: Shows all the RFB events, separated by destination IP on a timeline.
PE: Shows a table with RDP events. In this table there are values for each source machine that generates this event, their operating system, if the portable executable is executable, if its size is 64b, its code integrity, if it has cert table, if it has debug data, and the amount of times this event is repeated.
PE summary: The internal pie represents the percentage of the PE machines subsystem. The middle pie represents the percentage of operating systems for every subsystem. And the external pie represents the percentage of the PE machines for every operating system.
3.2.3.4.3.4.4. Network protocols
The Network protocols displays views of network protocols logs captured by the ON Sensor. These protocols are VLAN (Virtual Local Area Network), DHCP (Dynamic Host Configuration Protocol), RADIUS (Remote Authentication Dial-In User Service), Kerberos, SNMP (Simple Network Management Protocol) and VXLAN (Virtual Extensible Local Area Network).
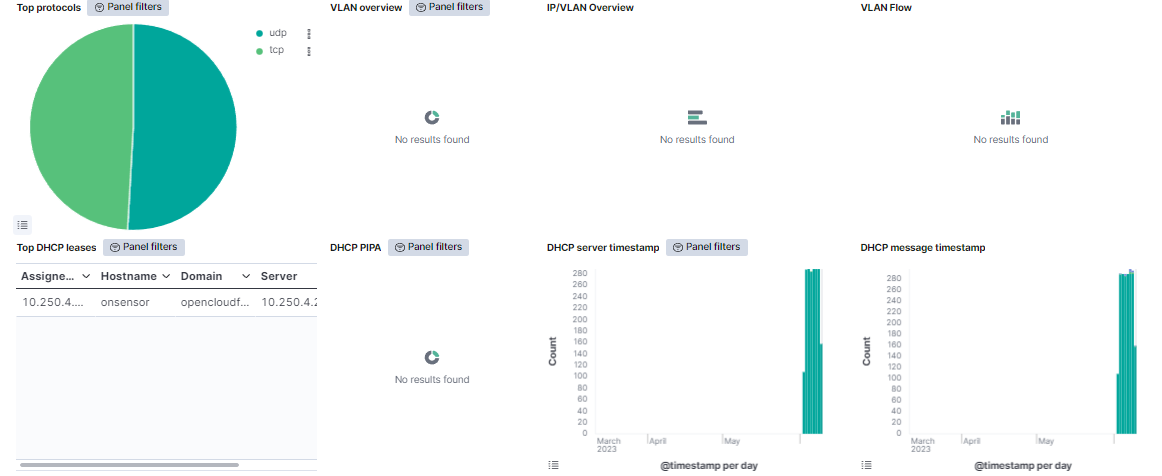
Top protocols: Represents the percentage of the events from protocols TCP, UDP and ICMP.
IP/VLAN Overview: Shows the number of IP detected in each VLAN.
VLAN overview: Represents the percentage of events per VLAN.
VLAN Flow: Shows the data bytes of the VLAN traffic, separated by VLAN on a timeline.
Top DHCP leases: Shows a table with DHCP leases events. This table represetns the assigned IP, as well as the hostname, the domain, the DHCP server, and the amount of times this event is repeated.
DHCP PIPA: The internal pie represents the percentage of the DHCP PIPA IP ranges. These are the IPs that are assigned when a DHCP server is not in range. The external pie represents the percentage of VLANs where the DHCP PIPA has been assigned.
DHCP server timestamp: Shows all the DHCP events, separated by destination IP on a timeline.
DHCP message timestamp: Shows all the DHCP events, separated by DHCP message on a timeline.
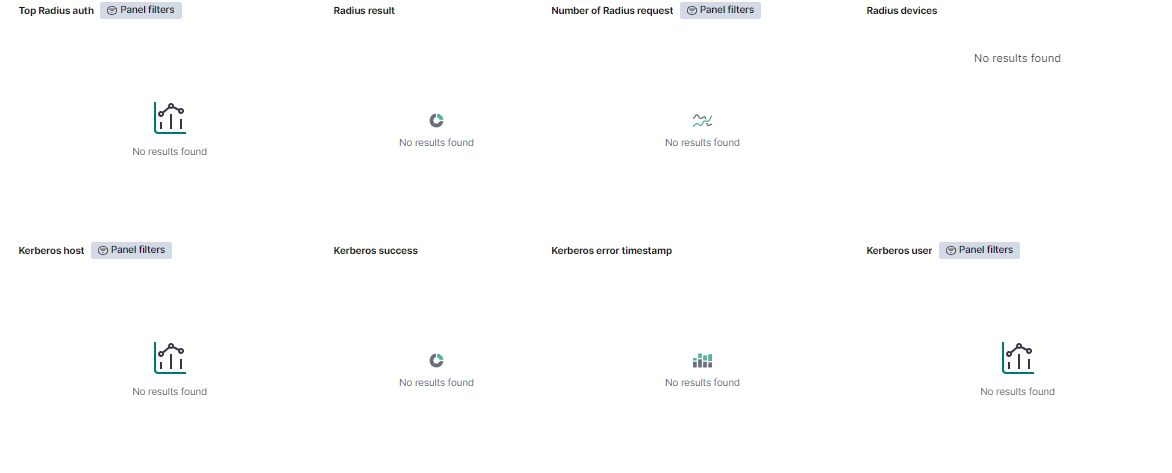
Top radius auth: Shows a table with Radius authorization events. In this table it’s represented the username, the result, the client IP, the server IP, and the amount of times this event is repeated.
Radius result: Represents the percentage of success and failed Radius authentications.
Number of Radius request: Shows the Radius events, separated by success or failed on a timeline.
Radius devices: Shows a table with Radius devices. This table displays the MAC, the username, the IP, and the amount of times this event is repeated.
Kerberos host: Shows a table with Kerberos hosts. This table displays the Kerberos host and the hosts event counts.
Kerberos success: Represents the percentage of success and failed Kerberos events.
Kerberos error timestamp: Shows the Kerberos events, separated by Kerberos error message on a timeline.
Kerberos user: Shows a table with Kerberos users. This table displays the Kerberos host and the users event counts.
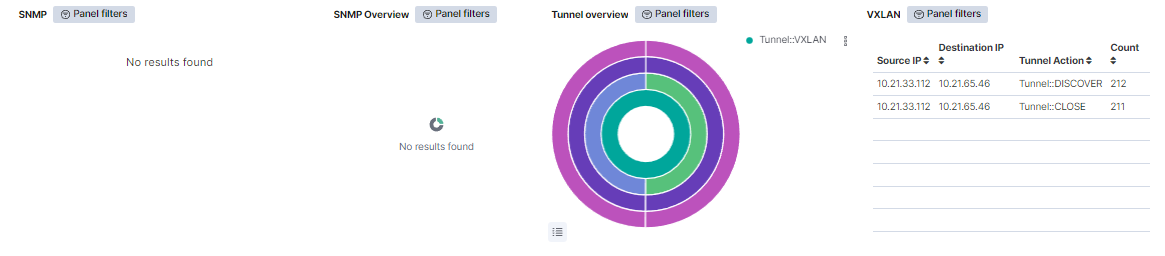
SNMP: Shows a table with SNMP events. This table represents the source IP, the destination IP, and the amount of times this event is repeated.
SNMP Overview: The internal pie represents the percentage of SNMP versions. The middle pie represents the percentage of SNMP community for every SNMP version. The external pie represents the percentage of source IP for every SNMP community..
Tunnel overview: The internal pie represents the percentage of the Tunnel type. The second pie represents the percentage of the Tunnel actions for every Tunnel type. The third pie, the percentage of the destination IPs actions for every Tunnel action. In the external pie, the percentage of source IPs for every destination IP is shown.
VXLAN: Shows a table with VXLAN events. This table displays the source IP, the destination IP, the Tunnel action, and the count of each event.
3.2.3.4.3.4.5. Web protocols
This window displays views of web protocols logs captured by the ON Sensor. These protocols are DNS (Domain Name System), HTTP (HyperText Transfer Protocol), SSH (Secure SHell), SSL (Secure Sockets Layer), and Certificate.
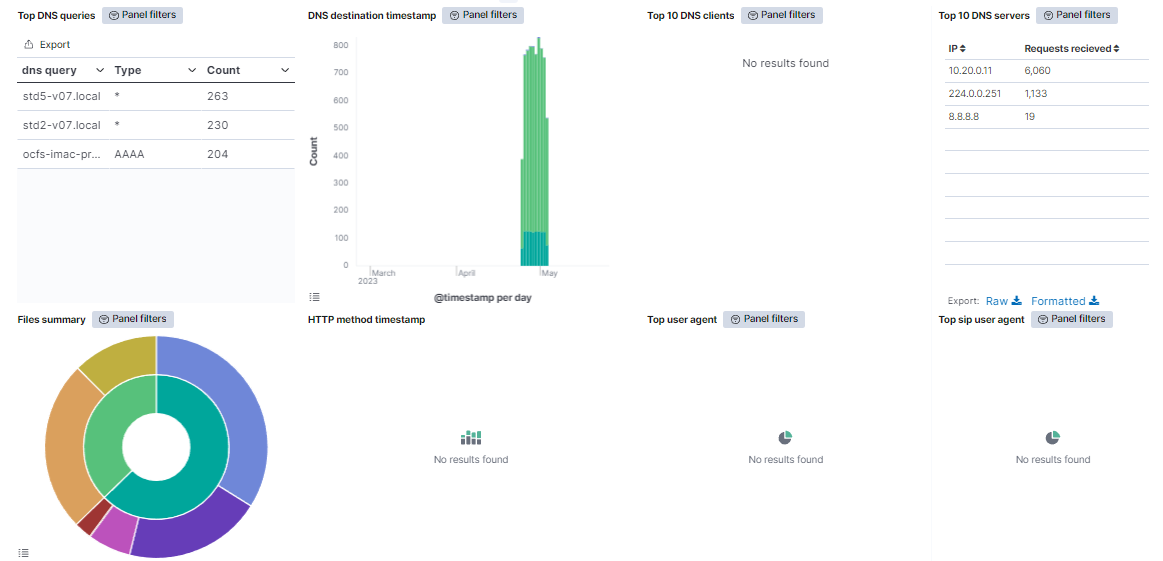
Top DNS queries: Shows a table with DNS events. The table, for each event, includes the dns query, the type, and the amount of times this event is repeated.
DNS destination timestamp: Shows the DNS events, separated by the destination IP on a timeline.
Top 10 DNS clients: Shows a table with the top 10 DNS clients. The table, for each event, includes the dns client IP, the hostname, and the requests send.
Top 10 DNS servers: Shows a table with the top 10 DNS servers. The table, for each event, includes the dns server IP, and the requests received.
Files summary: In the internal pie, it is represented the percentage of the file sources. In the external pie, the percentage of MIME types for every file source is shown.
HTTP method timestamp: Shows over time the HTTP events, separated by the HTTP method.
Top user agent: In the internal pie, the percentage of HTTP user agents is shown. In the external pie, the percentage of http response MIME types for every HTTP user agent is represented.
Top SIP user agent: Represents the percentage of SIP user agents types.
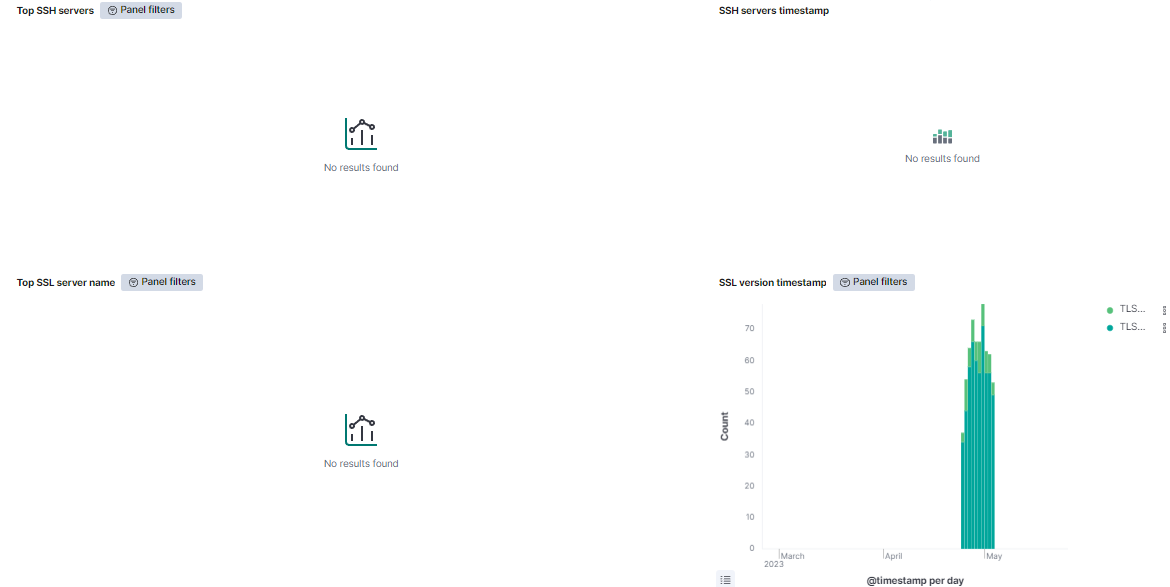
Top ssh servers: Shows a table with the top SSH servers. The table, for each event, includes the destination IP, the server banner, the client banner, and the amount of times this event is repeated.
SSH servers timestamp: Shows over time the SSH events, separated by the SSH server.
Top SSL server name: Shows a table with the top SSL servers subjects. The table, for each event, includes the SSL subject, the SSL version, the status, and the amount of times this event is repeated.
SSL version timestamp: Shows over time the SSL events, separated by the SSL version.
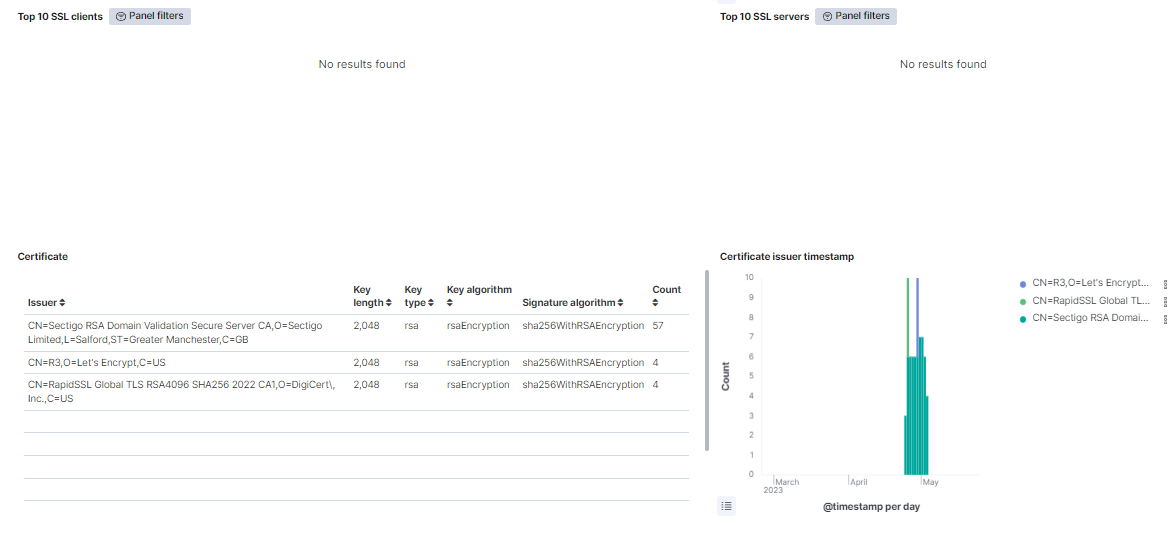
Top 10 SSL clients: Shows a table with the top 10 SSL clients. The table, for each event, includes the client IP, the ja3 (client fingerprint), the MAC, the EPT type, and the amount of times this event is repeated.
Top 10 SSL servers: Shows a table with the top SSL servers. The table, for each event, includes the server IP, the ja3s (server fingerprint), and the amount of times this event is repeated.
Certificate: Shows a table with the top certificate issuers. The table, for each event, includes the certificate issuer name, the key length, the key type, the key algorithm, the signature algorithm, and the amount of times this event is repeated.
Certificate issuer timestamp: Shows when the certificates are used, separated by the certificate issuer on a timeline.
3.2.3.4.3.4.6. Industrial protocols
The Industrial Potocols window displays views of the industrial protocol logs captured by the ON Sensors. These protocols are Bacnet (Building Automation and Control NETworks), ENIP (EtherNet/IP), Profinet (PROcess FIeld NETwork), Modbus, S7comm (Siemens S7 communication), DNP3 (Distribution Network Protocol version 3).
Bacnet: Shows a table with the Bacnet events. The table, for each event, includes the source IP, the destination IP, the abdu type, the bvlc function, the service, and the amount of times this event is repeated.
Top 10 Bacnet clients: Shows a table with the top 10 Bacnet clients. The table, for each event, includes the client IP and the amount of times this event is repeated.
Bacnet timestamp: Shows over time the Bacnet event, separated by destination IP.
Top 10 Bacnet servers: Shows a table with the top 10 Bacnet servers. The table, for each event, includes the server IP and the amount of times this event is repeated.
ENIP: Shows a table with the ENIP events. The table, for each event, includes the source IP, the destination IP, the command, the session ID, and the amount of times this event is repeated.
Top 10 ENIP clients: Shows a table with the top 10 ENIP clients. The table, for each event, includes the client IP and the amount of times this event is repeated.
ENIP timestamp: Shows over time the ENIP event, separated by destination IP.
Top 10 ENIP servers: Shows a table with the top 10 ENIP servers. The table, for each event, includes the server IP and the amount of times this event is repeated.
Profinet: Shows a table with the Profinet events. The table, for each event, includes the source IP, the destination IP, the index, the operation, the slot, the subslot, and the amount of times this event is repeated.
Top 10 Profinet clients: Shows a table with the top 10 Profinet clients. The table, for each event, includes the client IP and the amount of times this event is repeated.
Profinet timestamp: Shows over time the Profinet event, separated by destination IP.
Top 10 Profinet servers: Shows a table with the top 10 Profinet servers. The table, for each event, includes the server IP and the amount of times this event is repeated.
Modbus: Shows a table with the Modbus events. The table, for each event, includes the source IP, the destination IP, the modbus function, and the amount of times this event is repeated.
Top 10 Modbus clients: Shows a table with the top 10 Modbus clients. The table, for each event, includes the client IP and the amount of times this event is repeated.
Modbus timestamp: Shows over time the Modbus event, separated by destination IP.
Top 10 Modbus servers: Shows a table with the top 10 Modbus servers. The table, for each event, includes the server IP and the amount of times this event is repeated.
S7comm: Shows a table with the s7comm events. The table, for each event, includes the source IP, the destination IP, and the amount of times this event is repeated.
Top 10 S7comm clients: Shows a table with the top 10 s7comm clients. The table, for each event, includes the client IP and the amount of times this event is repeated.
S7comm timestamp: Shows over time the s7comm event, separated by destination IP.
Top 10 S7comm servers: Shows a table with the top 10 s7comm servers. The table, for each event, includes the server IP and the amount of times this event is repeated.
DNP3: Shows a table with the DNP3 events. The table, for each event, includes the source IP, the destination IP, the fc request, the fc reply, the IIN, and the amount of times this event is repeated.
Top DNP3 clients table: Shows a table with the top 10 DNP3 clients. The table, for each event, includes the client IP and the amount of times this event is repeated.
DNP3 timestamp: Shows over time the DNP3 event, separated by destination IP.
Top DNP3 servers table: Shows a table with the top 10 DNP3 servers. The table, for each event, includes the server IP and the amount of times this event is repeated.
3.2.3.4.3.4.7. Other protocols
The Other protocols window displays other protocol logs captured by the ON Sensor that do not match in the other windows. These protocols are DPD (Dynamic Protocol Detection), Syslog (System Logging Protocol) and FTP (File Transfer Protocol).
DPD: Shows a table with the DPD events. The table, for each event, includes the source IP, the destination IP, the analyzer, the protocol type, the failure reason, and the amount of times this event is repeated.
DPD Analyzer: Represents the percentage of the DPD analyzers detected.
DPD failures: Shows over time the DPD event, separated by the failure reason.
Syslog: Shows a table with the syslog events. The table, for each event, includes the source IP, the destination IP, the facility, the severity, the message, and the amount of times this event is repeated.
Syslog timestamp: Shows over time the syslog events, separated by destination severity.
FTP: Shows a table with the FTP events. The table, for each event, includes the source IP, the destination IP, the source host, and the amount of times this event is repeated.
FTP flow timestamp: Shows over time the data bytes of the FTP traffic, separated by destination IP.
3.2.3.4.3.4.8. Location
The Location window displays views about the location of the logs captured by the ON Sensor.
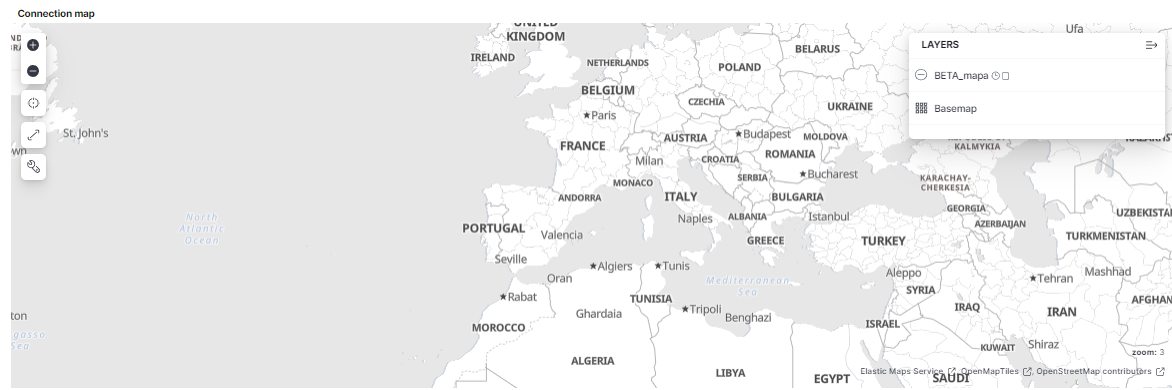
Connection map: Shows in a map from what part of the world is the traffic coming, and depending of the traffic density, the circle is bigger or smaller.