3.2.3.4.3.1. Visibility Overview
The “Visibility Overview” dashboard provides an overview of all the user devices connected to the network. It categorizes them based on their endpoint type and displays the characteristics associated with them.
We can see the following views on this dashboard, starting from the header:
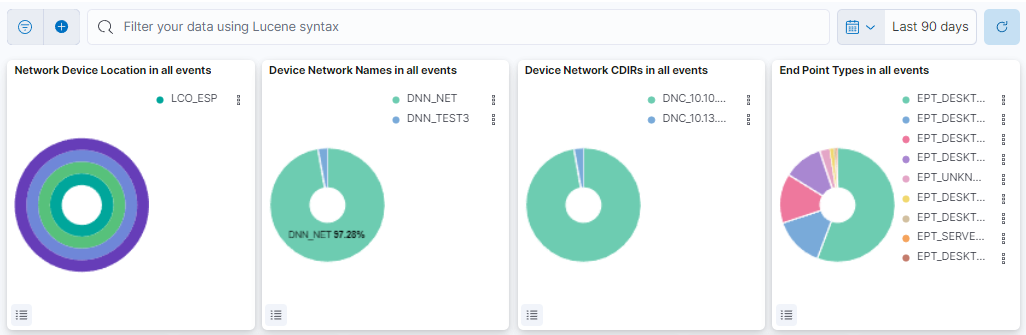
This header composed of four dashboards allows filtering by Network Device Location, Device Network Name, Device Network CDIRs, Endpoint Types. It will always look for the temporary index that is regenerated every day. In this toolbar, filter your data using Lucene syntax.
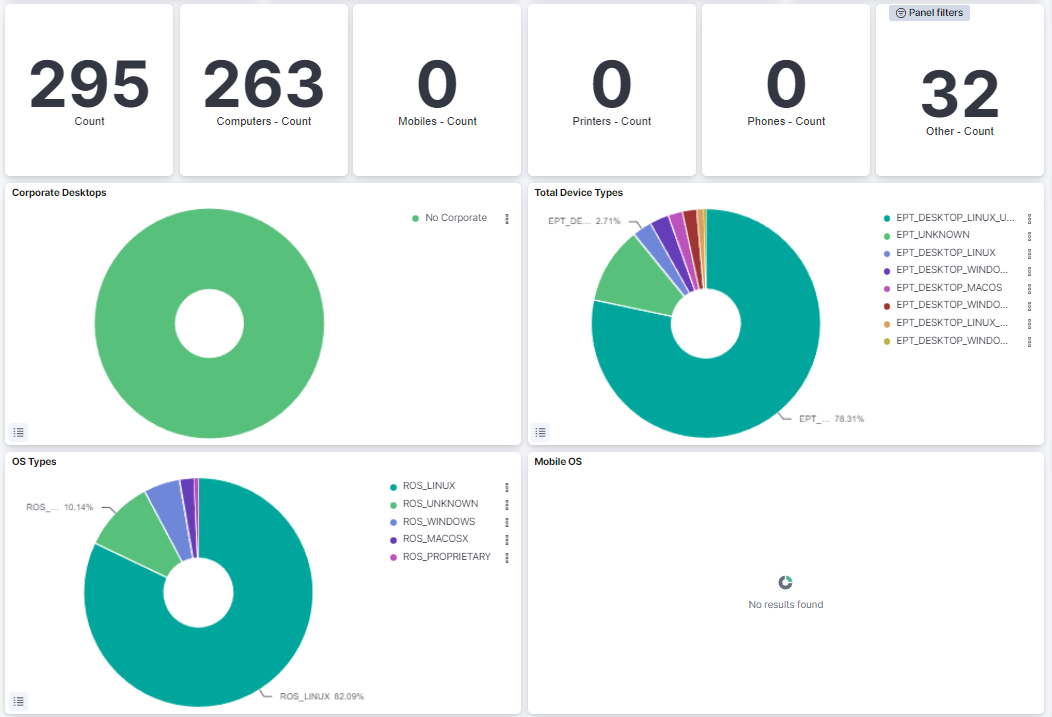
Total Devices: Shows the number of total devices in the network.
Computers: Shows the number of total computers in the network.
Mobiles: Shows the number of total mobiles in the network.
Printers: Shows the number of total printers in the network.
Phones: Shows the number of total phones in the network.
Other: Shows the number of the other devices in the network.
Corporate Desktops: Represents the percentage of corporate devices and no corporate devices.
Total Device Types: Represents the percentage of EPT (Endpoint Type) tags.
OS Types: Represents the percentage of the operating systems from all the devices in the network.
Mobile OS: Represents the percentage of the operating systems from the mobiles in the network.
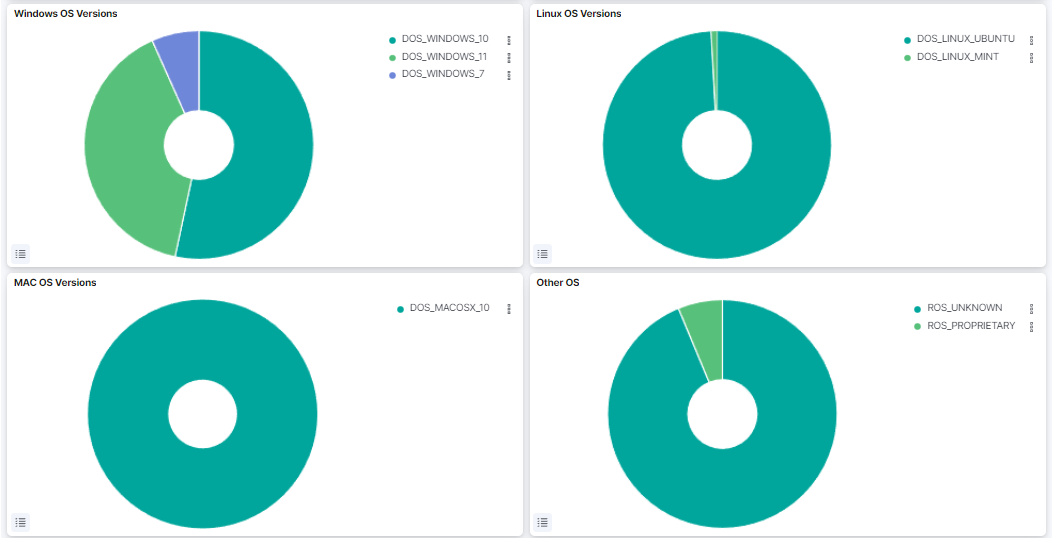
Windows OS Versions: Represents the percentage of the Windows versions found in the network.
Linux OS Versions: Represents the percentage of the Linux versions found in the network.
MAC OS Versions: Represents the percentage of the MAC OS versions found in the network.
Other OS: Represents the percentage of the other operating systems found in the network.