3.2.3.4.5.2. Segmentation Metrics
The Segmentation Metrics dashboard displays information about RADIUS requests. We can see the following views on this dashboard:
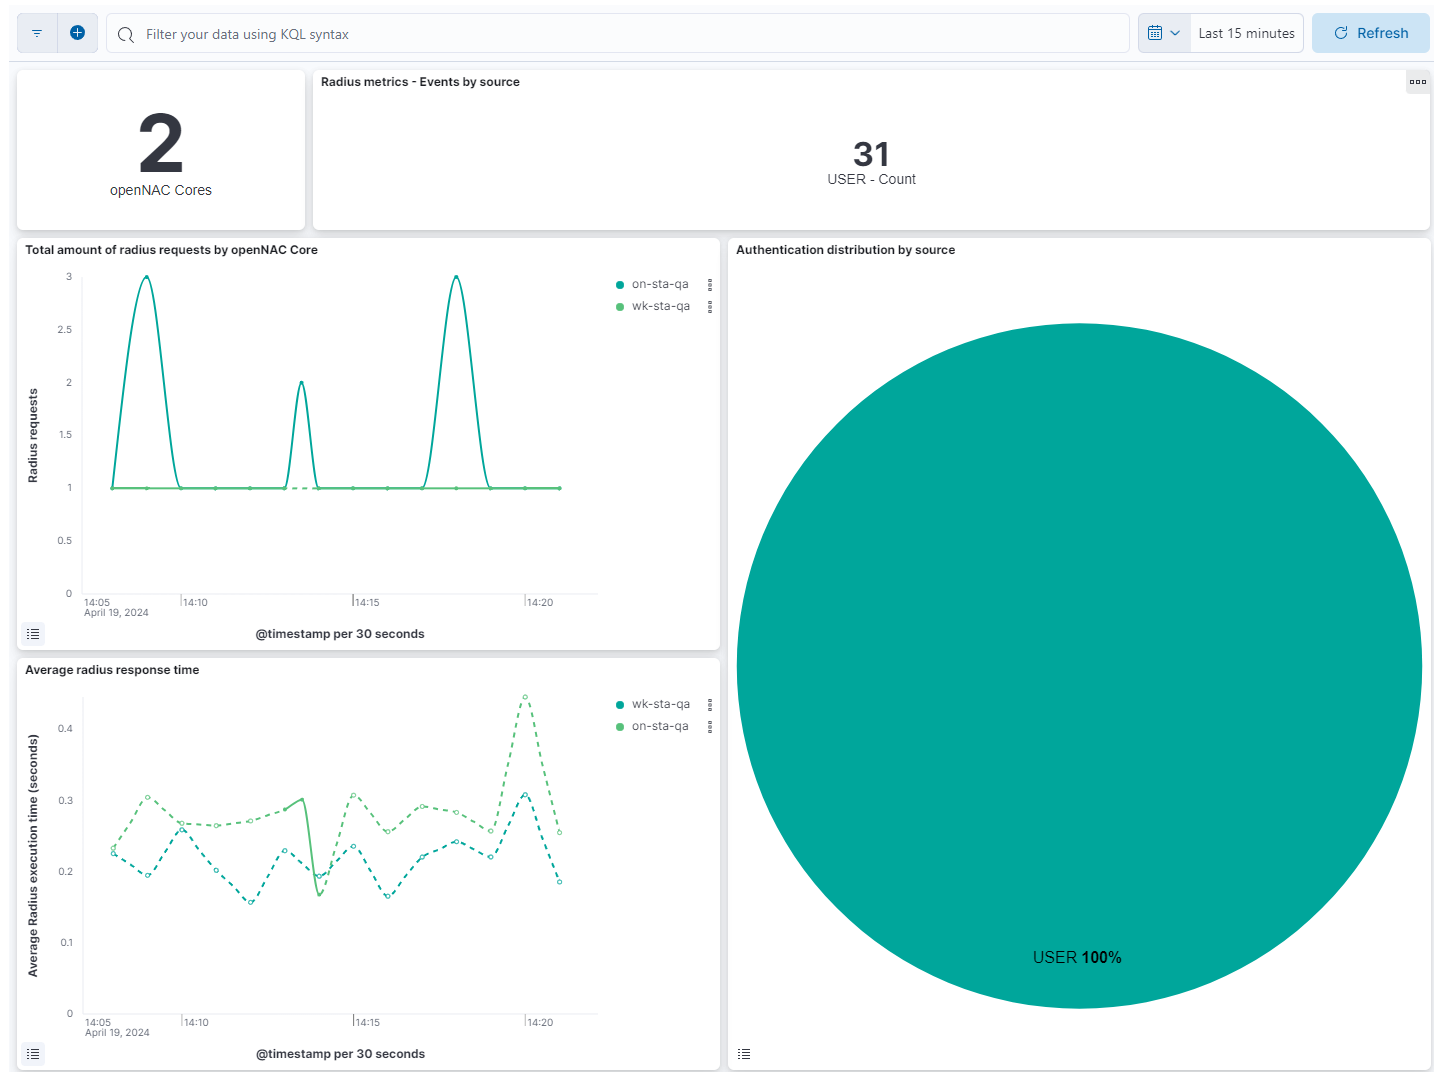
openNAC Cores: Shows the number of openNAC cores.
Metrics - Events by type: Shows the number of each openNAC source.
Total amount of radius requests by openNAC Core: Displays the total radius events for every host on a timeline.
Authentication distribution by type: Represents the percentage of the different radius sources.
Average radius response time - Seconds: Displays the average of execution time for radius events for every host on a timeline.
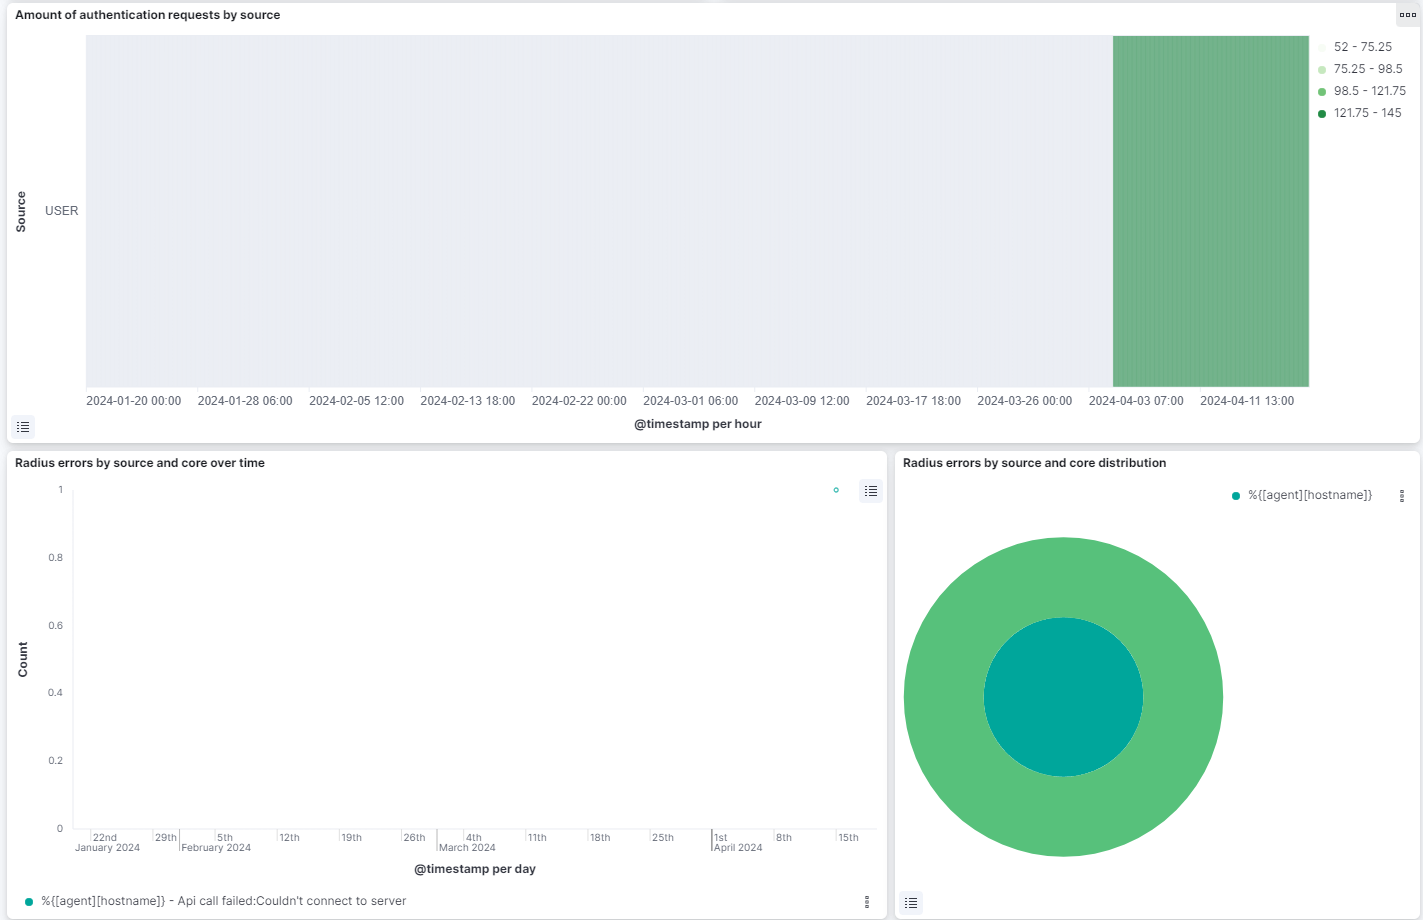
Heat Map - Amount of authentication requests by type: Shows a heatmap relating the radius source with hourly radius events count.
Radius errors by type and core over time: Displays the total radius events with error separated by the host and the error message type on a timeline.
Radius errors by type and core - Pie: the internal pie represents the percentage of hosts. The external pie represents the percentage of the radius error message types.