Sensor Mode
1. DEFINITION (What is it?)
This module enables you to visualize in real-time your network events, you gain visibility of your network through a passive service that inspects, in-depth, all traffic and shows the network activity at a high-level for comprehensive proposals, it includes http(s) sessions (web traffic) with the requested URL, DNS request and replies (Internal and external requests), SMTP sessions (e-mail traffic) and much more; based on this collected information you can configure different types of policies to improve your networks security.
2. MECHANISMS (How does it work?)
To achieve the goal of collecting all relevant information and presenting it to administrators correctly, network security staff need to be empowered to make decisions to improve and optimize network performance.
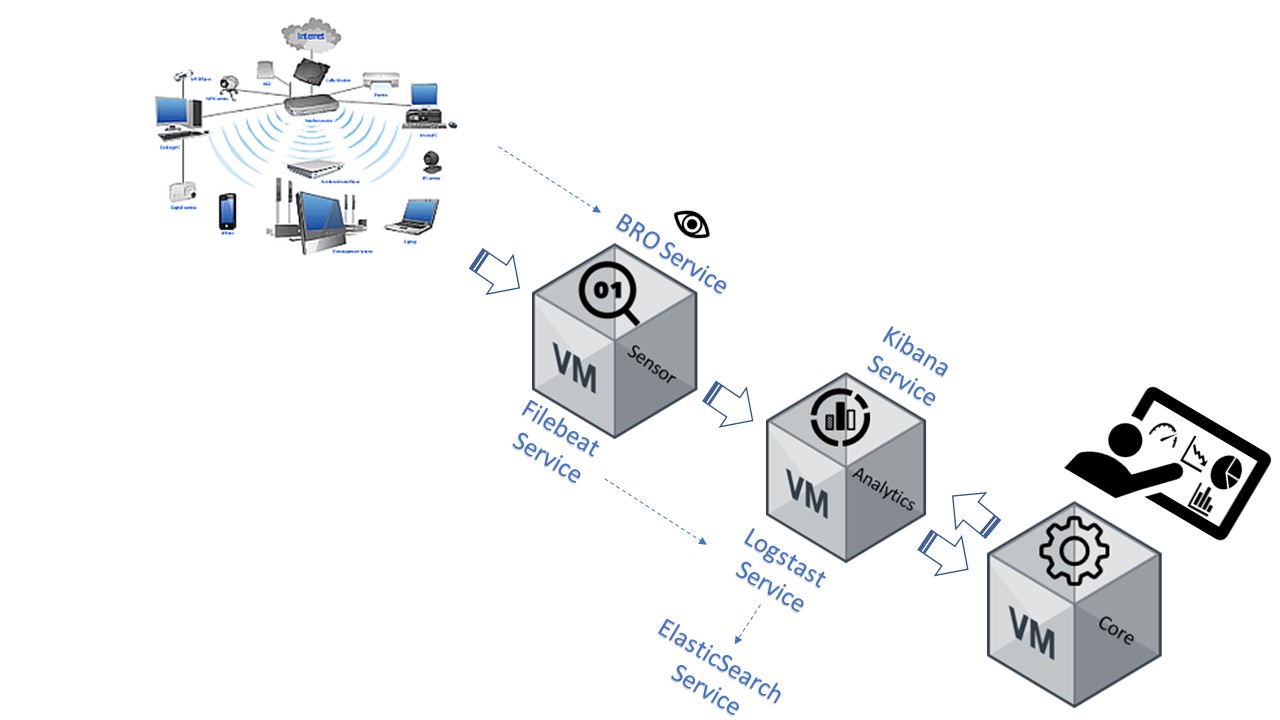
OpenNac deployment involves 3 devices, Sensor, Core and Analytics. Each device has its own specific services. Sensor collects all information form the network using the BRO-IDS service and a portspan of the network device, the collected information is sent to Analytics using the Filebeat service. Analytics receives the information using the Logstash service, later the Elasticsearch service saves the information in different files and tables. Finally, the Kibana service accesses the files and tables in accorandance to the administrator web portal configuration. The administrator views the information using the dashboards through the Core device web console and uses the information according to specific needs / interests.
3. COLLECTED INFORMATION (What do we collect?)
The Sensor should connect to the network device via portspan and all information that passes trough that device will be collected by the sensor, this device collects many application-layer protocols including DNS, FTP, HTTP, IRC, SMTP, SSH, SSL. Analysis of file content exchanged over application-layer protocols. The administrator can set access policies using the collected information as the source, this information can be used to set different kind of tags for any network device and based on these tags execute / enforce different actions on each device.
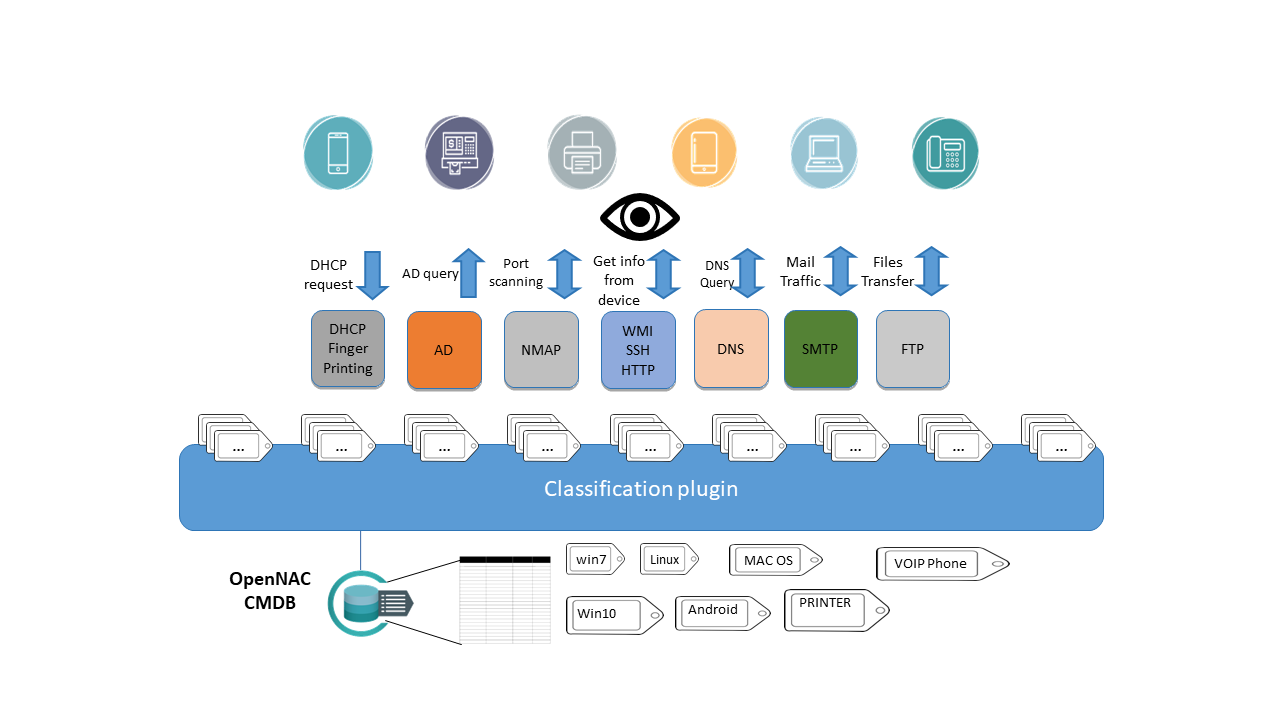
Based on the collected information OpenNac can apply different tags for any network device, later using the tags the administrators will create the access control policies.
- DHCP fingerprint: It is possible to extract a lot of information about the asset (device) based on DHCP events, ip address, mac address, name of device, type of device based on dhcp class field and many others.
- AD Queries: Using AD queries it is possible to identify if the discovered asset is being managed by the active directory and identify then if it is a corporative asset.
- NMAP: Enables the system to have advanced scanning capabilities that grows the active scanning as needed, port scan, banner extraction and many others are used and normalized.
- WMI: Used with Windows devices we can launch commands and tasks to provide deep discovery and profiling tasks without any agent install, wmi credentials must have specific persmissions to carry out the queries and processes.
- SSH: We can use ssh credentials to connect to network devices to launch commands and tasks to gain deep discovery and profiling without any agent installation.
- HTTP: Launch HTTP queries to identify banners and get information in order to exactly identify the assets connected into the network.
- DNS Queries: Using DNS queries we can identify which are the top internet and intranet visited web or server sites
- SMTP: Listening to this protocol you can see the e-mail traffic, analyze the peaks, and the network devices related with those peaks.
- FTP: Via this protocol you can take actions in regards to network file transfer policies.
Sensor device listens to all network traffic so all the network protocols will be inspected and the policies can be configured according with the defined network security policy.
You can use the information collected by the sensor as a source to apply policies, for example you can run a plugin for each device that matches with a specific policy.
4. DASHBOARD (How do we display the information?)
The information can be visualized in different ways and formats.
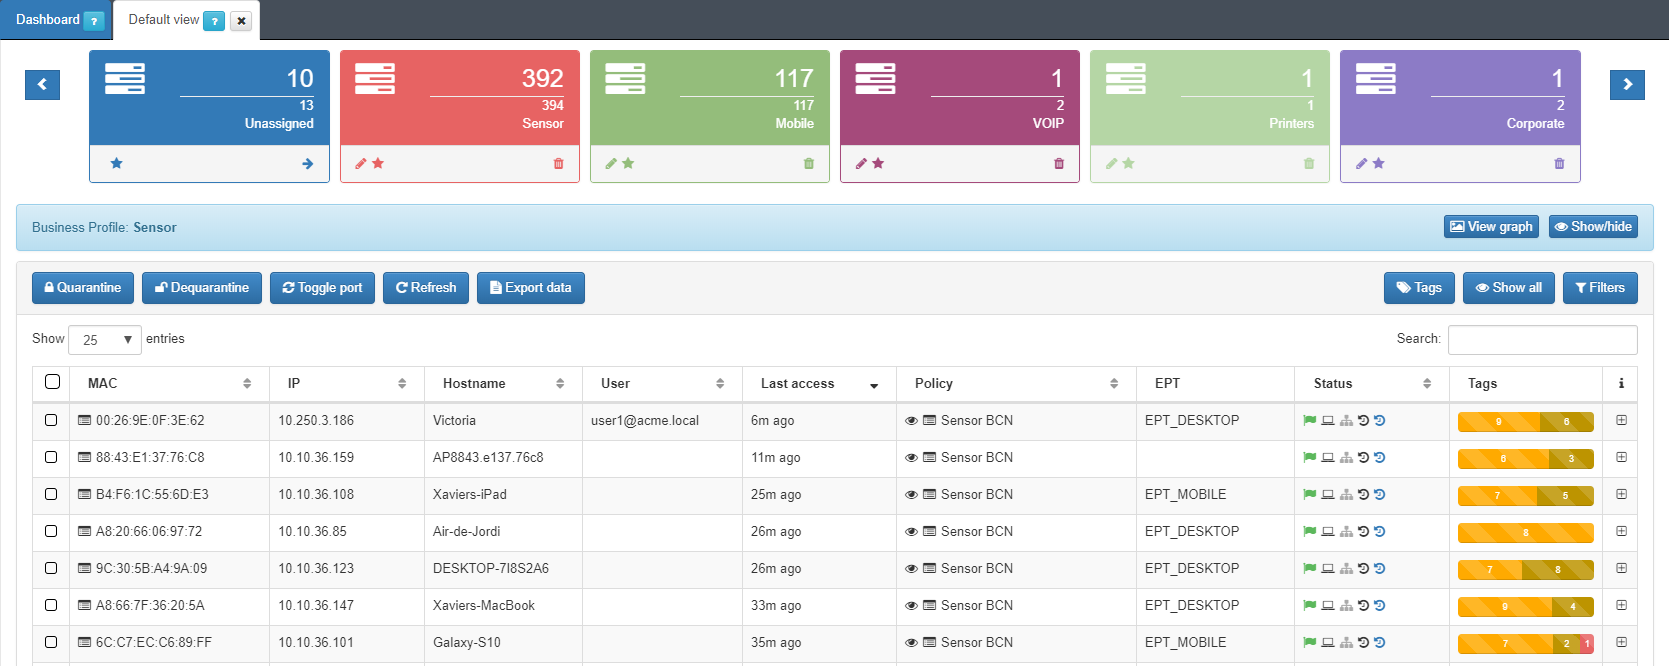
- Business profiles: Enables us to group different policies then identify the assets that match with these network access rules.
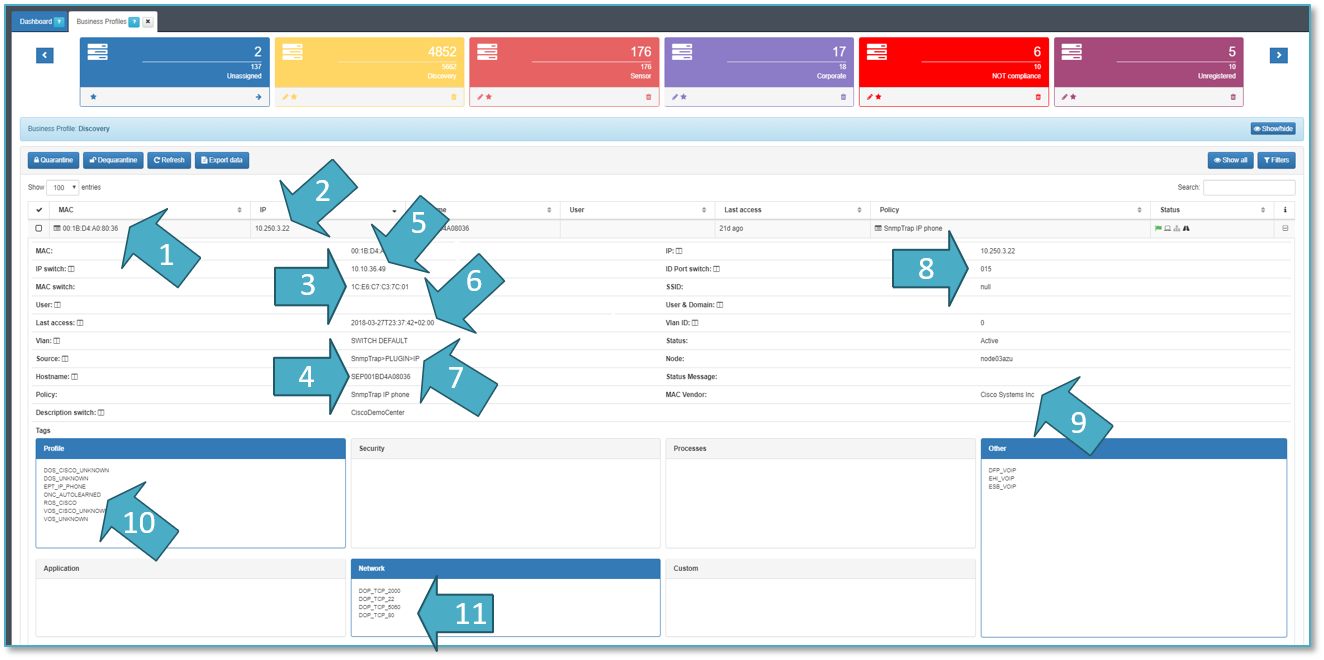
- USERDEVICE MAC ADDRESSES: 00:1B:D4:A0:80:36
- USER DEVICE IP ADDRESSES: 10.250.3.22
- NETWORK DEVICE MAC ADDRESS: 1C:E6:C7:C3:7C:01
- DEVICE NAME:SEP001BD4A08036
- NETWORK DEVICE IP ADDRESS: 10.10.36.49
- TIME: 2018-03-27T23:37:42
- SOURCE OF INFORMATION: SnmpTrap -> PLUGIN -> IP
- PHYSICAL PORTS: interface 0/15
- MAC VENDOR: Cisco Systems Inc.
- TYPE OF DEVICE: EPT_IP_IPHONE.
- OPENPORTS and BANNERS: DOP_TCP_5060
TAGS: open ports, device profile and other such as ROS_CISCO, ESB_VOIP.
- CMDB View: openNAC includes an internal CMDB that stores all assets and its configuration information, it is possible to filter and serach by tags as shown below:
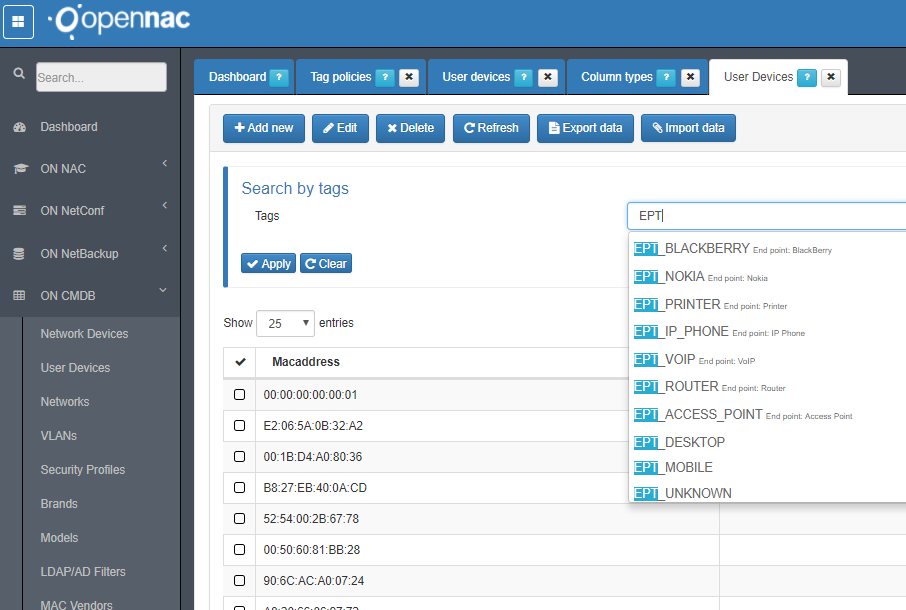
The tag EPT means End Point type.
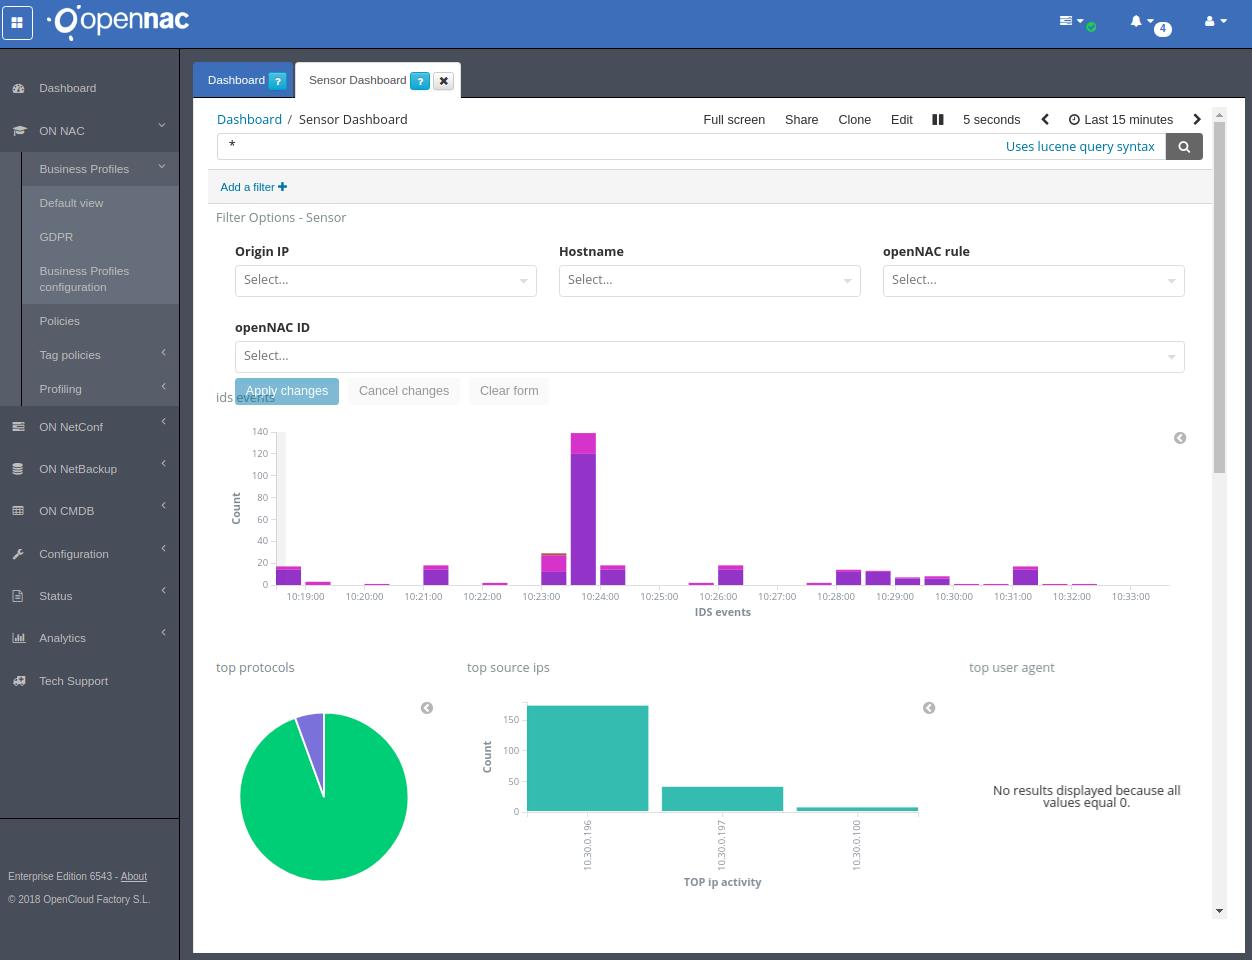
- Sensor Dashboard: Many different ways for visualizing the collected information are predefined, for example you can verify the top services used on the local network, the top used ports and DNS queries and much more.
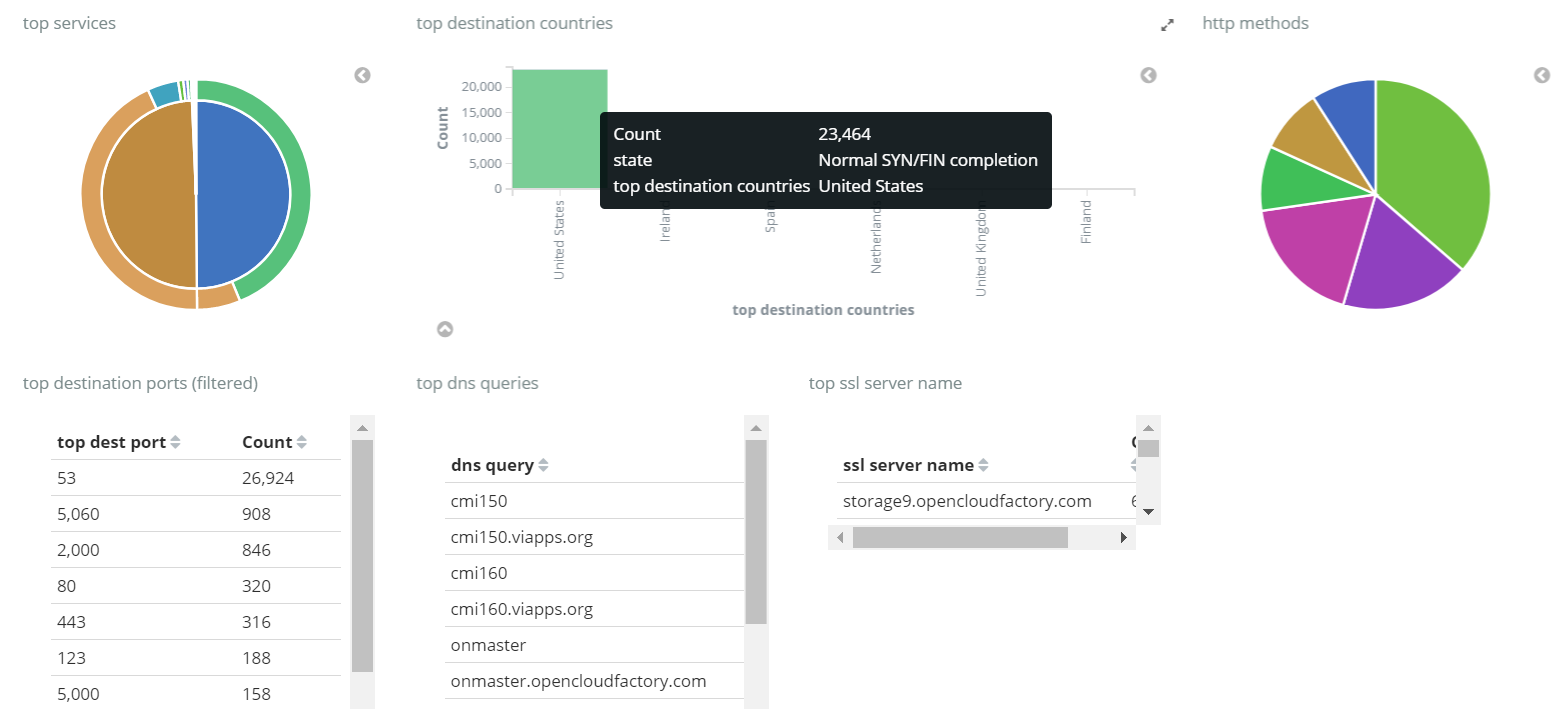
OpenNac can set an specific dashboards for a particular deployment. So if you want to customize the dashboard for monitoring a specific network issue that is possible with OpenNac.
5. DEPLOYMENT (Do it yourself)
- It is recommended that you follow and read the overview about openNAC solution.
- To deploy an openNAC technology you must understand and follow network requirements.
- As soon as you have deployed the openNAC you must select the correct use case that suits your requirements.
- Selecting the use case, a scenario must be configured to cover the customers needs.
This page describes which steps are required to configure the visibility use case and the scenario for Sensor Mode.
5.1 REQUIREMENTS FOR Sensor MODE:
openNAC Core + openNAC Sensor + openNAC Analytics + network device (switch,ap) + client PC.
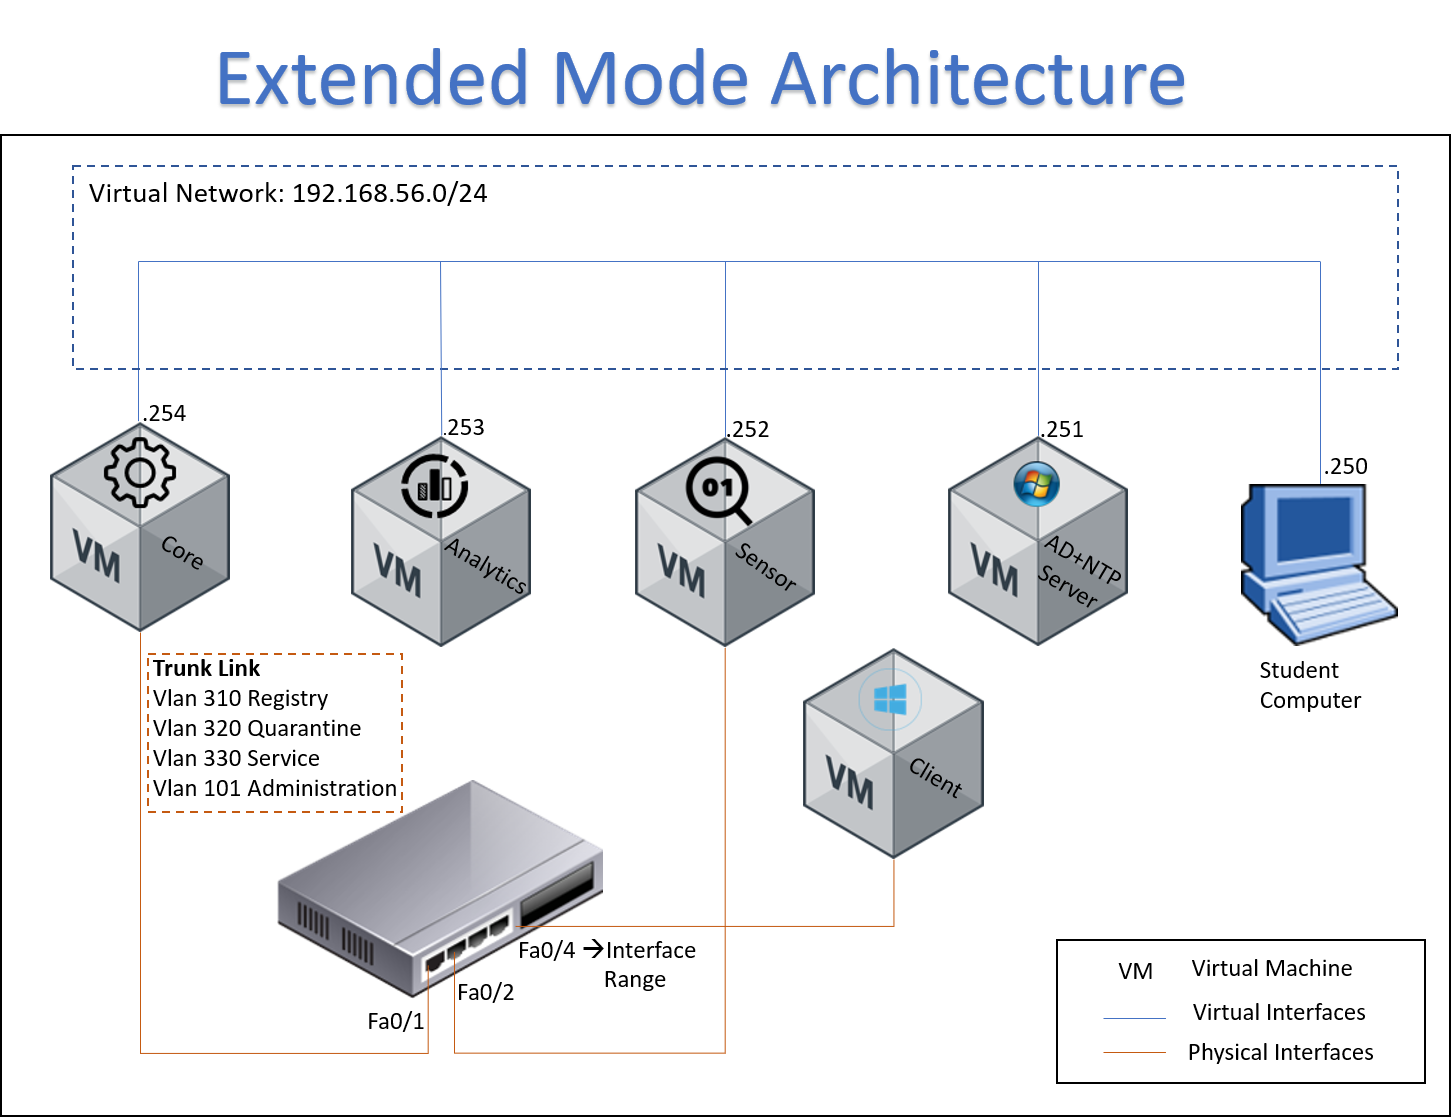
5.2 SCENARIO ARCHITECTURE
The following image shows the Sensor Mode flow, it can be used to clarify how it works, and it is useful for troubleshooting.
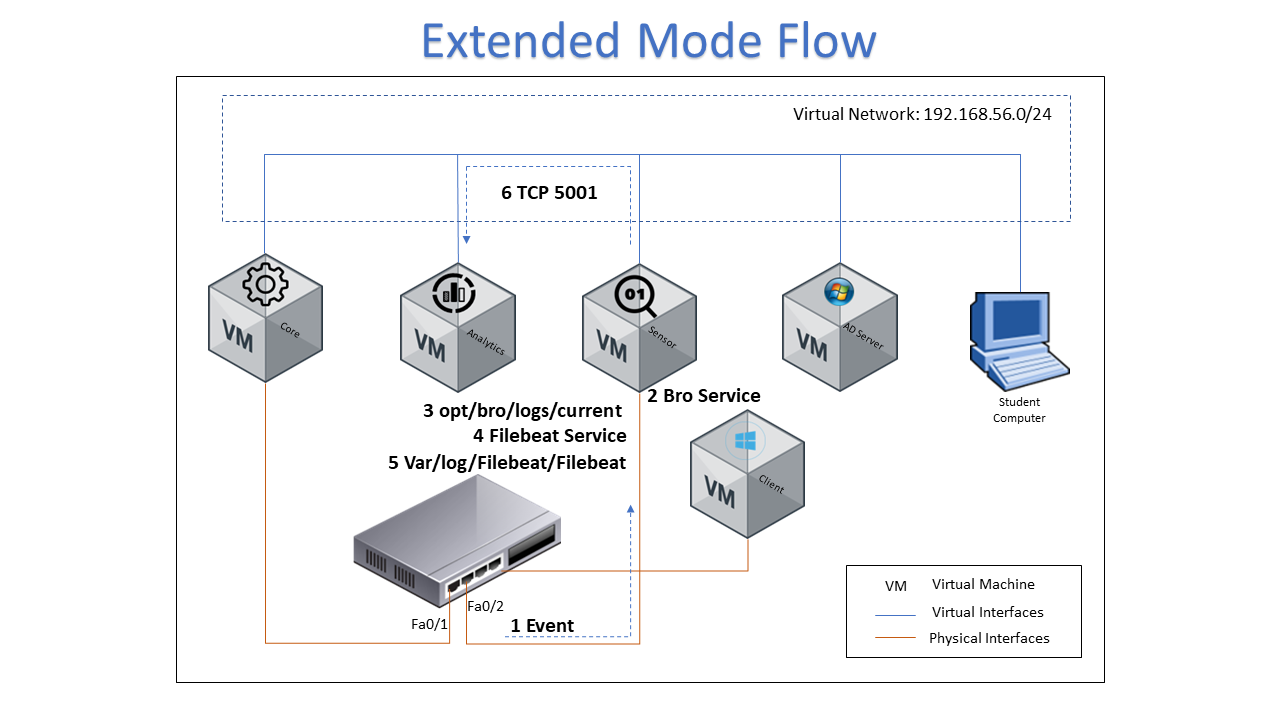
- An event is generated on a network device which is sent to the interface that connects to the ON Sensor
- Bro-IDS service should be enabled on the ON Sensor machine for catching the events from the span port
- You can verify that the information has been written to opt/bro/log/current
- The Filebeat service should be enabled on the ON Sensor machine to send events to ON Analytics device
- The var/log/filebeat/filebeat file is written
- ON Sensor device sends the information to ON Analytics device for processing using TCP protocol port 5001
- Logstash should contain the collected information, verify it through the web console
5.3 SENSOR MODE SETTINGS:
ON Core
Start and configure openNAC Core.
ON Analytics
Start and configure openNAC Analytics
Switch
The first step to take on the switch is to select and configure the Span port. Please review the following link to check the basic configuration needed for span port.
On Sensor
Using DHCP reader from sensor. The difference with sensor is that the information captured should be performed on top of pf_ring, so you should edit the file /etc/sysconfig/dhcp-helper-reader.
vim /etc/sysconfig/dhcp-helper-reader

        OPTIONS="-r <interfaz de captura> -s <oncore> -q <oncore>"

After editing restart the service:
- For openNAC versions before 6002 use service command
service dhcp-helper-reader restart
- For openNAC versions 6002 and later use systemctl command
systemctl restart dhcp-helper-reader
In a specific deployment with several nodes use:
OPTIONS="-r <interfaz de captura> -s <onmaster> -q <VIP Cola (TCP/4730)>"
service dhcp-helper-reader restart
systemctl restart dhcp-helper-reader
On Core
Stop the dhcpd service.
service dhcpd stop
Configure the pre-routing firewall rule, and restart the service.
vim /etc/sysconfig/iptables
-A INPUT -s 192.168.56.252 -p tcp -m state --state NEW -m tcp --dport 4730 -j ACCEPT
service iptables restart
You can verify the firewall rules using:
iptables -L -nv
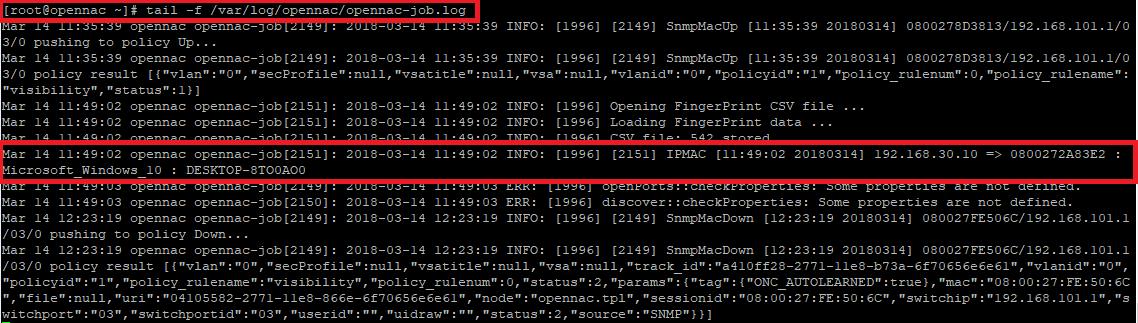
You can verify the logs in opennac-job.log file
tail -f /var/log/opennac/opennac-job.log
5.4 PROFILING:
As a first part of visibility use case implementation, OpenNac can separate the discovered devices according with its type, if is phone, desktop, printer, server, etc. This objective can be accomplished using the collected information and checking different parameters as O.S, DHCP fingerprint, ports, etc.
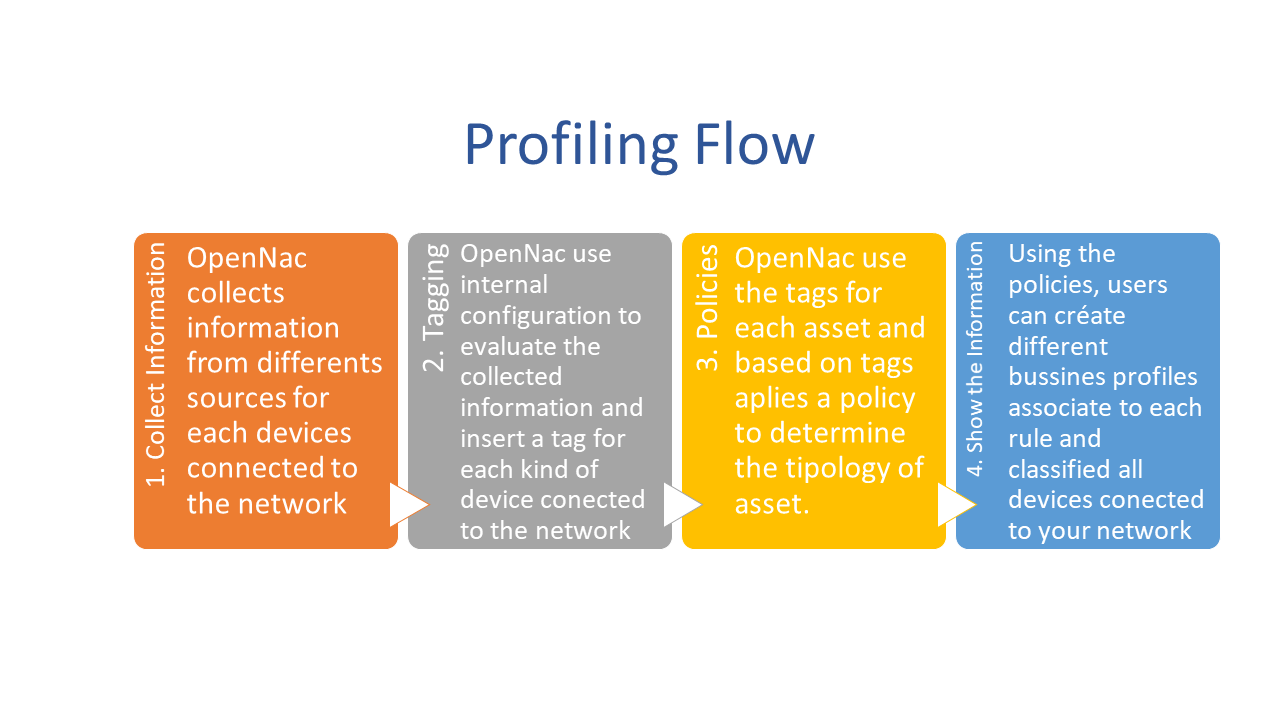
- The first step is collect the information using visibility use case configuration, it can be done using traps, sensor, DHCP traffic, etc. VisibilityUseCase
- The second step is tag the discover devices using different parameters. These parameters can be edited:
- Review: ON NAC –> Profiling –> User devices. OpenNac checks MAC vendor, used ports, DHCP fingerprint and based on these information classifies the devices.
OpenNac core includes a pre-defined profiling rules for each devices, but according with the deployment the user can customized the evaluated parameters.
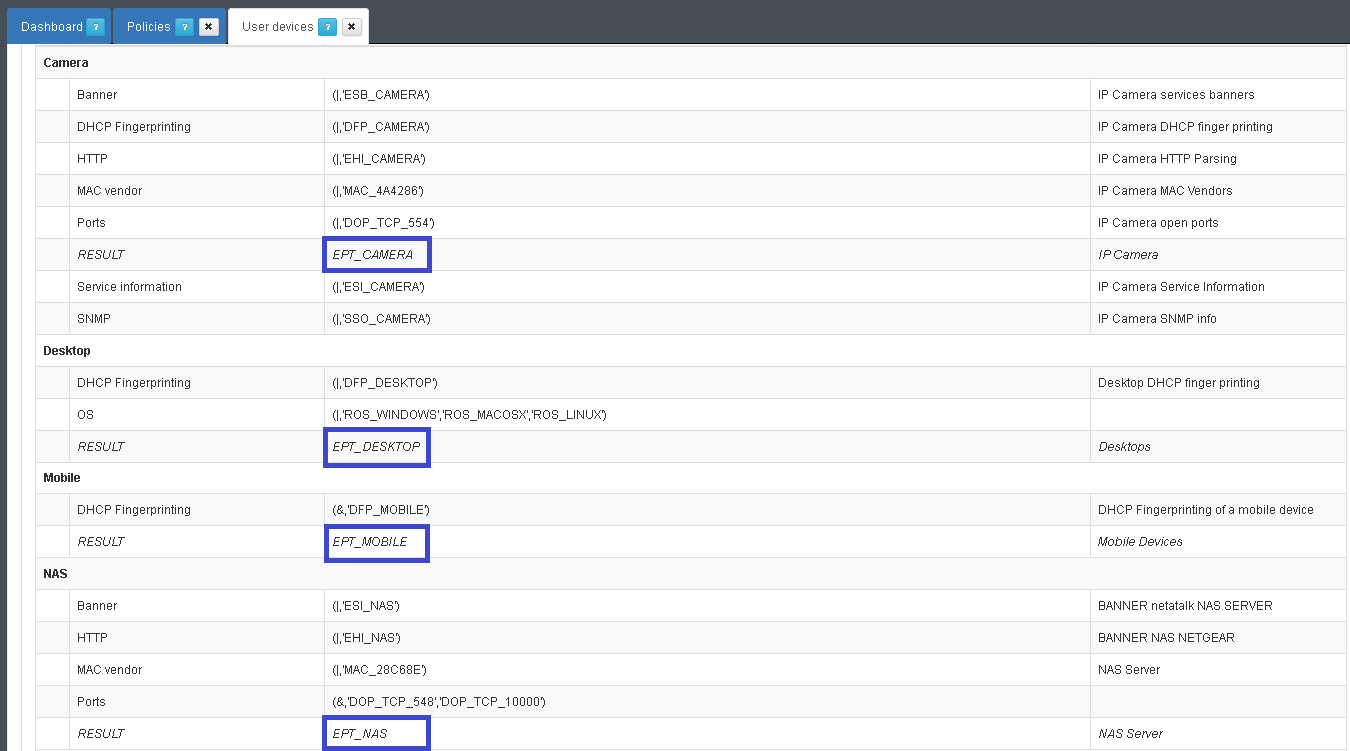
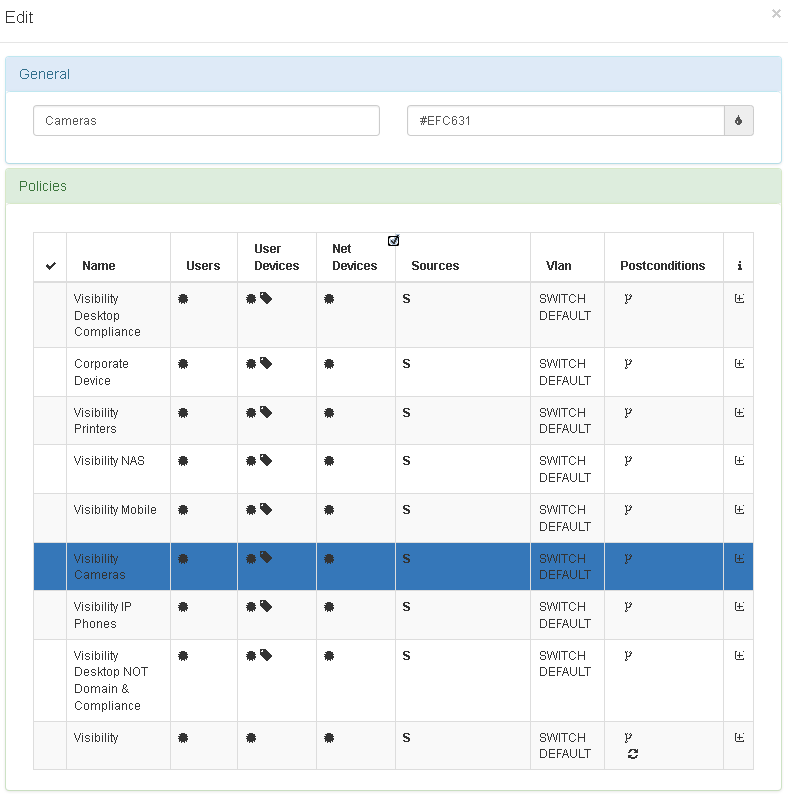
- The third step is set the policy based on tag, there’re several predefined tags but is possible to customize.
- Review: ON NAC –> Policies
- The last step is associate the policy to business Profile
- Review: ON NAC –> Business Profiles
5.5 TESTING
Connect a client to switch interface. Open the web administration console and go to Analytics -> Sensor Dashboard and check the collected information from sensor device.
5.6 TROUBLESHOOTING FOR SENSOR MODE
- Please perform a basic review Basic Check
- You can verify the link Sensor Troubleshooting