Sensor
The Sensor device is composed basically by two interfaces:
- Administration Interface
- Traffic Capture Interface
The sensor establish communication with Analytics and Core Device.
- When the communication is established with Analytics is for sending logs, using the logstash service.
- When the communication is established with Core is for read the packets from DHCP helper readers, access to two main services Redis and queue services gearmand.
The sensor data flow shows how the events information is collected by sensor device. You can use it to approach your troubleshooting for sensor issues.
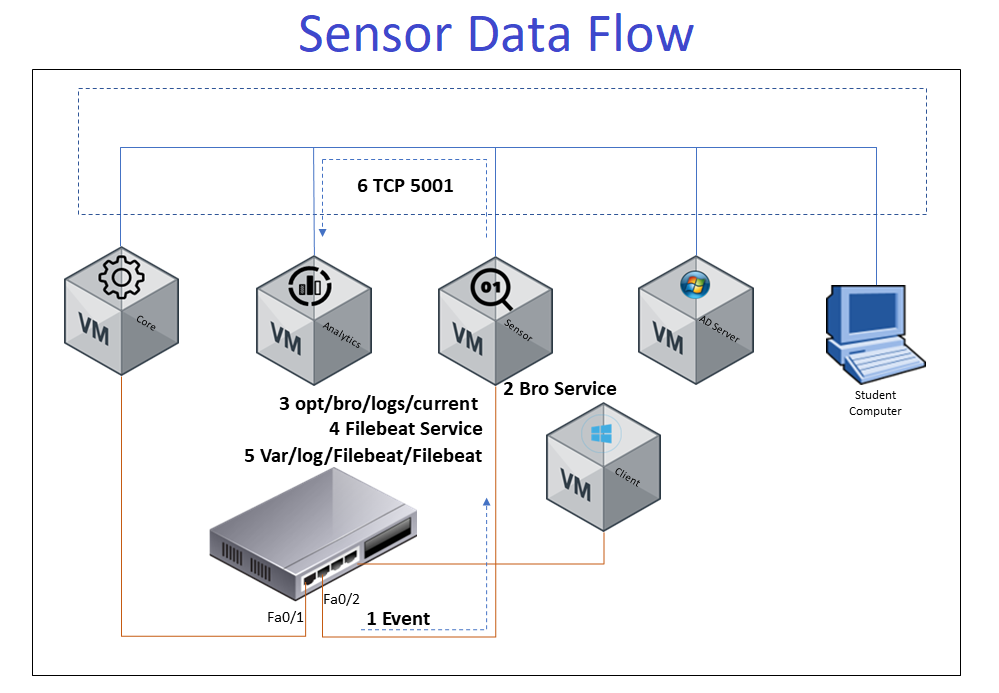
Main Services
- Bro service: is basically an IDS, listen and analyzing the network packets for creating log files
- Filebeat service: Read the log files creating by BRO and send these files to Analytics
- DHCP Helper Reader: Based on network traffic, read the DHCP packets and validate if these packet need to be analyzed by core, this service is present in any openNAC server, but in sensor is very interesting enable it to in addition to listen the network traffic process the DHCP packets.
- Healthcheck: Is an openNAC’s monitoring module. It has the service checks that can guarantee that all of openNAC’s needed services are up and running. The Healthcheck process is excecuted by cron every minut. You can check if the configuration of cron is fine:
cat /etc/cron.d/opennac-health
Compare the output with the next line:
* * * * root cd /usr/share/opennac/healthcheck; ./healthcheck.php -o redis >> /var/log/opennac/healthcheck.log 2>&1
This first step to troubleshoot any openNAC device is to execute the healthcheck.
You can execute a complete review in this directory /usr/share/opennac/healthcheck using the command php healthcheck.php
php /usr/share/opennac/healthcheck/healthcheck.php
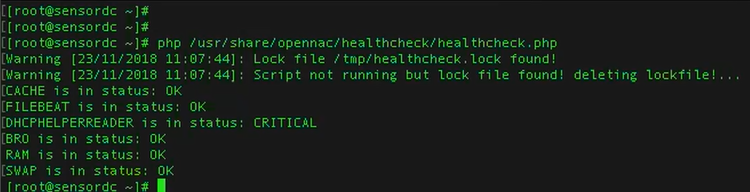
This example shows the DHCPHELPERREADER service as critical
DHCP Helper Reader Service
So verify if the service is disable, and enable it as you consider using the next commands:
systemctl (start|stop|restart|status|enable|disable) dhcp-helper-reader
You can modify or add the interface from where Sensor is recived packets:
vim /etc/sysconfig/dhcp-helper-reader
If running on a core, leave empty, so it will listen port 67 on all interfaces and connect to redis and gearmand on localhost.
#OPTIONS=
If running on a sensor, configure as below:
OPTIONS="-r interface1 interface2 -s onmaster -q oncore"
Restart dhcp-helper-reader service:
systemctl restart dhcp-helper-reader
Review the traffic on local interface using the tcpdump service, in this case we are using the core IP address:
tcpdump -Nnl -i eth0 host 172.16.3.4
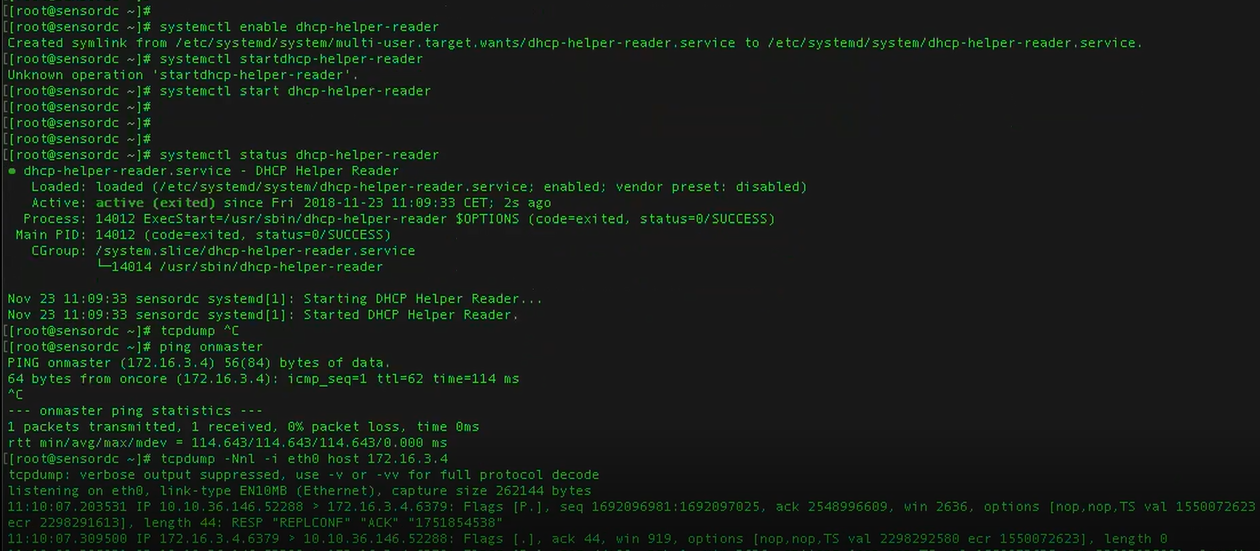
The image shows the traffic related with port 6379, this port is using by Redis service, so we can guarantee the DHCP helper reader service is running normally.
Bro Service
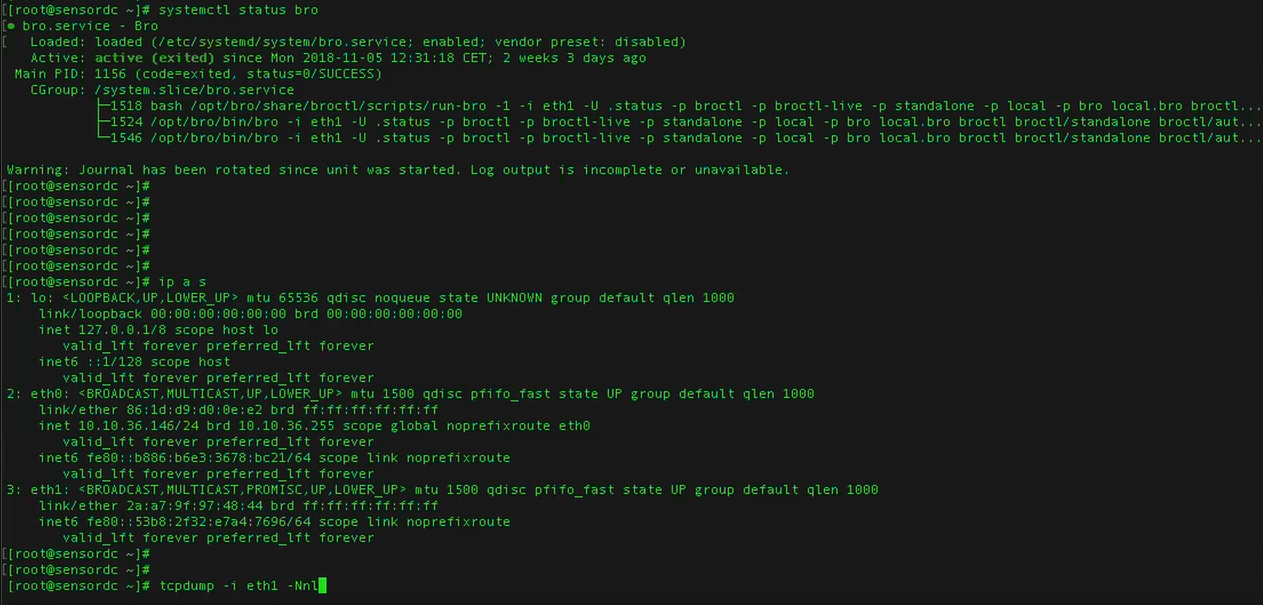
Managing service Bro:
systemctl (start|stop|restart|status) bro
ps -ef | grep bro
You can also verify the interface associated to BRO service, and if there is traffic being listening on it.
tcpdump -i eth1 -Nnl
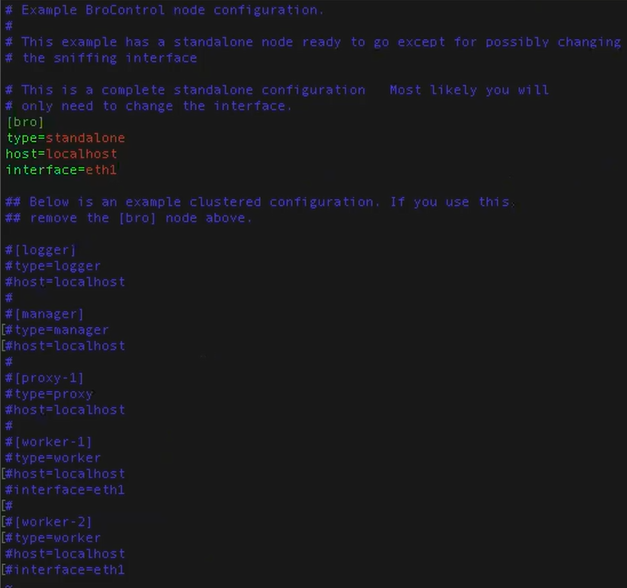
Check if BRO service is correctly configured:
vim /opt/bro/etc/node.cfg
- Listening only one interface, (only need to change the interface):
[bro]
type=standalone
host=localhost
interface=interface_name
- Listening several interfaces we need several workers:
[logger]
type=logger
host=localhost
[manager]
type=manager
host=localhost
[proxy-1]
type=proxy
host=localhost
[worker-1]
type=worker
host=localhost
interface=interface1_name
[worker-2]
type=worker
host=localhost
interface=interface2_name
Check bro files:
You can also check the disc space, by default the BRO logs are on path /opt/bro/, verify this partition has free space
cd /opt/bro/
ls -l
dh -h
If you see the partition full, you can erase some files on /opt/bro/logs each file on this path contains an entire day of logs. The file current contains the actual day logs.
You can modify the log rotation configuration in the file broctl.cfg in the path /opt/bro/etc.
The files on opt/bro/logs/current should be write
Check if BRO service is creted and updated log files. We have to view files as conn.log, dns.log or dhcp.log
cd /opt/bro/logs/current
ls -la
You can change the listen interface, the interface associate to BRO service. You can acomplish this task modifying the file node.cfg in the path /opt/bro/etc/
cd /opt/bro/etc/
vim node.cfg
PF_RING
Check if PF_RING service is correctly configured:
vim /etc/pf_ring/interfaces.conf
#MANAGEMENT_INTERFACES="eth0"
CAPTURE_INTERFACES="eth1"
Note
In the case of having more than one capture interface, after the name of the first interface a space will be left and then the name of the second one will be written. For example CAPTURE_INTERFACES=”eth1 eth2”
Filbeat Service
The configuration files are in /etc/filebeat/, this service read the files collected by BRO and sending to Analytics.
Managing service Filbeat:
systemctl (start|stop|restart|status) filebeat
ps -ef | grep filebeat
The filebeat file on var/log/filebeat should be write
Check filebeat log:
cd /var/log/filebeat
ls -la
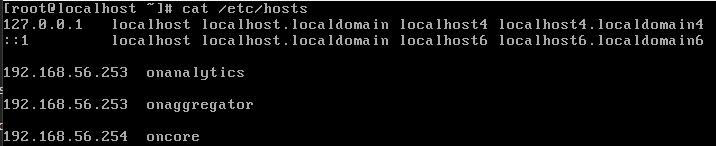
Make sure the hosts file on /etc has been properly configured, remember that Analytics, Aggregator IP must be set.
Ports
The port using for communication between Sensor and Analytics is tcp 5001
netstat -ano | grep 5001
Or you can verify the trying telnet to onaggregator (Analytics) using this port.
telnet onaggregator 5001
Verify the log traffic using tcpdump
tcpdump -Nnl -i eth0 port 5001
These packets are being sending to logstash service in Analytics server.