Analytics
Main Services
- Logstash service
- ElasticSearch service
- Kibana service
Logstash Service
Managing service Logstash:
systemctl (start|stop|restart|status) logstash
Check Logstash files:
tail -f /var/log/logstash/logstash.log
tail -f /var/log/logstash/logstash.err
tail -f /var/log/logstash/logstash.stdout
Verify Logstash ports:
First find the id process, later verify the associated port. The first command let you know which is the process id for logstash, the second one which is the used port by logstash process.
ps ax | grep logstash
netstat -anp | grep 1026/java
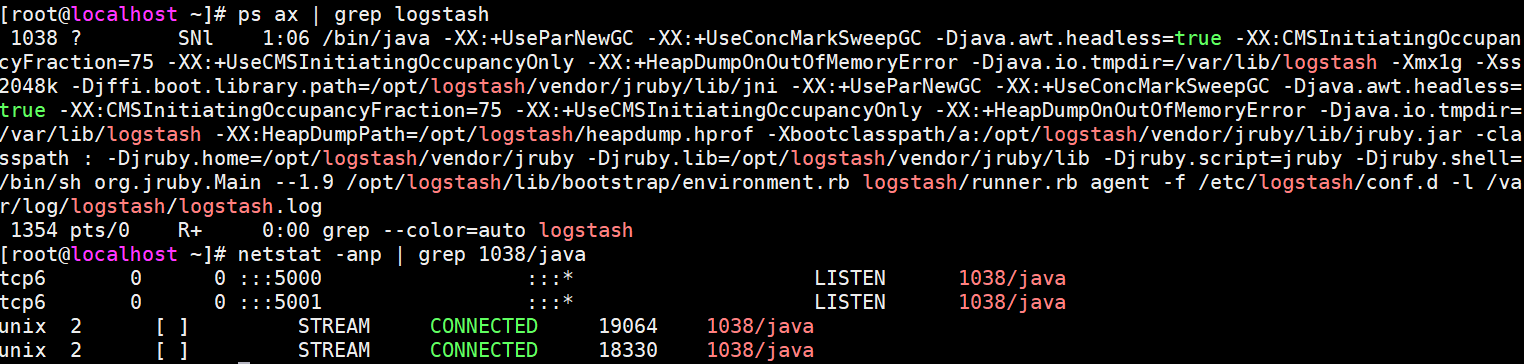
5000/TCP
Process running:
ps –ef | grep "logstash"
ElasticSearch Service
Managing service ElasticSearch:
systemctl (start|stop|restart|status) elasticsearch
Check ElasticSearch log:
tail -f /var/log/elasticsearch/elasticsearch.log
Data location:
ls /var/lib/elasticsearch/elasticsearch/nodes/0/indices/
Verify ElasticSearch ports:
First find the id process, later verify the associated port.
ps ax | grep elasticsearch
netstat -anp | grep 1031/java
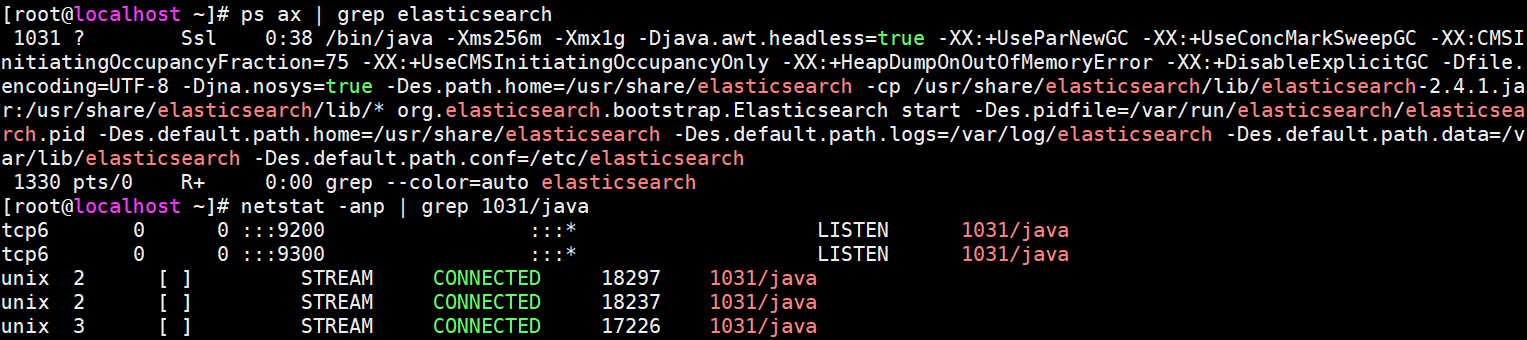
9200/TCP 9300/TCP
Process running:
ps –ef | grep "elasticsearch"
Kibana Service
Managing service Kibana:
systemctl (start|stop|restart|status) kibana
Verify Kibana ports:
First find the id process, later verify the associated port.
ps ax | grep kibana
netstat -anp | grep 723
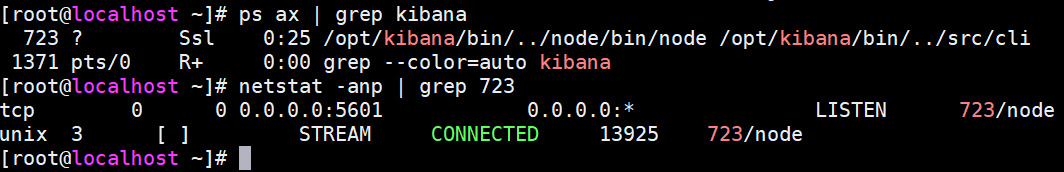
5601/TCP
Process running:
ps –ef | grep "kibana"
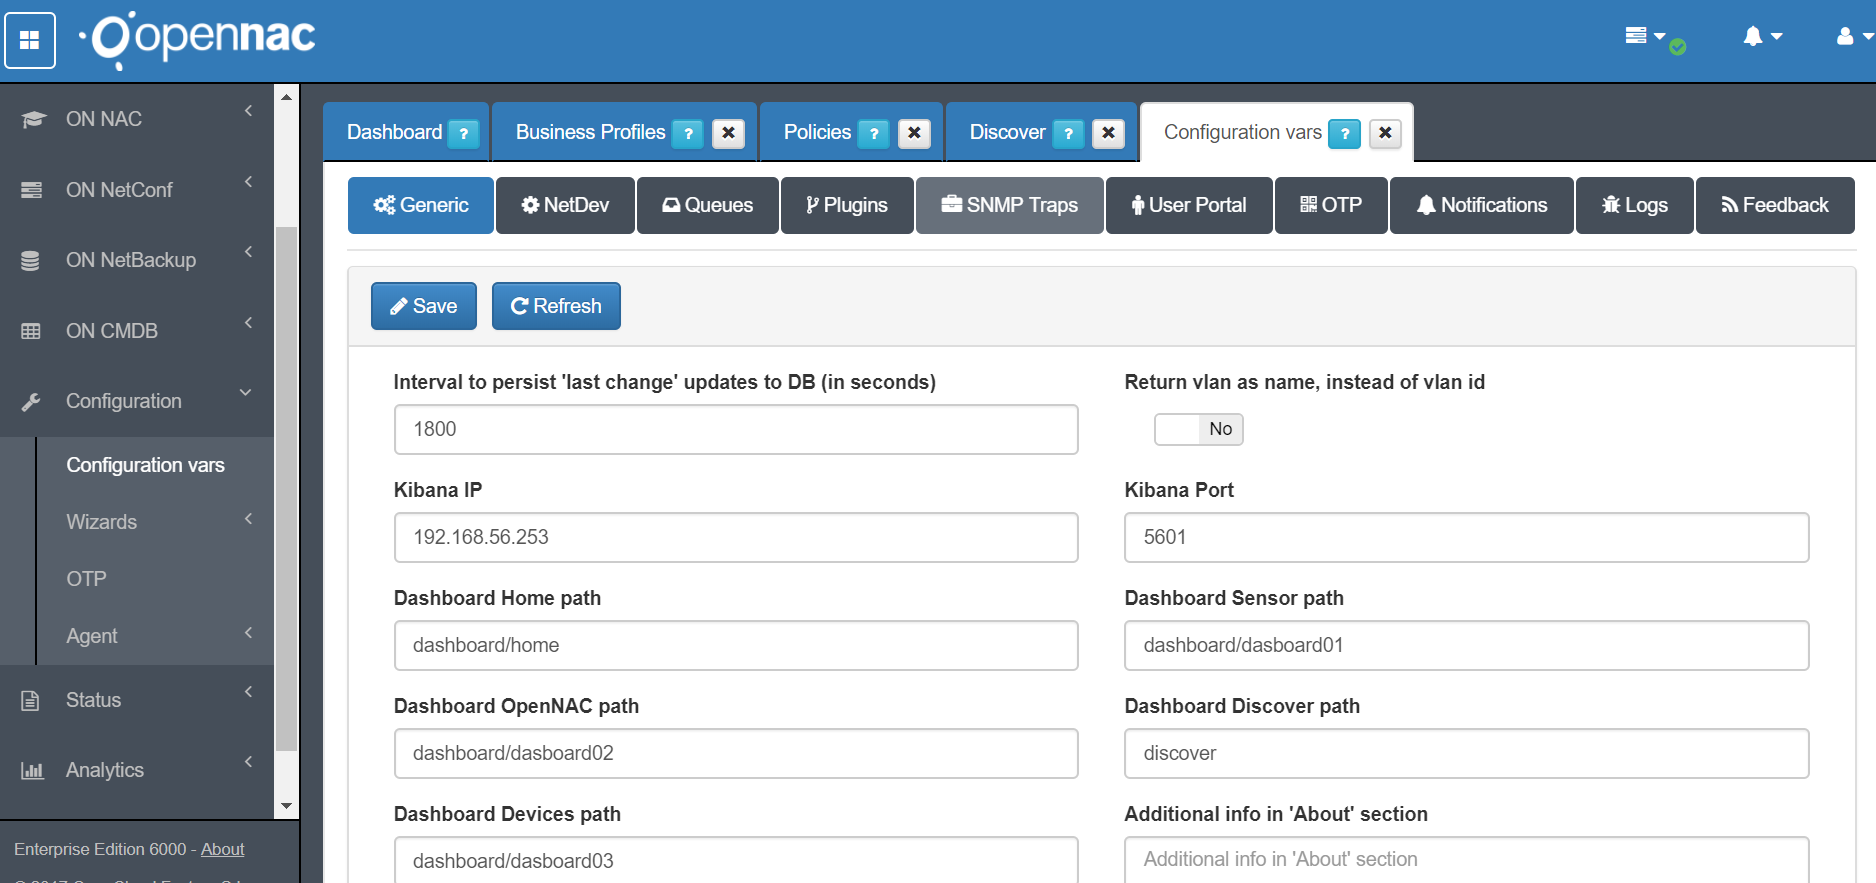
Verify the settings for kibana IP on Configuration –> Configuration vars from Core web console.
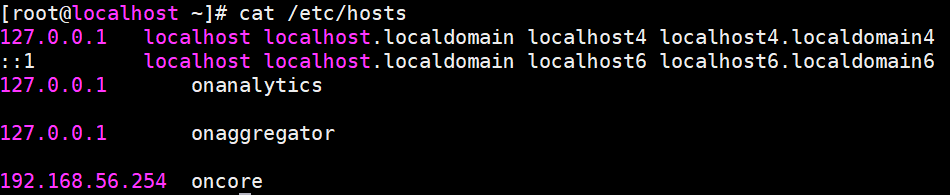
Hosts File
Make sure the hosts file on /etc has been properly configured.
The aggregator role is performed by itself (Analytics), you should configure the Core IP address and later reach by ping to introduced name.