Core
This section has the basic troubleshooting for core device.
Verify the internal resources.
Follow the trending guide for Opennac Administration Portal.
The main services on Core device:
- Opennac service
- Httpd service
- Radius service
- Mysqld service
- Dhcpd service
- Gearmand service
- Snmpd service
- Collectd service
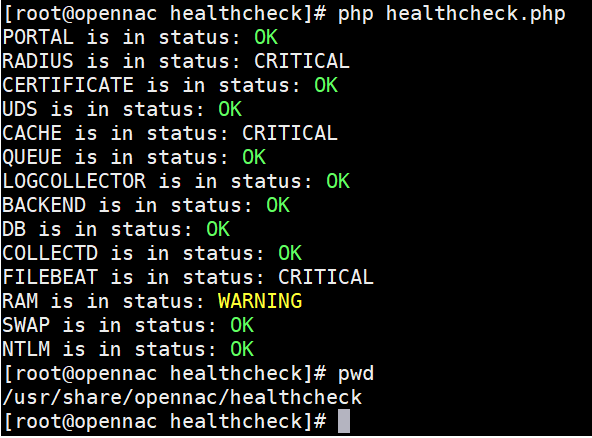
You can execute a complete review in this directory /usr/share/opennac/healthcheck using the command php healthcheck.php
cd /usr/share/opennac/healthcheck
php healthcheck.php
Opennac Service
Managing service Opennac:
service (start|stop|restart|status) opennac
Check opennac workers log:
tail -f /var/log/opennac/opennac-job.log
Process running:
ps –ef | grep "worker.php"
API
Check API logs:
tail -f /var/log/opennac/opennac-analytics.log
tail -f  /var/log/opennac/opennac-api.log
Enable debug mode in API:
vi /usr/share/opennac/api/application/configs/api.ini
resources.log.syslog.filterParams.priority = 7
Monitoring API Mobile Connect log in debug mode
tail -f /var/log/opennac/opennac-api.log | grep mobileConnectSync
Disable debug mode in API:
vi /usr/share/opennac/api/application/configs/api.ini
resources.log.syslog.filterParams.priority = 6
Relevant API configuration files:
vi /usr/share/opennac/api/application/configs/application.ini
<API configuration properties>
Http Service
Managing service HTTP:
service httpd (start|stop|restart|status)
Check HTTP logs:
tail -f /var/log/httpd/opennac-access_log
tail -f /var/log/httpd/opennac-error_log
tail -f /var/log/httpd/opennac-https-access_log
tail -f /var/log/httpd/opennac-https-error_log
Verify HTTP ports:
netstat -nap | grep http

80/TCP 443/TCP
Process running:
ps –ef | grep "http"
Radius Service
Managing service Radius:
service radiusd (start|stop|restart|status)
Check Radius log:
tail -f /var/log/radius/radius.log
Verify Radius ports:
netstat -nap | grep radius
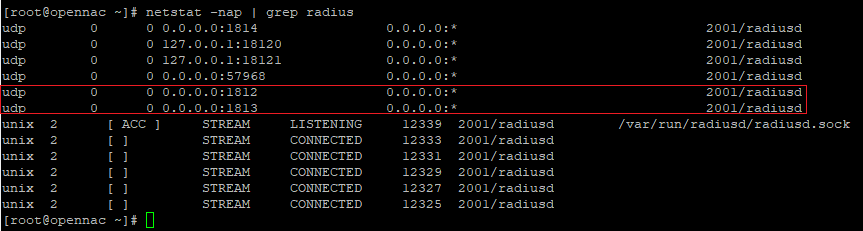
1812/UDP -> authentication 1813/UDP -> accounting
Process running:
ps –ef | grep "radius"
Activate Debug service:
First stop radiusd service.
service radiusd stop
Turn on the debug mode using:
radiusd –xX
(or raddebug, adjusting "/etc/raddb/sites-available/control-socket")
MySQL Service
Managing service MySQL:
service mysqld (start|stop|restart|status)
Check MySQL log:
tail -f /var/log/mysql/mysqld.log
Data location:
cd /var/lib/mysql/
Verify MySQL ports:
netstat -nap | grep mysql
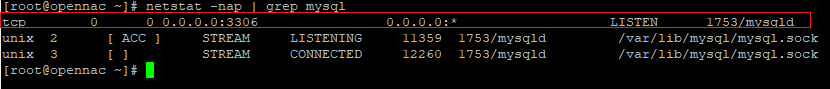
3306/TCP
Process running:
ps –ef | grep "mysql"
Console acces:
mysql -u admin -p opennac
When there is a replicating database
Replication status in master (tehrhm9c):
show master status
Replication status in slave (tehrhm9d):
show slave status \G
When replication problem in slave:
mysql -u root -p opennac
stop slave
start slave
DHCP Service
Gearmand Service
Managing service Gearman:
service gearmand (start|stop|restart|status)
Check Gearman log:
tail -f /var/log/gearmand.log
Verify Gearman ports:
Open ports in master
netstat -nap | grep gearmand
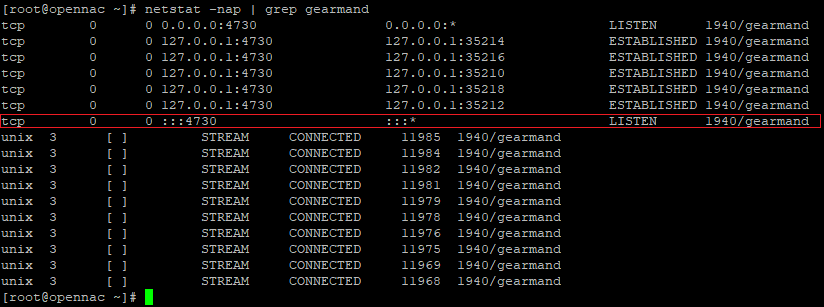
4730/TCP
Process running:
ps –ef | grep "gearmand"
SNMP Service
Collectd service
Managing service Collectd:
service collectd (start|stop|restart|status)
Check Collectd log:
tail -f /var/log/messages
Data location:
ls /var/lib/collectd/
Verify Collectd ports:
Open ports in master
netstat -nap | grep collectd
25826/UDP
Process running:
ps –ef | grep "collectd"
Redis Service
Managing service Redis:
service redis (start|stop|restart|status)
Check Redis log:
tail -f /var/log/redis/redis.log
Verify Redis ports:
netstat -nap | grep redis

6379/TCP
Process running:
ps –ef | grep "redis"
Rsyslog Service
Managing service Rsyslog:
service rsyslog (start|stop|restart|status)
Check Rsyslog logs:
tail -f /var/log/messages
or /var/log/opennac/…
Verify Rsyslog send data to Analytics:
5000/TCP
Process running:
ps –ef | grep "rsyslog"
Conntrack table full
Problem detection
In order to check if there is a problem with the conntrack component, check if the system is able to establish new connections.
If the conntrack table is full you shoud see something like this:
grep kern /var/log/messages

Sep  6 13:40:30 oncore02trunk kernel: nf_conntrack: table full, dropping packet.
Sep  6 13:40:30 oncore02trunk kernel: nf_conntrack: table full, dropping packet.
Sep  6 13:40:30 oncore02trunk kernel: nf_conntrack: table full, dropping packet.
Sep  6 13:40:30 oncore02trunk kernel: nf_conntrack: table full, dropping packet.
Sep  6 13:40:31 oncore02trunk kernel: nf_conntrack: table full, dropping packet.
Sep  6 13:40:31 oncore02trunk kernel: nf_conntrack: table full, dropping packet.
Sep  6 13:40:31 oncore02trunk kernel: nf_conntrack: table full, dropping packet.
Sep  6 13:40:31 oncore02trunk kernel: nf_conntrack: table full, dropping packet.
Sep  6 13:40:32 oncore02trunk kernel: nf_conntrack: table full, dropping packet.
Check status
Conntrack info displayed is related with current connections:
cat /proc/sys/net/netfilter/nf_conntrack_count
where max connections is:
cat /proc/sys/net/nf_conntrack_max
If needed increase the maximum value
The variable NF_CONNTRACK_MAX defines how many sessions the system can establish. So increasing the problem would be solved.
NF_CONNTRACK_MAX=262144
grep -q "net.nf_conntrack_max" /etc/sysctl.conf && sed -i "s/^net.nf_conntrack_max[ \t]*=.*/net.nf_conntrack_max = ${NF_CONNTRACK_MAX}/" /etc/sysctl.conf || echo -e "\n# Increase conntrack max value\nnet.nf_conntrack_max = ${NF_CONNTRACK_MAX}" >> /etc/sysctl.conf
sysctl -p