openNAC Trending
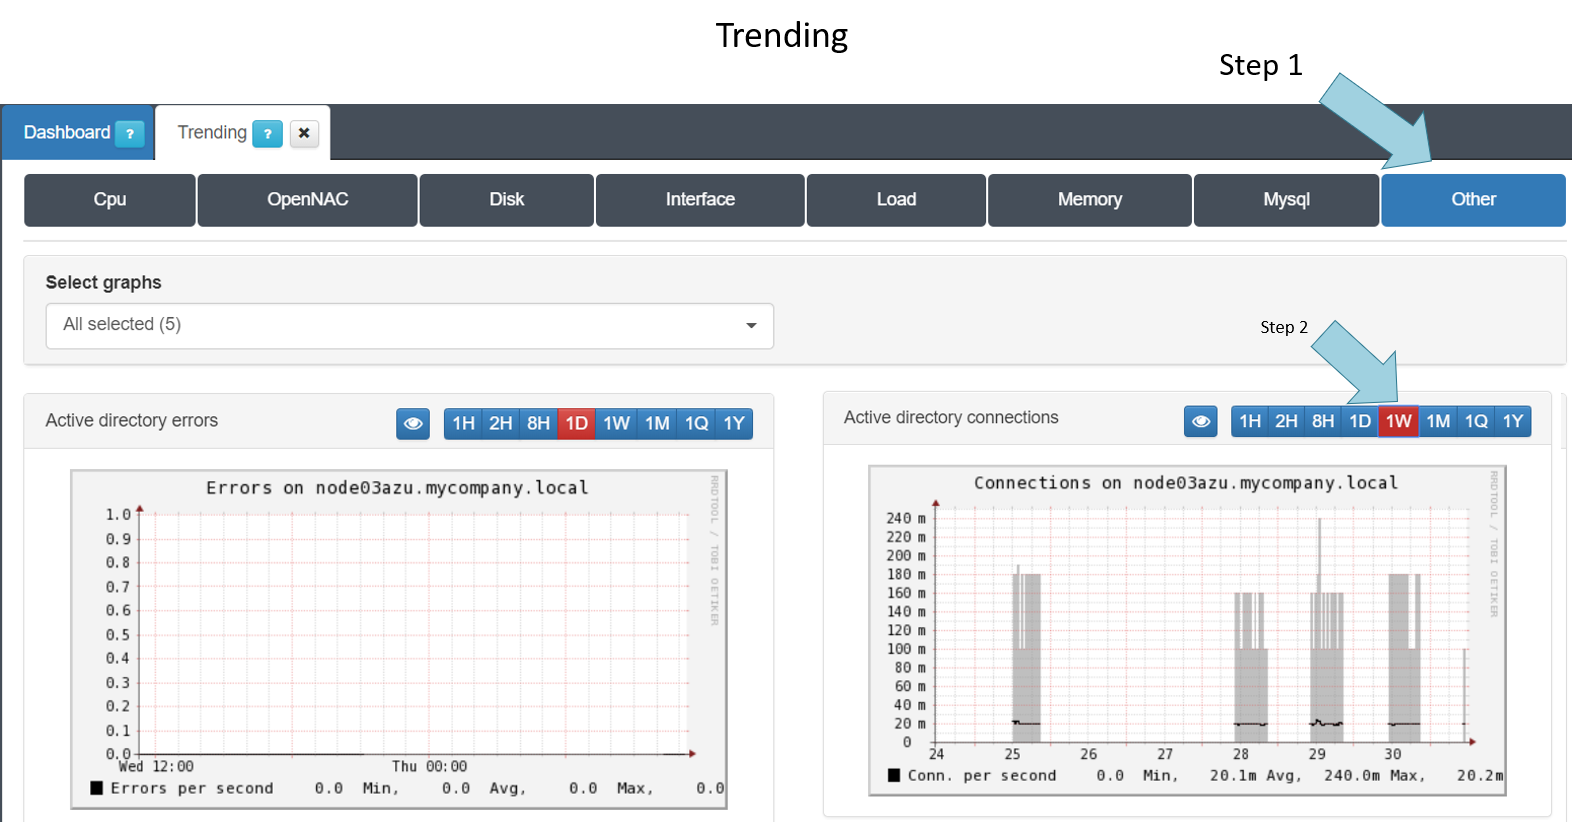
To check openNAC performance and its trend you have to go to Status -> Trending, as shown at the step 1 and step 2.
In case we have a distributed deployment with many different nodes, per node trending, performance and graphs are also available.
All the information is stored in DDR Files, this increase graphs calculation and system response.
Time Ranges are available, allowing use to select:
1H: 1 hour time range.
2H: 2 hours time range.
8H: 8 hours time range.
1W: 1 week time range.
1M: 1 moth time range.
1Q: 1 Quarter time range.
1Y: 1 Year time range.
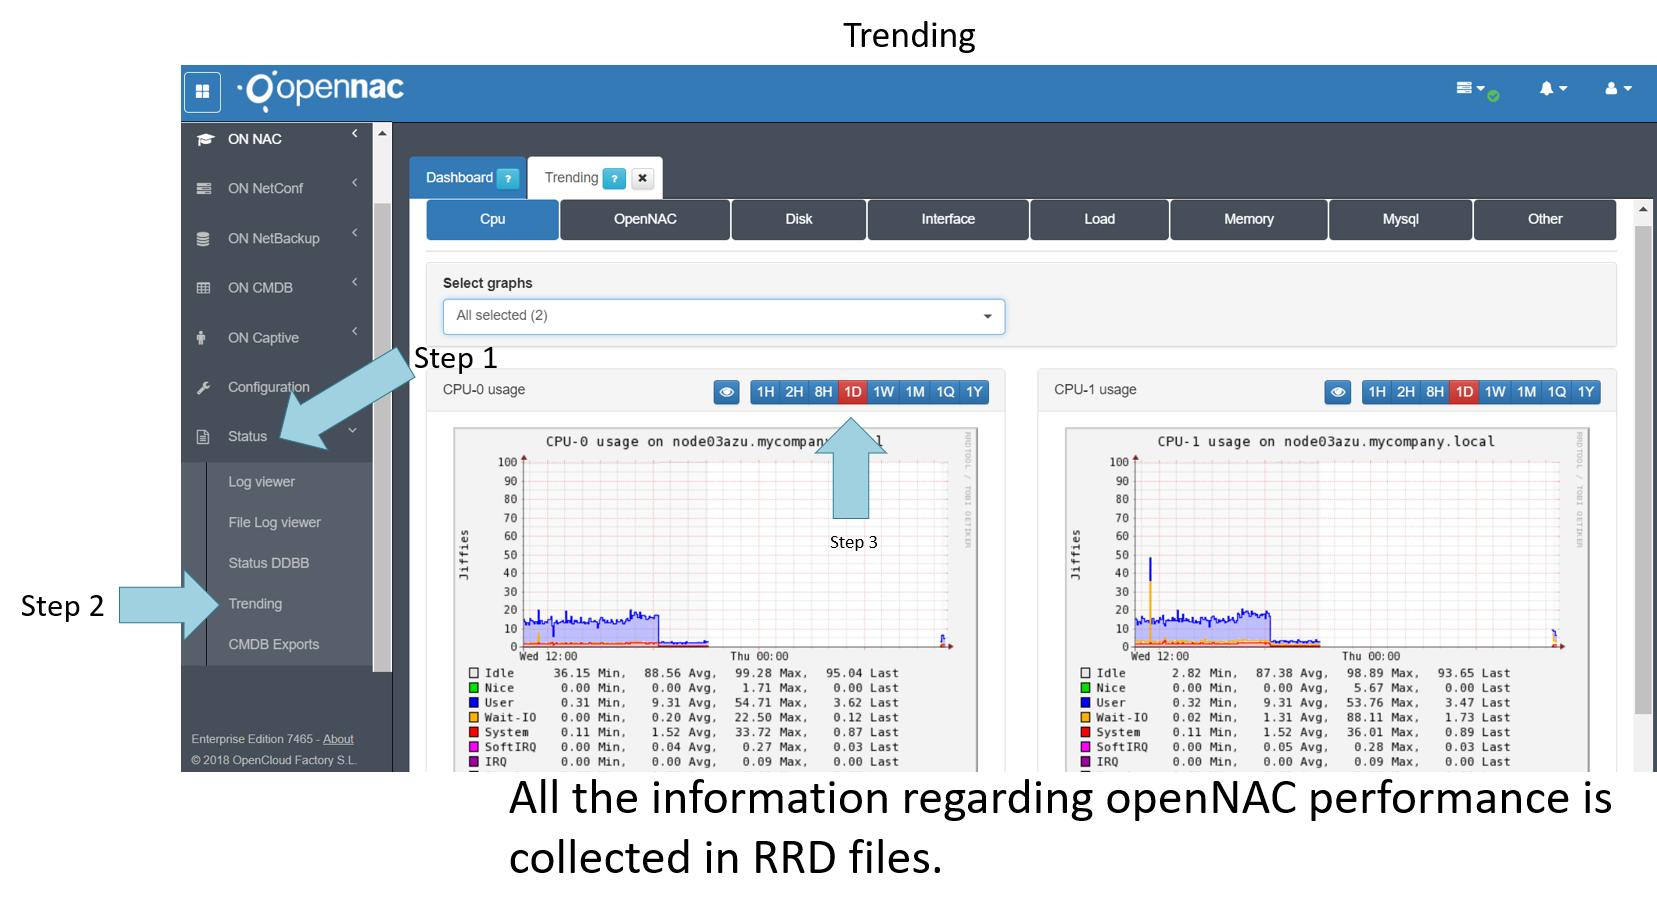
Different section graphs are available, plenty of information is shown in every picture.
CPU: Graphs regarding CPU usage.
openNAC: Graphs regarding openNAC services.
Disk: Graphs regarding openNAC disks.
Interface: Graphs regarding interfaces.
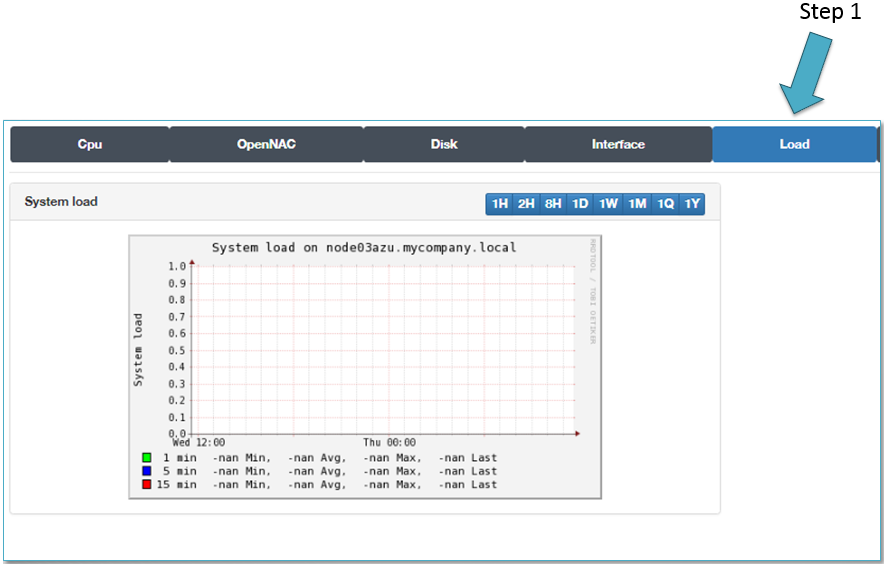
Load: Graphs regarding system components load.
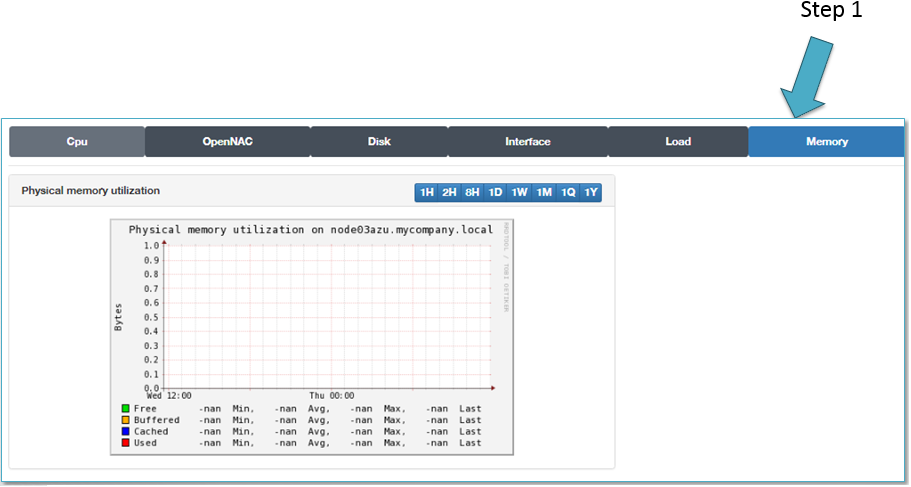
Memory: Graphs regarding memory use.
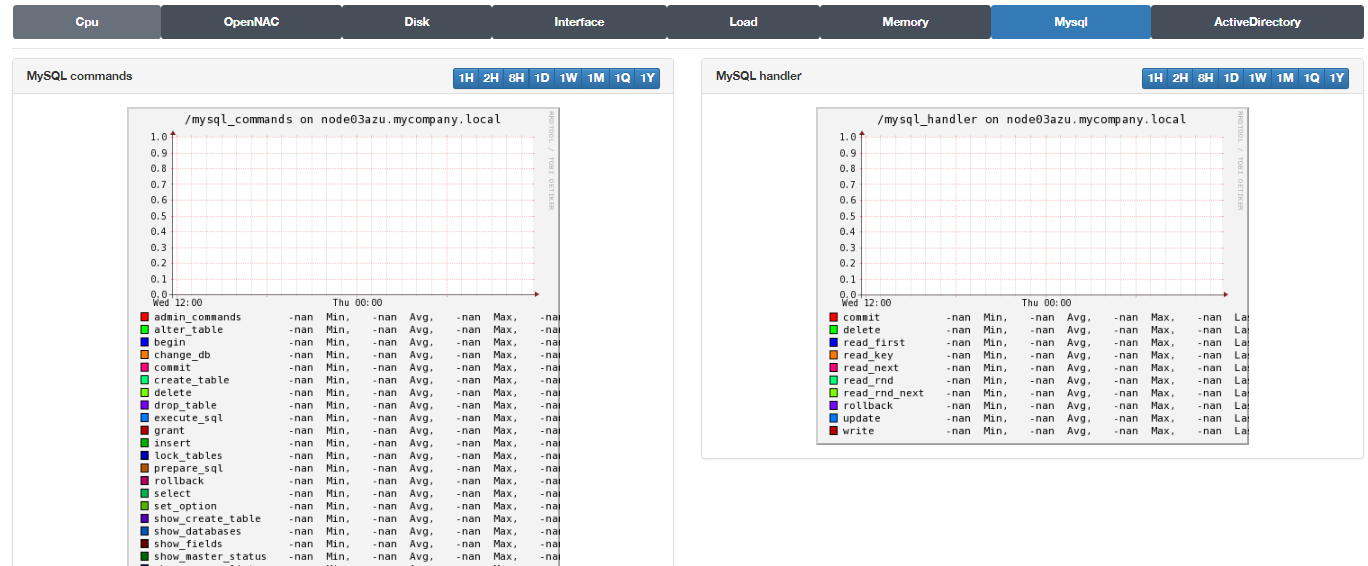
MySQL: Graphs regarding database component.
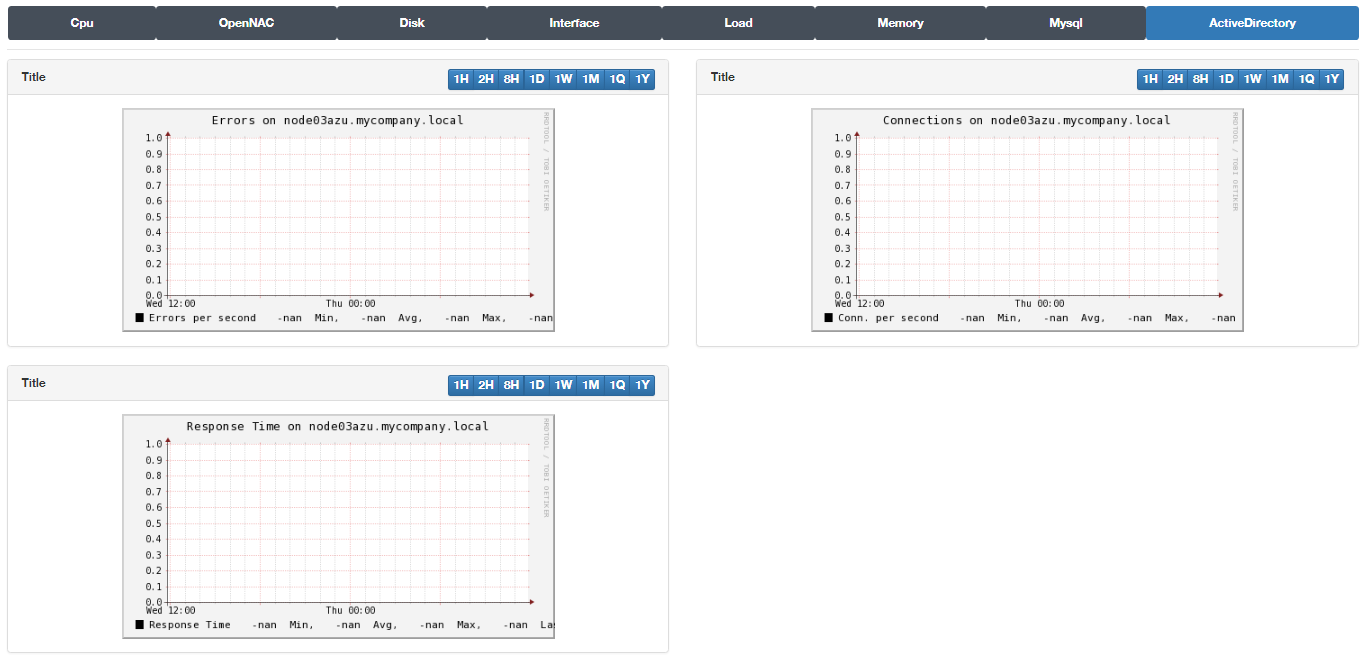
Active Directory: Graphs regarding Active Directory sub-component.
Redis: Graphs regarding Redis component.
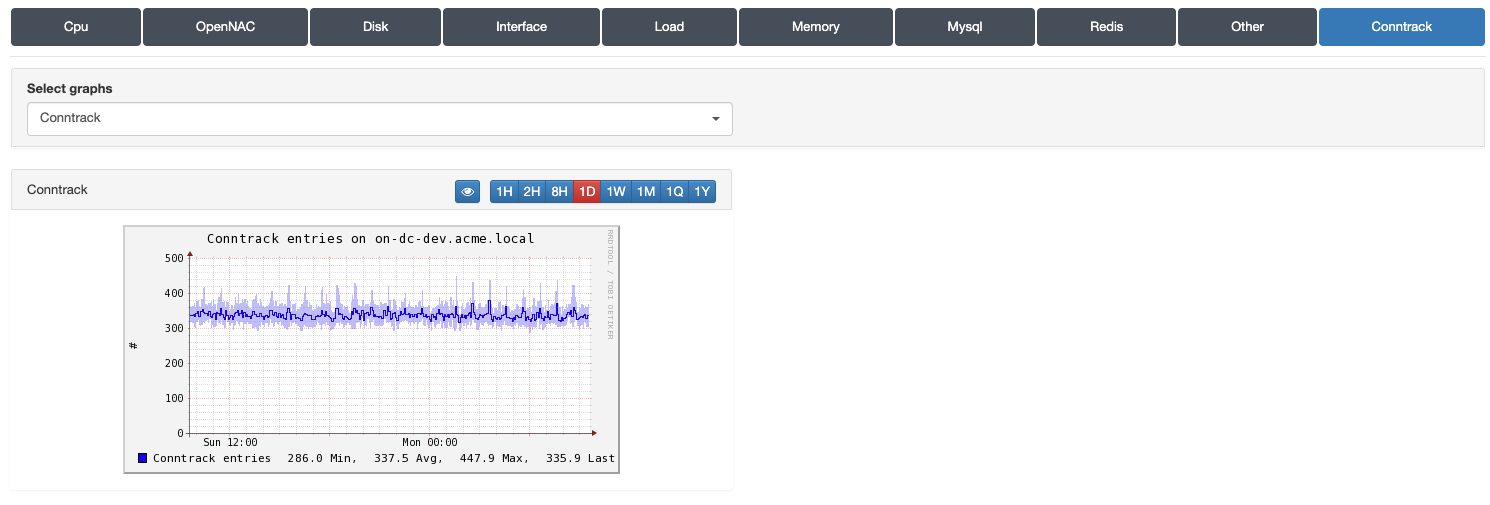
Conntrack: Graphs regarding Conntrack component.
If we go to the step 1 is shown trending about Active Directory, at step 2 a 1M (1 month time range) is selected. For instance is shown Connection per second against the active directory.
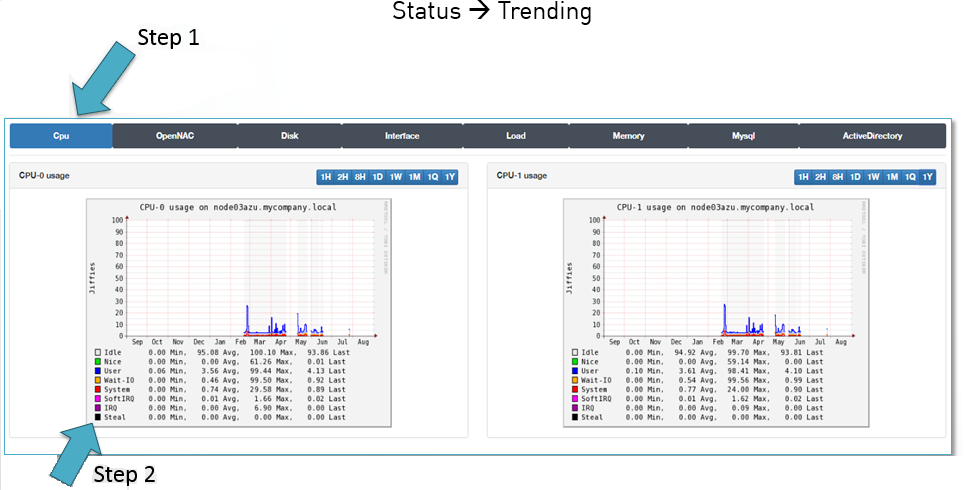
Trending CPU
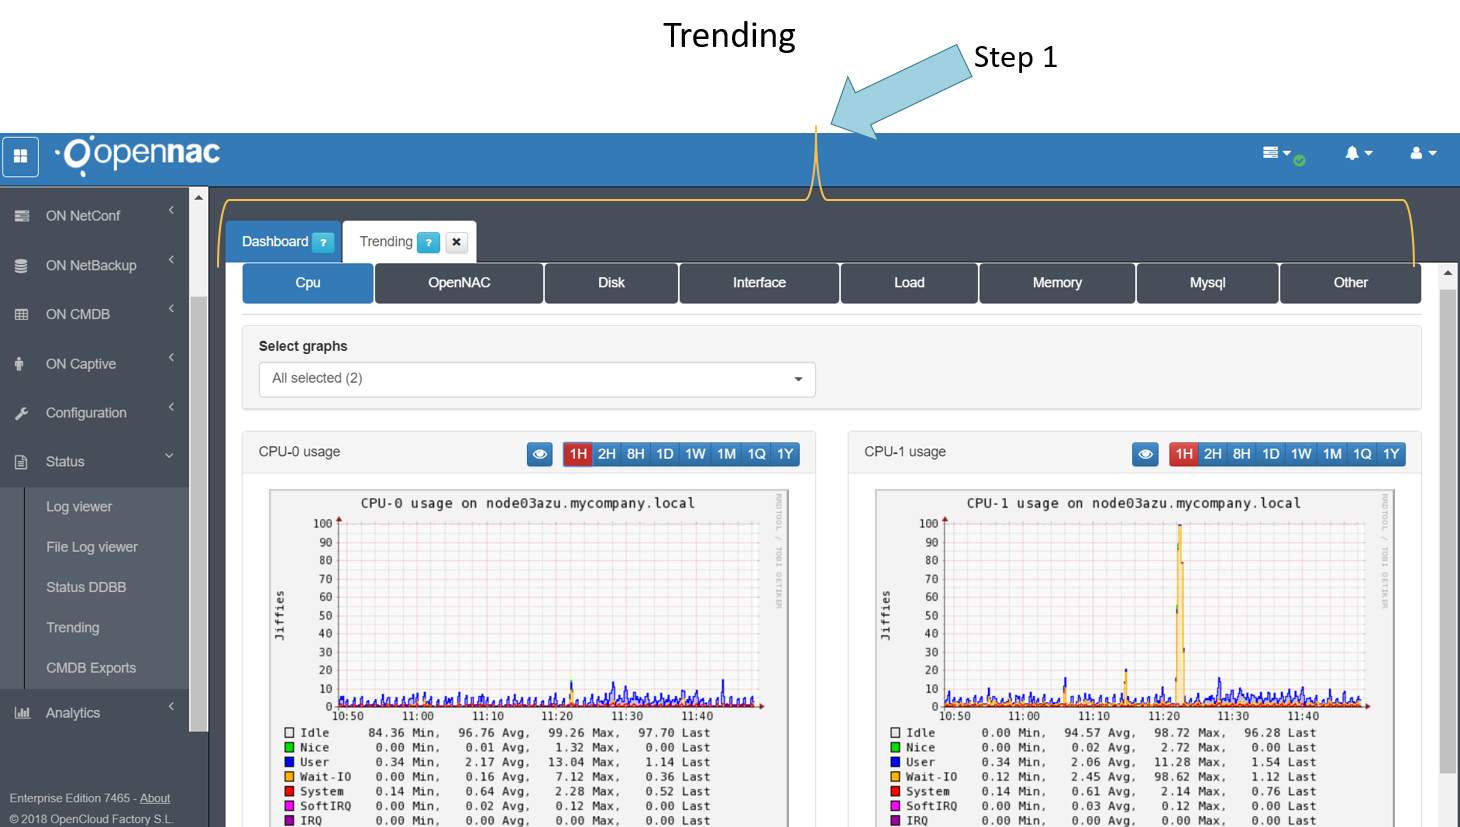
In order to review CPU trend information go to the step 1.
CPU information about, user, idle, system, IRQs and others are available.
Trending openNAC
In order to review openNAC trend information go to the step 1.
In this section is possible to review information for openNAC engine:
Cache memory used.
Policy hits, policy execution time.
Workers queues.
SNMP MAC change.
SNMP MAC change workers.

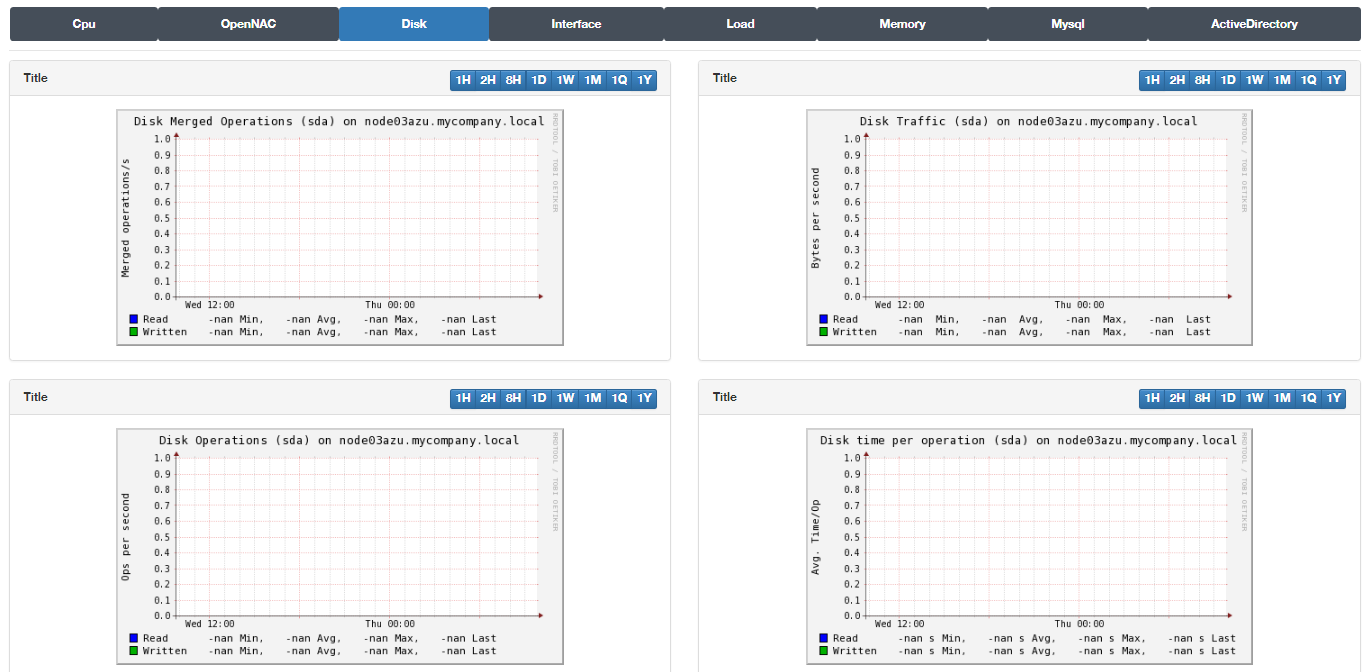
Trending Disk
In order to review Disk trend information go to the step 1.
In this section is possible to review information for all disks operation installed on the servers.
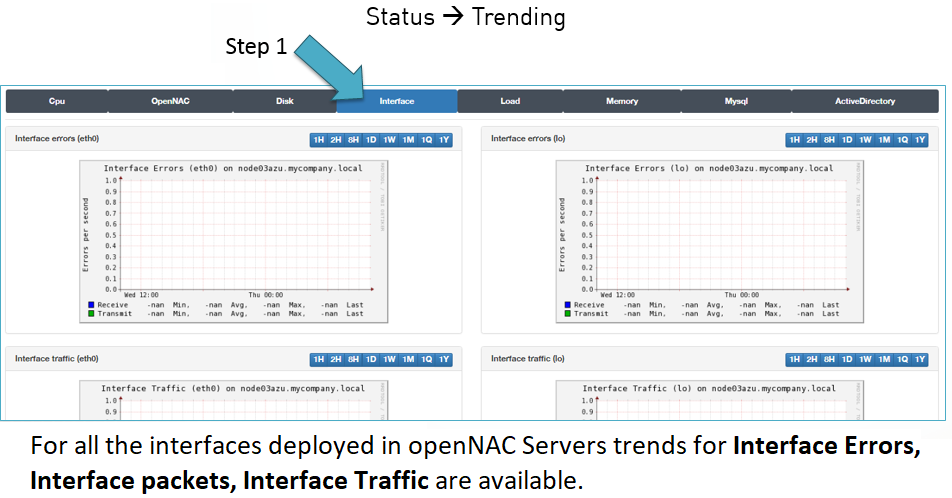
Trending Interface
In order to review interfaces information trend go to the step 1.
In this section is possible to review information for all the interfaces installed on openNAC Servers.
- Interface Errors.
- Interface packets.
- Interface Traffic.
Trending MySQL
In order to review MySQL trends go to the step 1.
- MySQL Commands
- MYSQL Hadler
- MySQL Locks
- Traffic Offset
Trending Active Directory
In order to review Active Directory trends go to the step 1.
- Errors with Active Directory
- Response Time
- Connections per time
Trending Redis
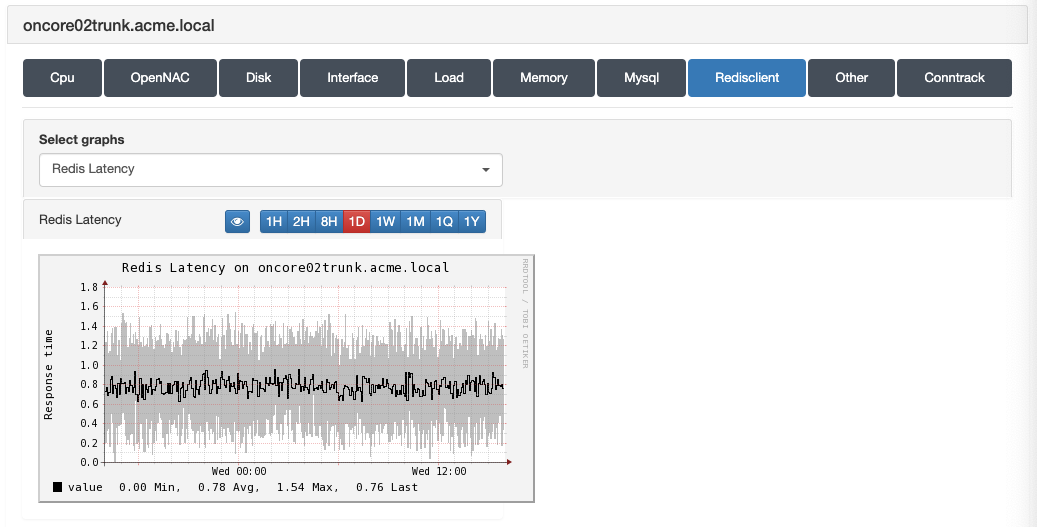
In order to review Redis trends go to the step 1.
- Redis commands
- Redis Server connections
- Redis DB items
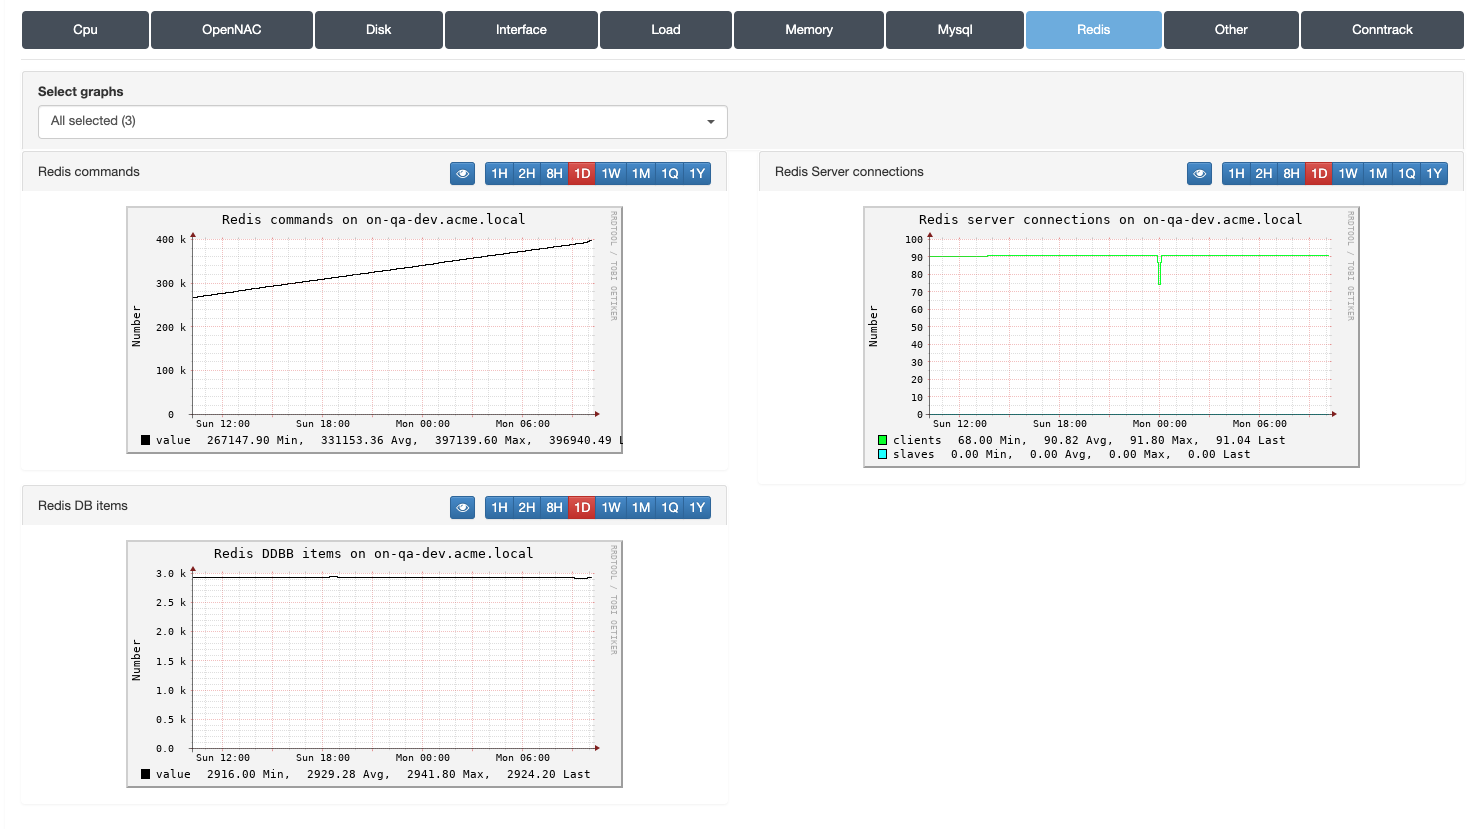
- Redis Latency