File Log Viewer
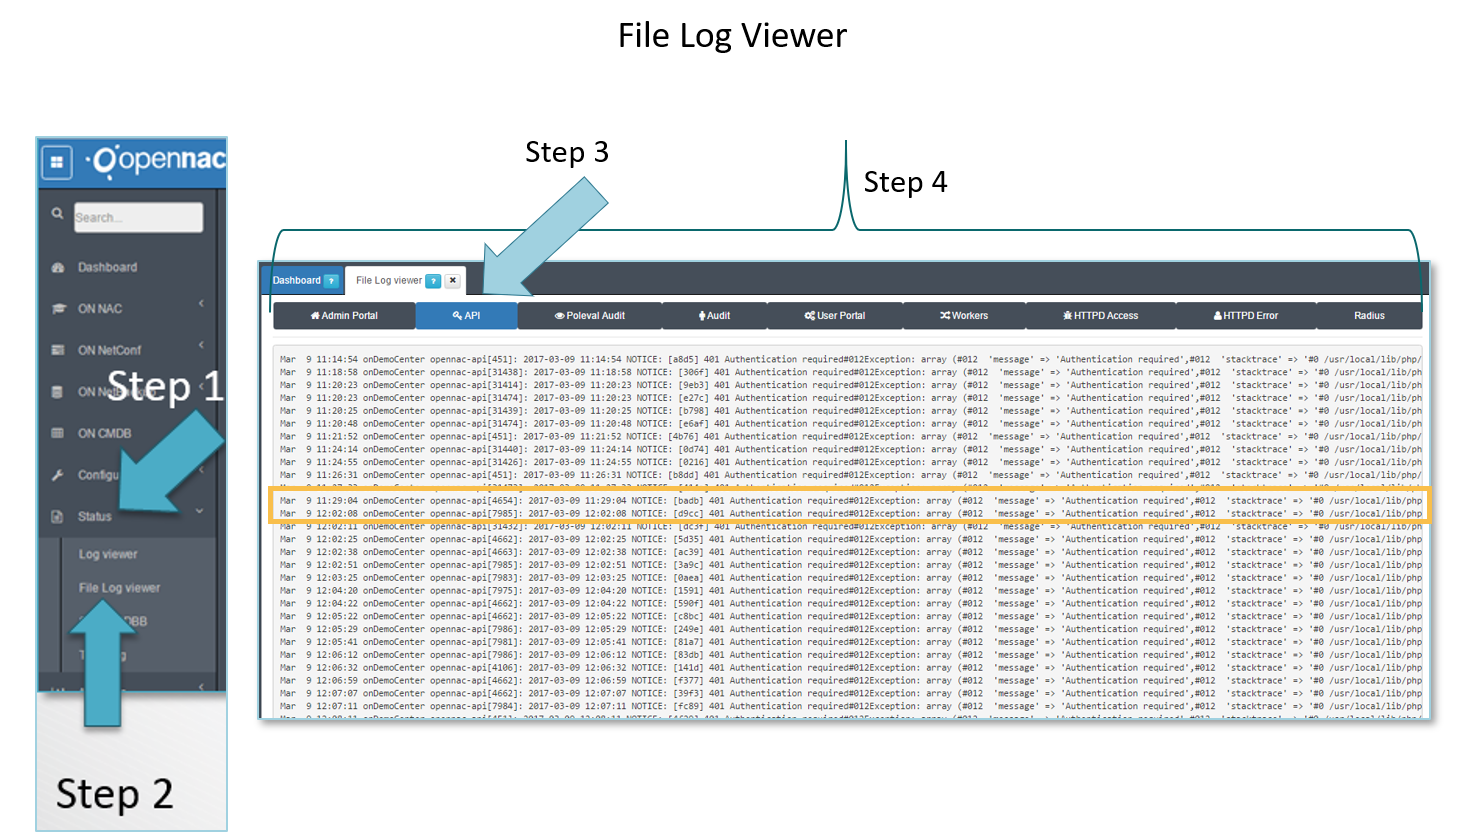
From openNAC Web Administration portal and following the step 1 and step2 we have a log viewer to view the major components events.
We are able to see events as shown by the step 4:
- Administration portal: Events related with the administration portal.
- API: Product API Rest events as shown in the step 3, it’s a very interesting tool for troubleshooting.
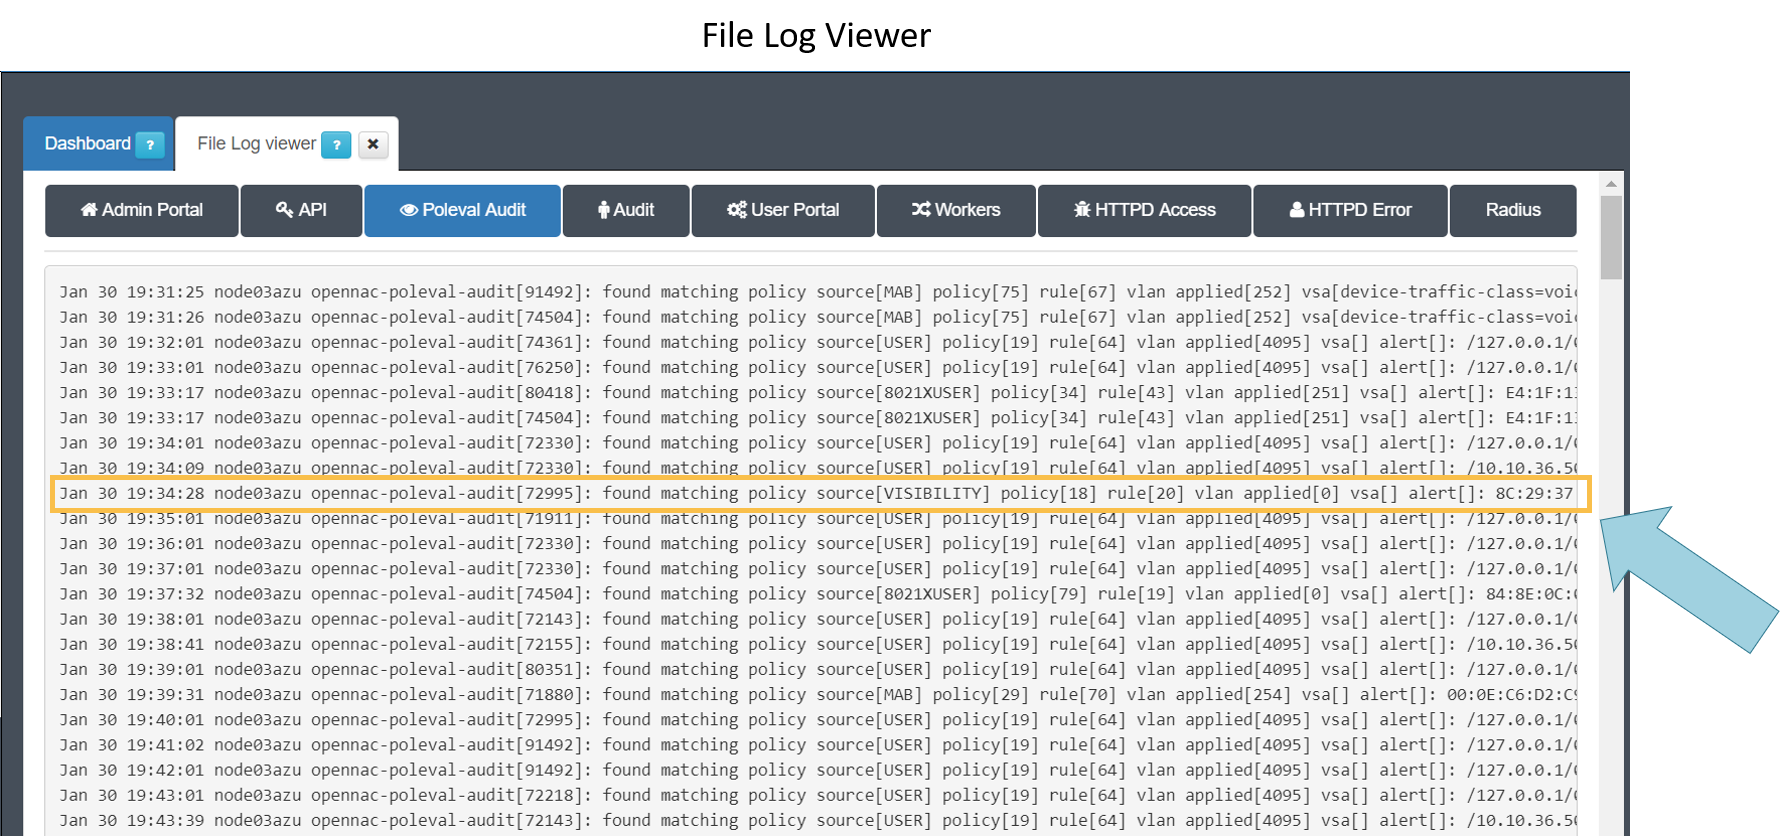
- Poleval Audit: Events generated by the Policy Engine.
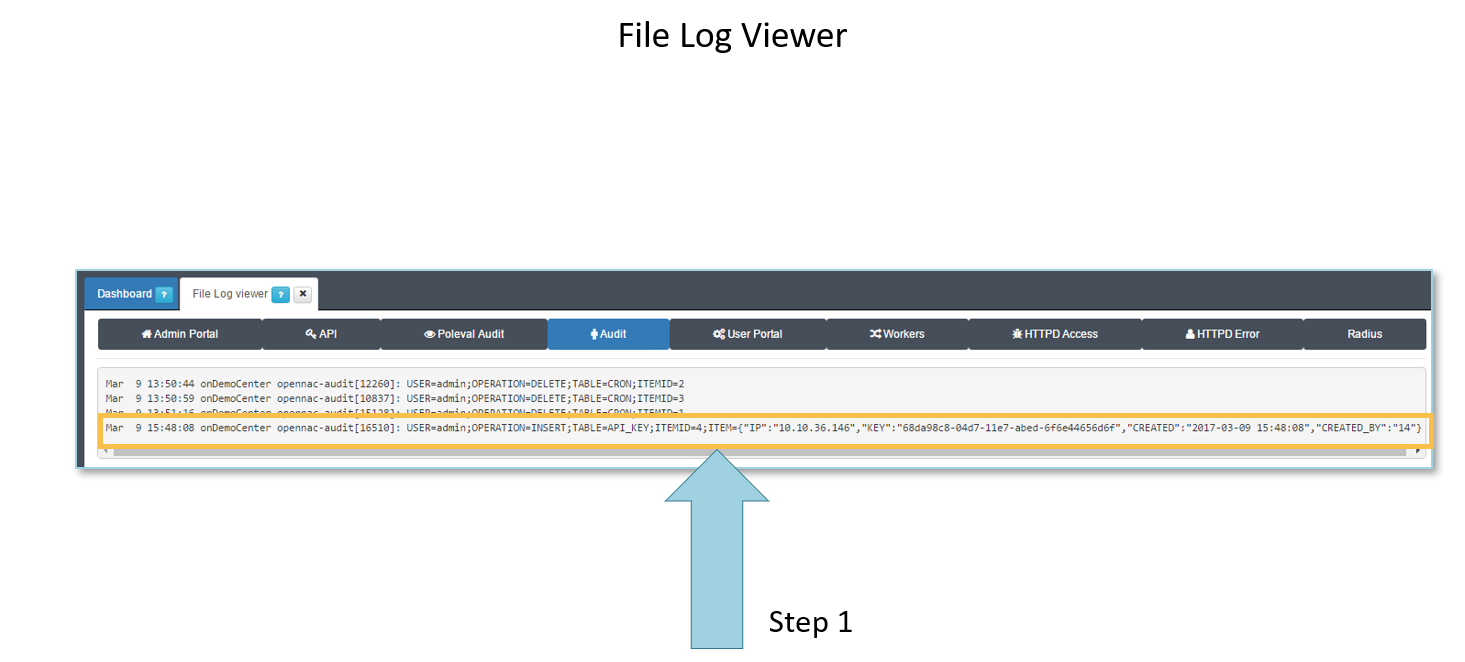
- Audit: Events generated by users in openNAC
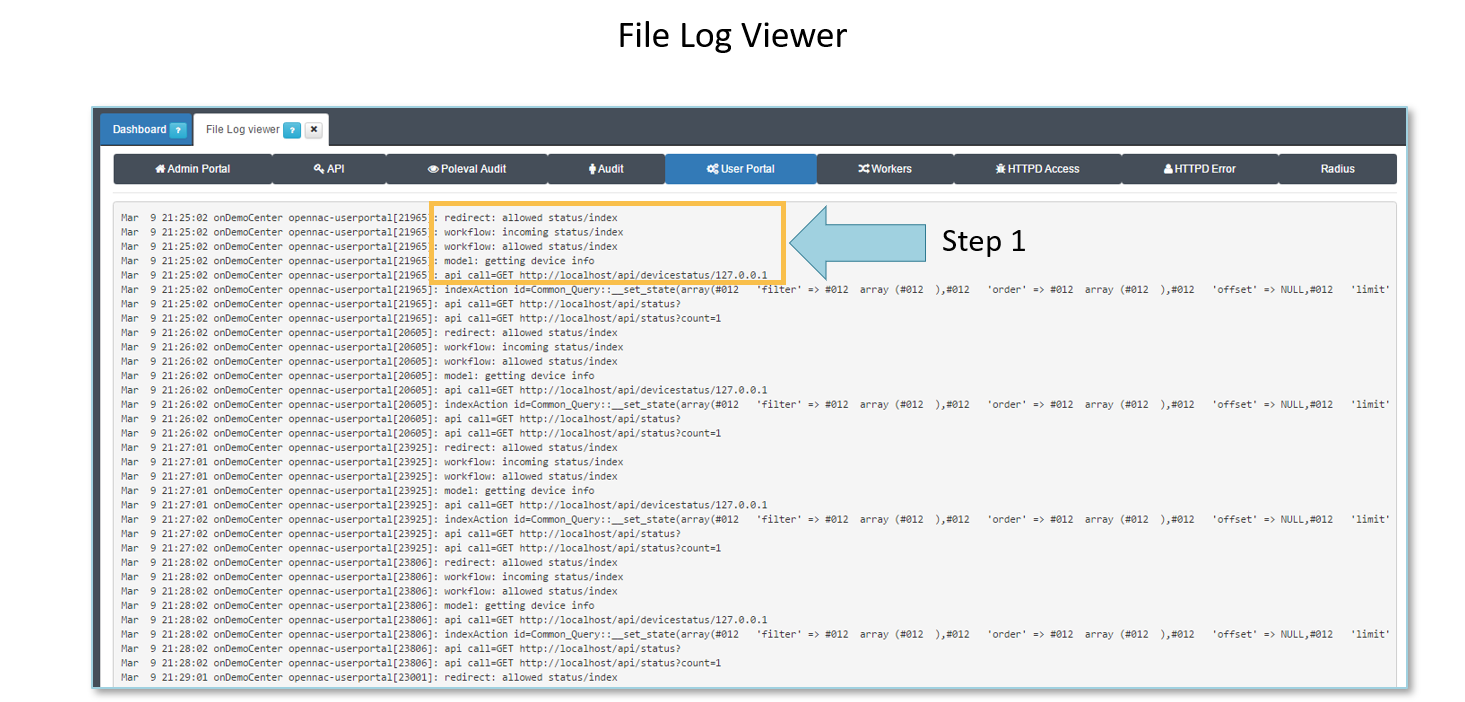
- User Portal: Event generate by user portal, this portal is shown to the end users (captive portal).
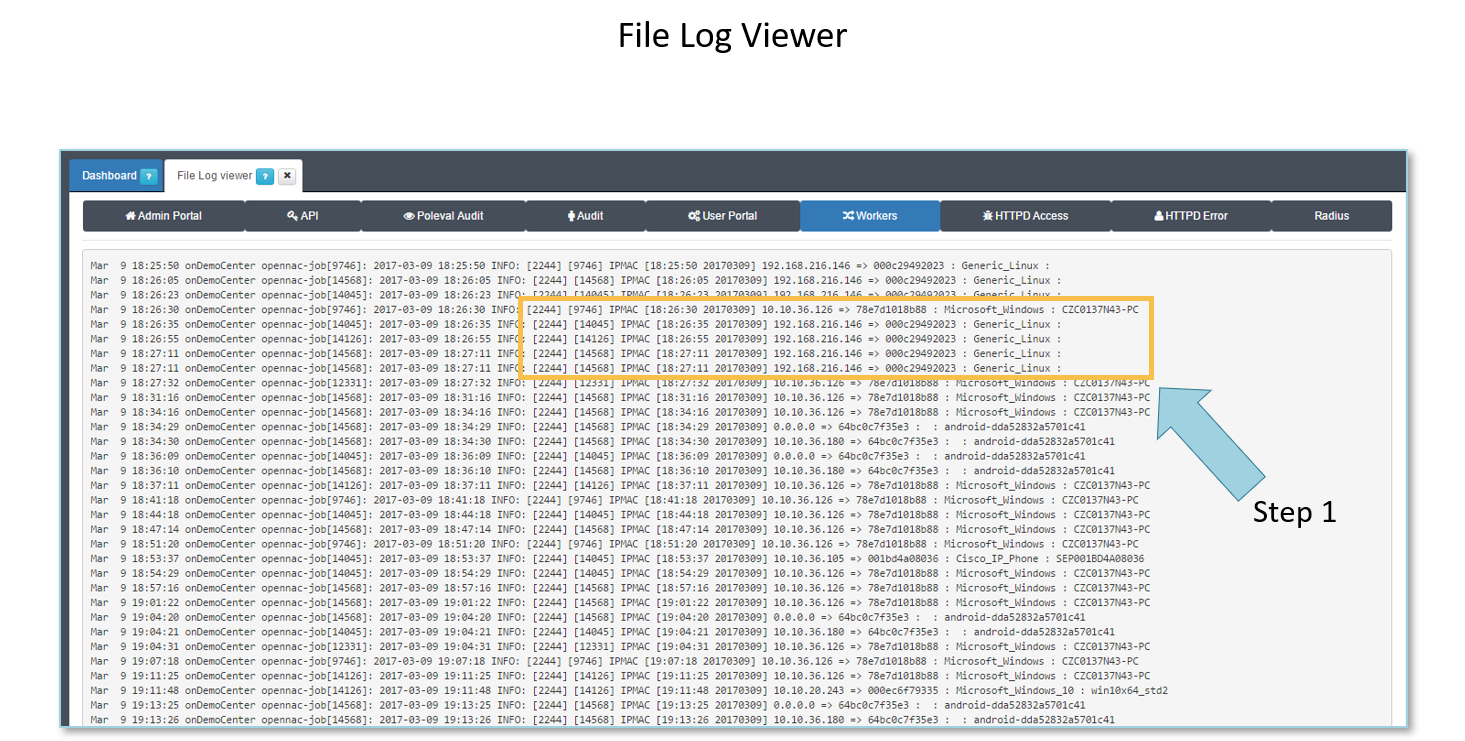
- Workers: Asynchronous tasks are sent to a queues, these queues are used by workers to carry out tasks.
- HTTPD Access: openNAC includes a Web Server that publish different components (API, Captive Portal, Administration portal..), these events shows access to the http server.
- HTTPD Error. These events shows the error generated by the http server.
- Radius. These events are related with Radius.
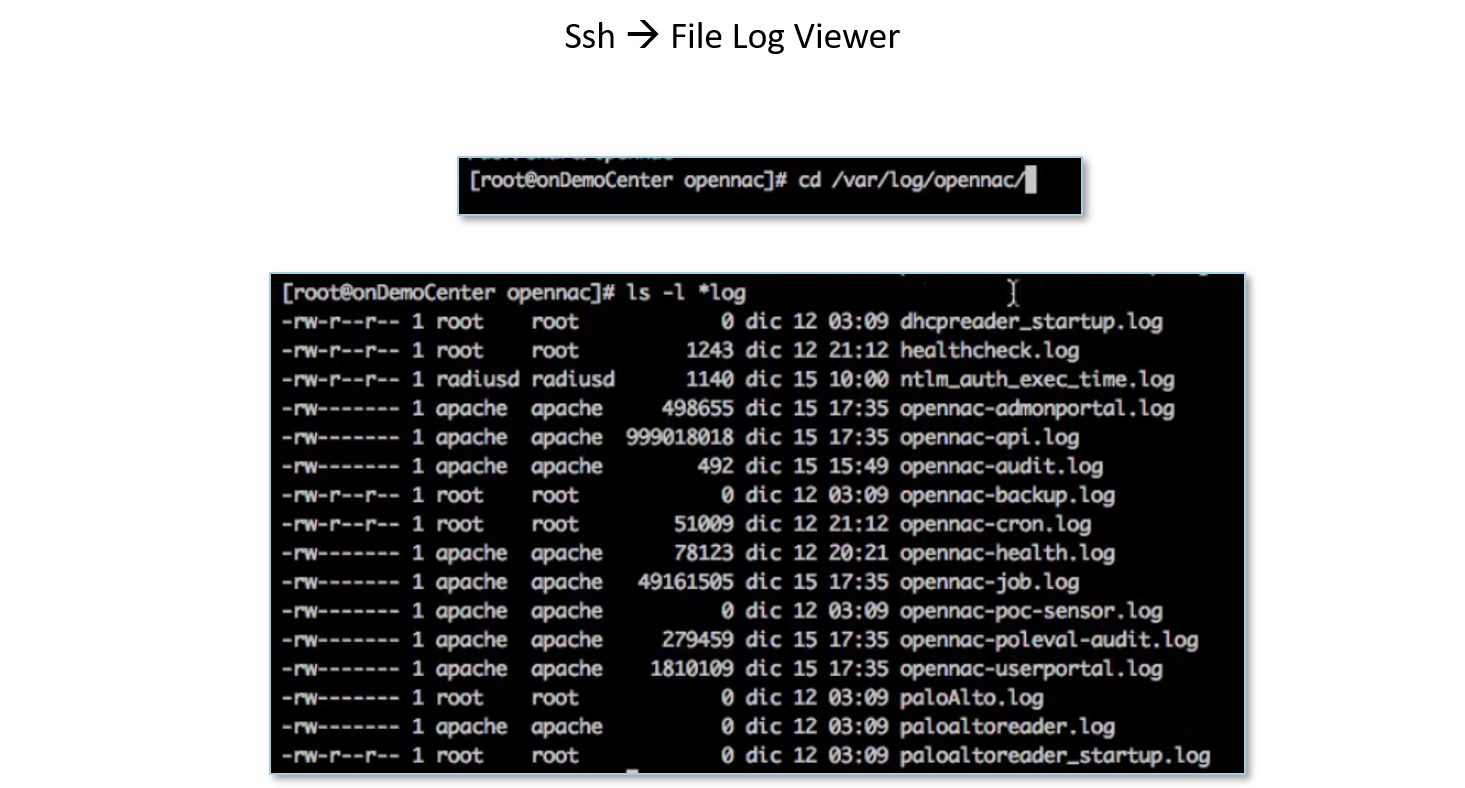
In the same way that logs can be searchable using a Web Administration portal, is possible to do it using SSH.
Events with openNAC policy engine, in this events we see the network access policy events, details such as MAC Address, User IDs, VLAN Assignment, Policy name and many others. related
- To troubleshooting a poleval issues. Poleval is an iteration of running the openNAC policy, that means when an asset is connected to network it pass through every rule of openNAC policy that iteration of the rules calls poleval.
Events related with openNAC Administration portal activities. The example shown at the Step 1 is an event that is generated when an API Key is created through the interface.
- To troubleshooting an audit issues.
Events related with User Portal Activities, Captive Portal, Registry Portal, at the step 1 shows the customizable captive portal workflows events.
- To troubleshooting for user portal issues.
Events related with Workers Activities, workers carry out asynchronous tasks published in the openNAC queues. Step 1 shows events related with profiling capabilities.
- To troubleshooting for workers issues, for instance issues with plugins..
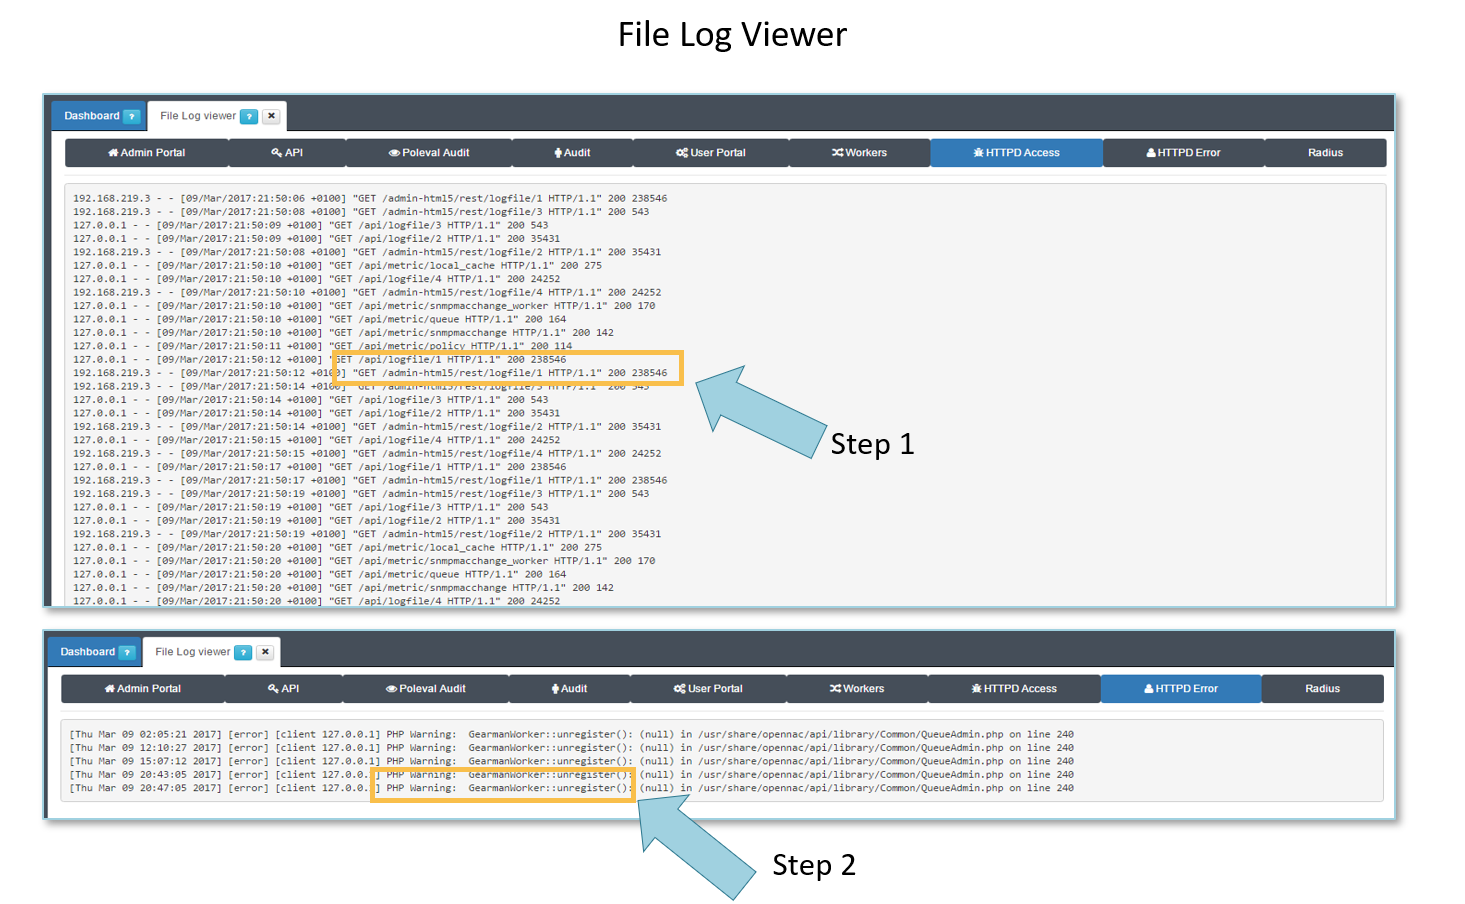
Events related with HTTPD Access and Errors.
- Step 1 shows HTTP Access events related with log search.
- Step 2 shows HTTPD Errors events regarding a workers and its queues.
-To troubleshooting for workers issues, for instance issues with plugins..
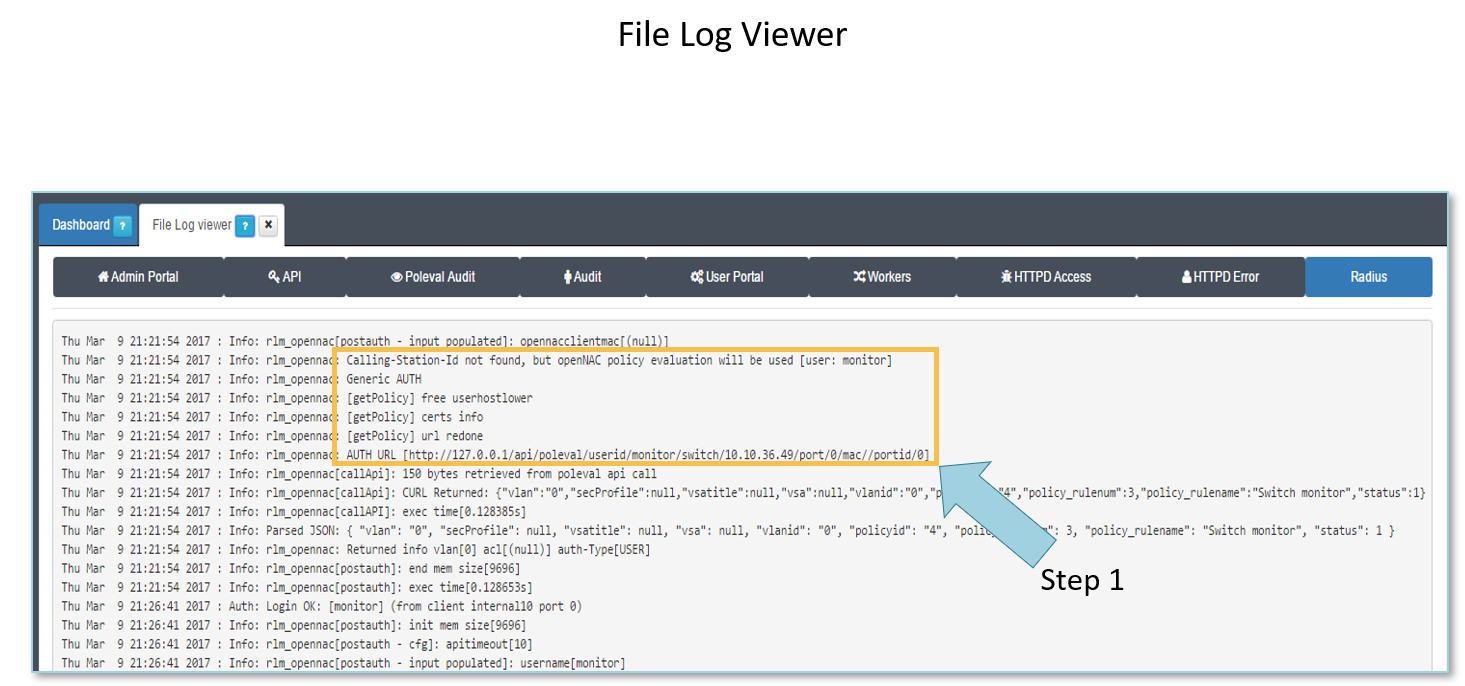
Events related with Radius processing.
Step 1 shows Radius events related with an authentication from a user called monitor.