3.1.3.1.1. Business Profiles Overview
Business Profiles allow grouping policies, Tags, EPTs following different criteria, these can be technical or business requirements:
Business Profiles based on technical requirements
For instance:
The type of authentication that is being used (MAC Authentication Bypass - MAB, 802.1x with username and password, 802.1x with user certificate).
Location based (building 1, floor 1, etc.),
User device characteristics (corporate device with Windows 10 installed),
Type of users (VPNs, Guest, Partners),
Type of network access (VPN, Wired or Wifi)
Business Profiles based on business requirements
For instance:
Identifying the business department (marketing department, finance department, etc.)
Users that belong to any business service -we can use tags in the CMDB, workstation attributes, or also LDAP/AD attributes for this matter)
3.1.3.1.1.1. Operational Capabilities
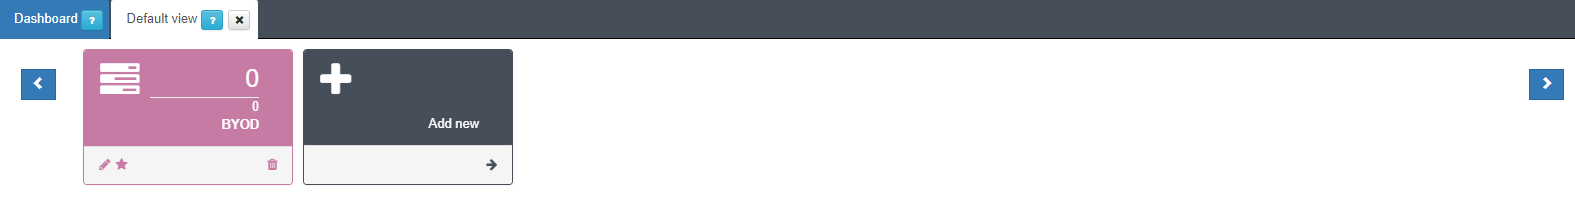
To create a new business profile, click on the Add new option that is located at the right end of the business profiles row.
A new window will pop-up and you have to complete a few steps to finish creating a new Business Profile:
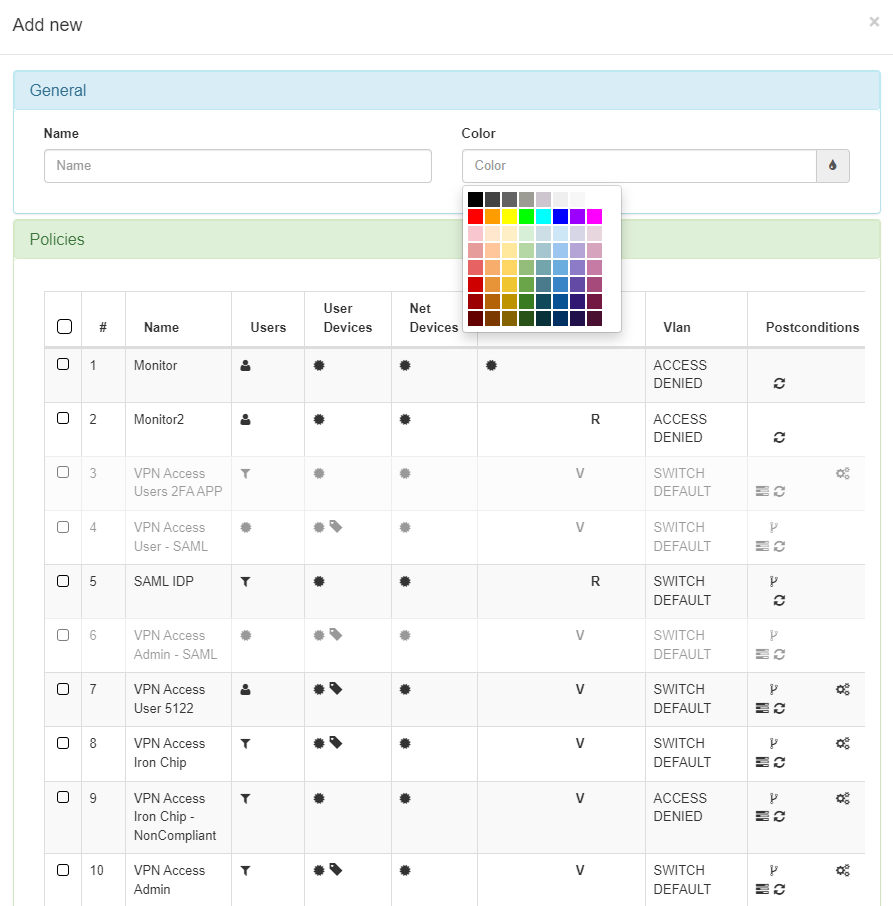
1: Write a name for the business profile.
2: Choose a color to identify it easily.
3: Choose the policy, TAG or EPT (depending on the Business Profile Type) to associate with the business profiles just created. Remember that this business profile can be created based on business or technical reasons.
Business profiles group network access request events based on policy matches, also known as Access Control entries. You can create as many business profiles as needed to organize OpenNAC events generated by policy matching.
Note
It is strongly advised to associate only one business profile with a policy. This practice helps prevent the display of inaccurate information in ON Analytics.
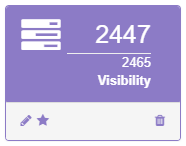
You can set a business profile as default by clicking on the “star”. To remove a business profile, click on the “bin” icon.
There are a couple of options to visualize Business Profiles.
When clicking on View graph it displays a graphical representation of the connections.
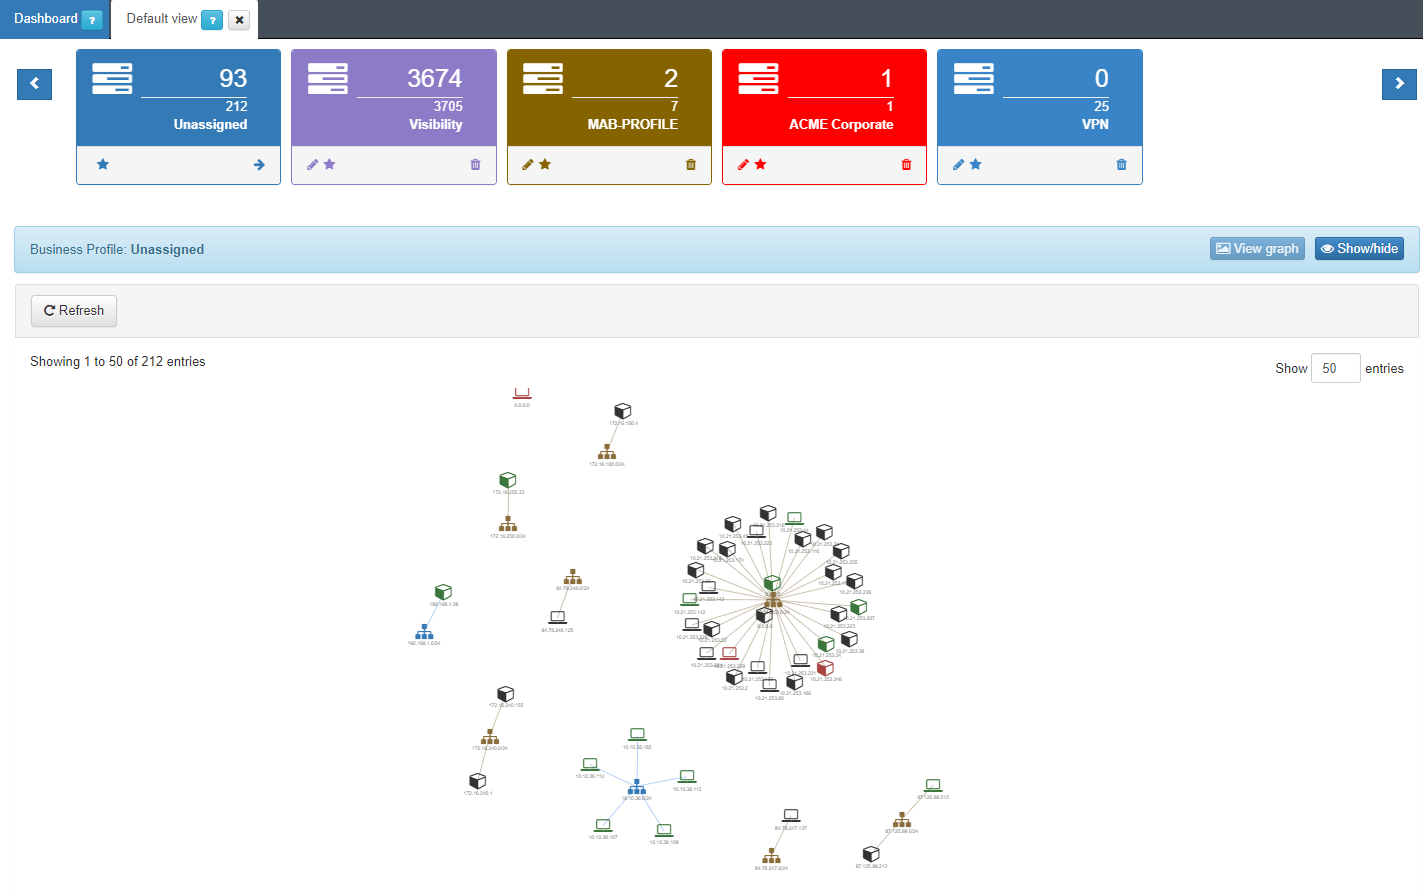
The Show/hide button toggles the business profiles row.
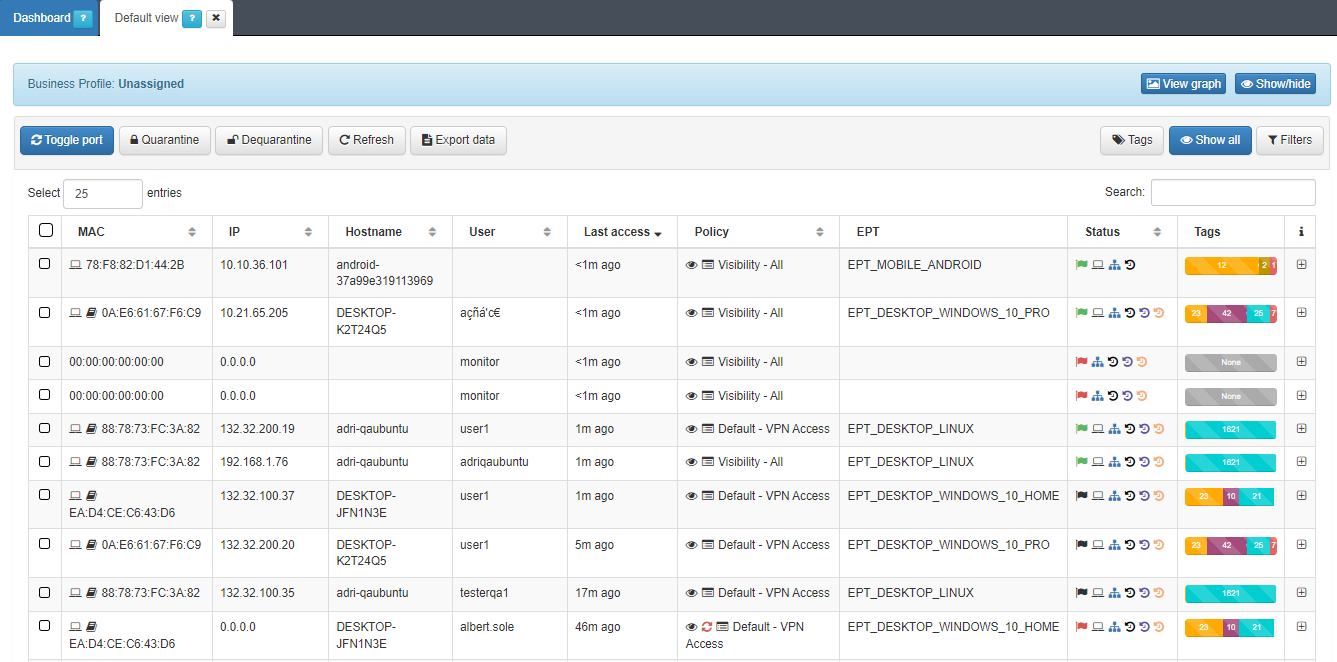
Right below your business profiles, you can find a row with multiple options (some groups might not have all the options):

Toggle port: To force a user device’s policy evaluation. First, select the device/devices by checking the corresponding box on the left and then click on the Toggle port button.
The Network Device must be previously configured to allow the reevaluation. You can do it by SNMP disconnecting and connecting the device or by CoA forcing a change of authorization. See Configuration -> Configuration Vars -> NetDev.
Quarantine: To quarantine any selected user device. The device will be sent to an isolated network, usually for security or compliance reasons. The isolated network does not exist by default, it needs to be defined on the ND.
Dequarantine: To dequarantine any selected and quarantined user device.
Note
When a Quarantine or Dequarantine is executed, a toggle is done and the policy is revaluated.
Refresh: Refreshes the shown information of the devices on the page.
Export data: To export the data onto a CSV file. This can be done over an entire page or after filtering the data.
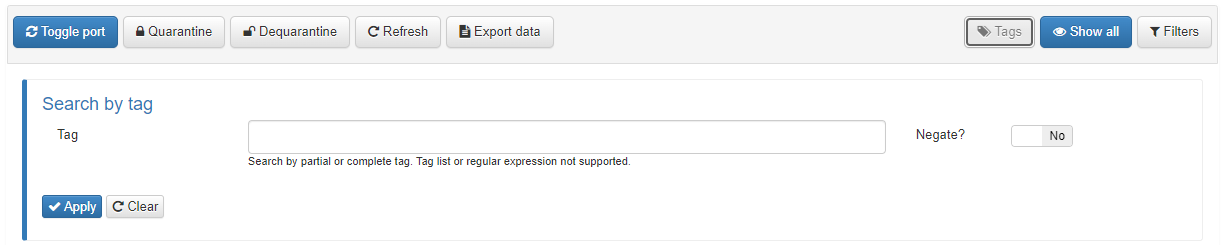
Tags: It is used to search devices by partial or complete tags. Tag lists or regular expression are not supported.
Show all: Shows all the user devices on one page.
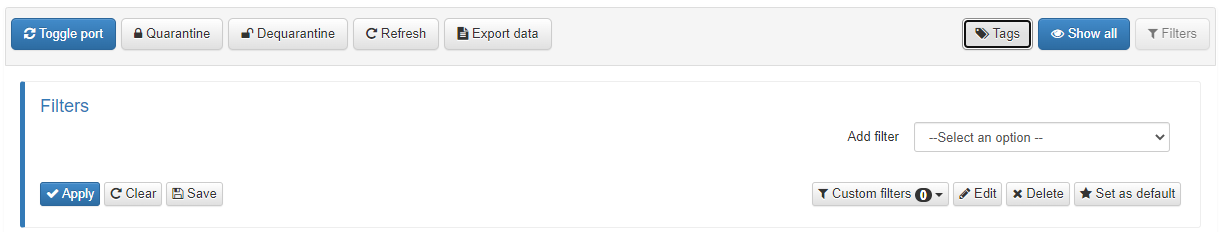
Filters: Use the filter field to search devices on the selected business profile by its MAC address, IP, hostname, or user.
There are two fields that are relevant for operating this view:
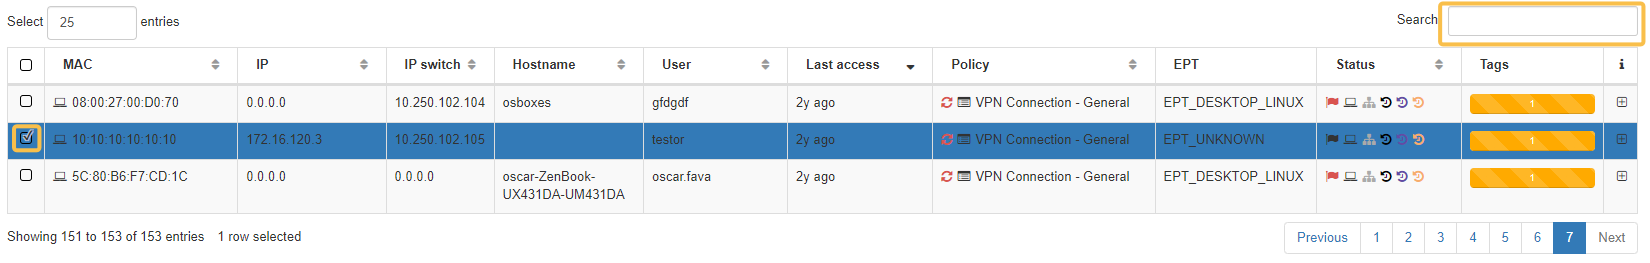
Select: Select a device to apply an action against it.
Search: Use this field to search for an entry by any parameter (MAC address, IP, user, etc.).
Tip
If you want to display all entries related to a device, use its MAC address or Hostname in the search box.
3.1.3.1.1.2. Business Profiles Table
In the main table of this view, you can see the following columns:
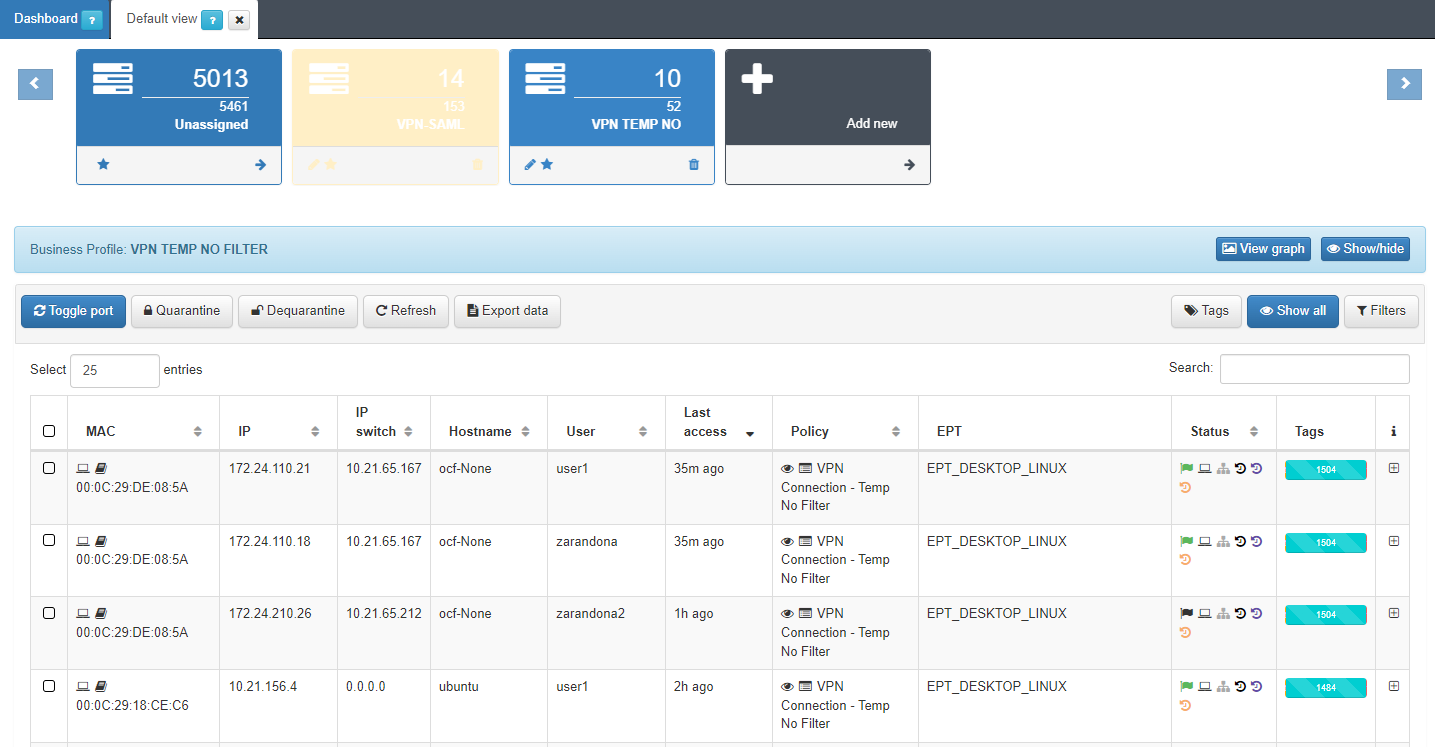
MAC: The mac address of the device. If OpenNAC has not discovered it, it will show 00:00:00:00:00:00.
IP: The IP address of the device. If OpenNAC has not discovered it, it will show 0.0.0.0.
Hostname: The device’s hostname.
User: The user name connected with the device.
Last access: The last seen access.
Policy: The policy that the device has matched. In the policy section we can find three icons:
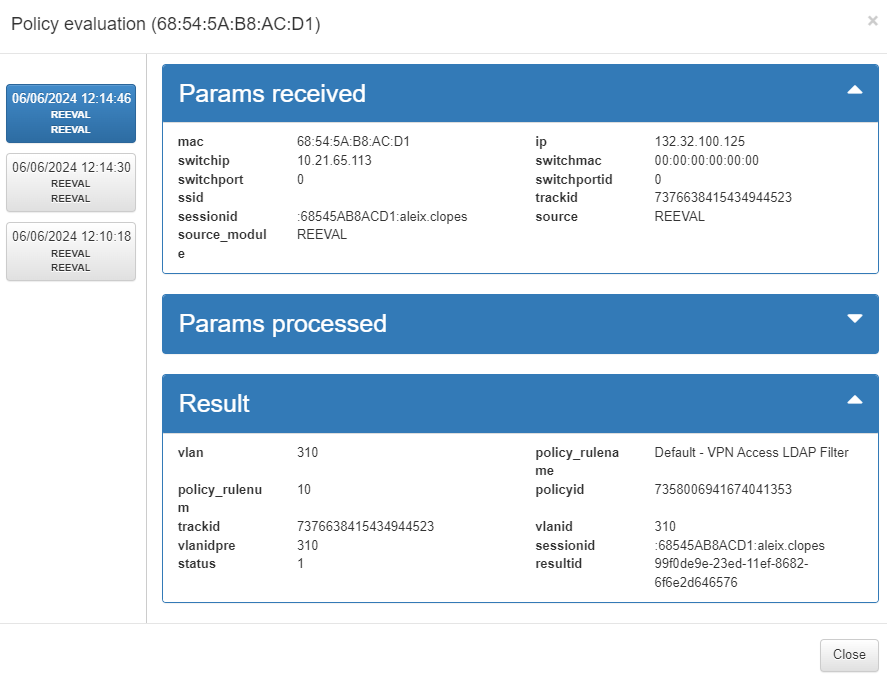
View policy evaluation: The  icon shows the last events for the corresponding device with the information about the parameters received, parameters processed, and response data. The params processed section is collapsed by default, and all segments can be collapsed for better data visualization. The events are described in Events section.
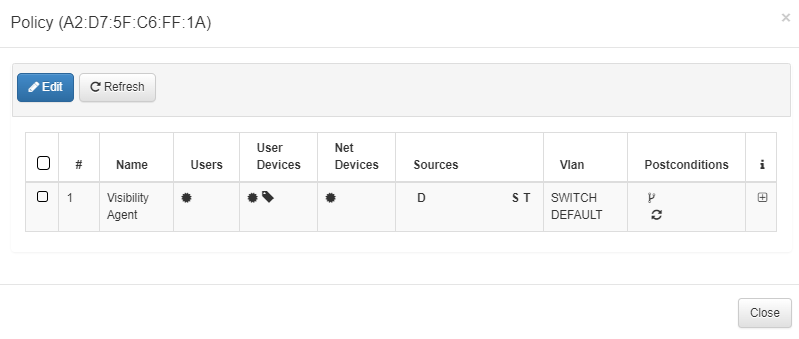
View policy: The ![]() icon shows the policy matched by the device.
icon shows the policy matched by the device.
The  icon indicates that the Policy has changed since last evaluation and must be re-evaluated.
EPT: The endpoint type tag that has been assigned.
Status: This column shows icons with different information that we can see passing the mouse by:

The flag icon indicates the status (green -> active, red -> reject, black -> logout).
The laptop icon indicates if it is a registered device (black) or if it is a quarantine device (red).
The VLAN icon shows the VLAN associated with the device.
The dashboard icons are links to dashboards generated by the device. By default, there are 3 dashboard shortcuts: Discover, Network Behaviour, and VPNGW. By clicking on these icons, it will open a new tab with the selected dashboard. For example:
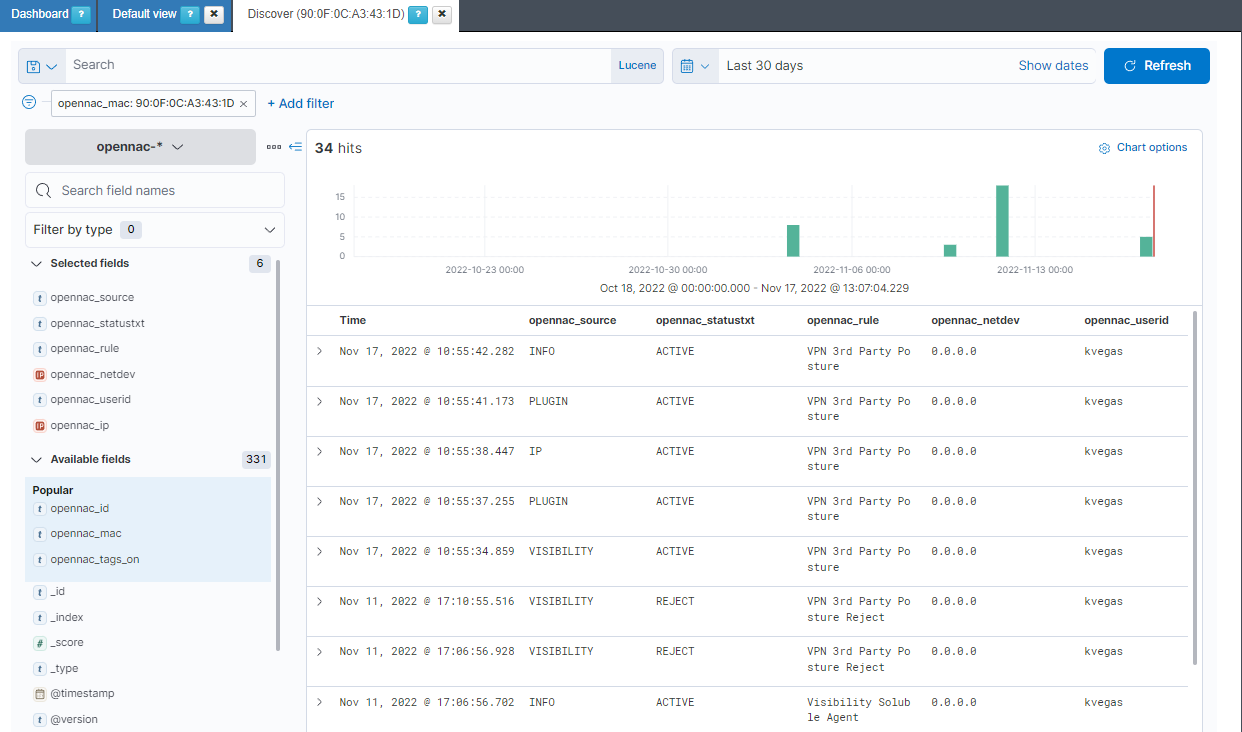
To activate other shortcuts or change configuration see: Configuration > Dashboards
Tags: Shows a bar with the number of tags of each type assigned to the device.
i: From this column, you can expand the information about each event by clicking on the + button.
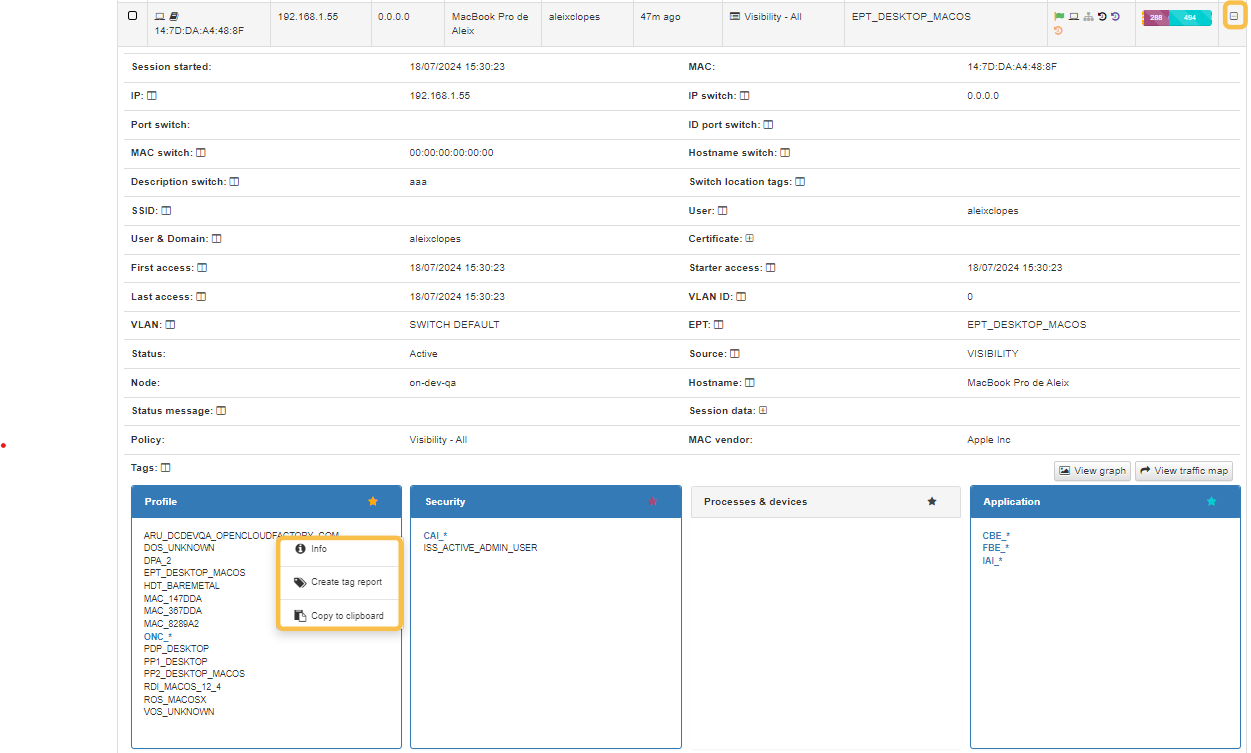
The upper part of the table shows the most relevant information: MAC, IP, how OpenNAC discovered the asset, etc. Most of the fields have a window icon next to them. This toggle icon, allows you to configure that parameter as a column. Every time you see a + icon next to a field, you can expand the information about that field.
At the bottom part of the table, you will see the tags that have been collected grouped by different criteria: Profile, Security, Processes, etc. Right-click on a tag to see its tooltip that allows you to visualize tag info, create a tag report, or copy to a clipboard.
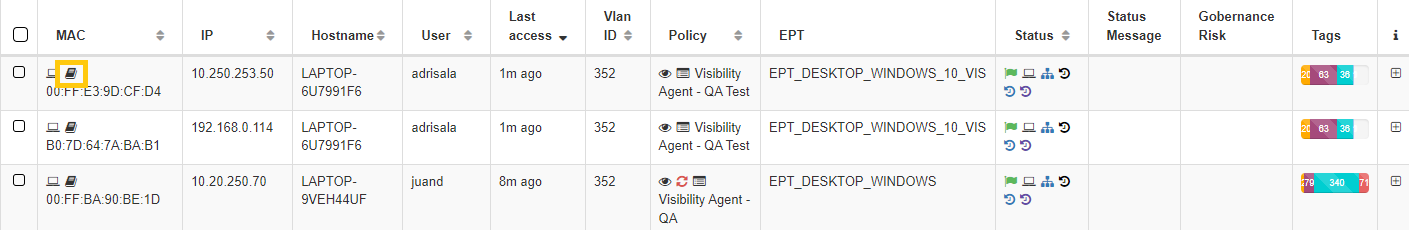
Payloads
If a user device has the OpenNAC Agent installed, and have received any payloads, you can access the user’s payload record from this view. By clicking on the icon highlighted in the image below, you will be redirected to the Agent payloads section. There, you to find all the information regarding the payloads that have been sent by the Agent.
View user device
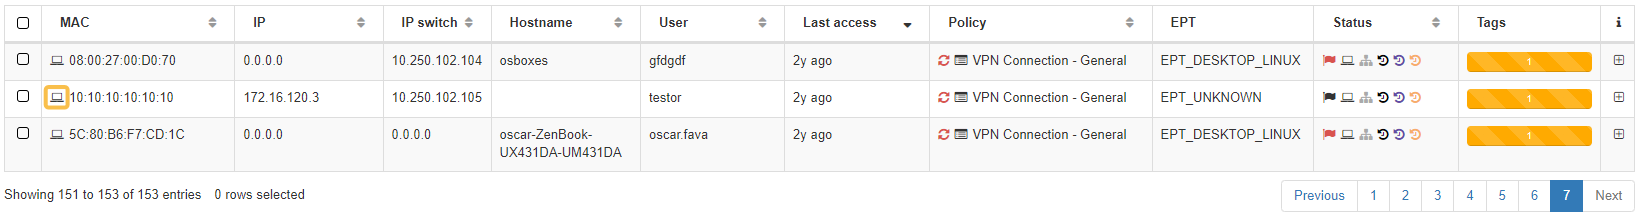
By clicking on the View user device icon, it will display a pop-up window from where you can edit or delete that user device from the Business Profiles section.
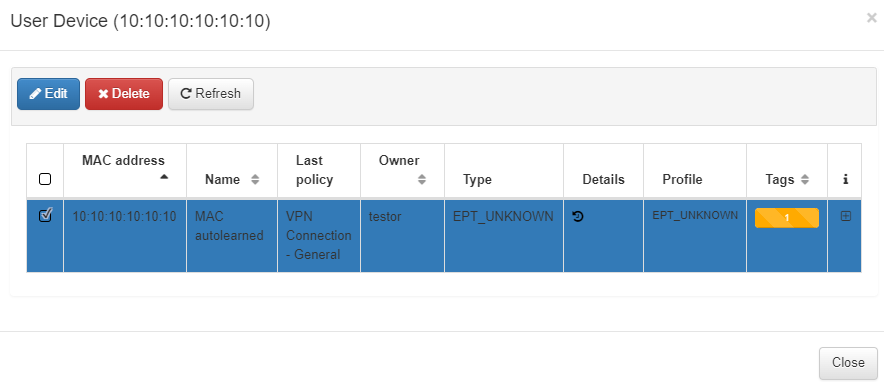
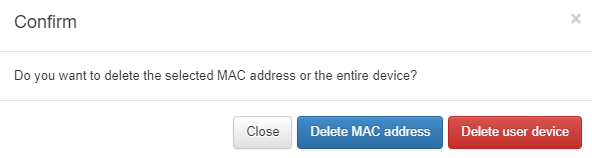
If you choose to delete it, it will ask you whether you want to delete the selected MAC address or the entire device.
3.1.3.1.1.2.1. Event right-click
Administrators can also manage the user devices connections by right-clicking on the event:
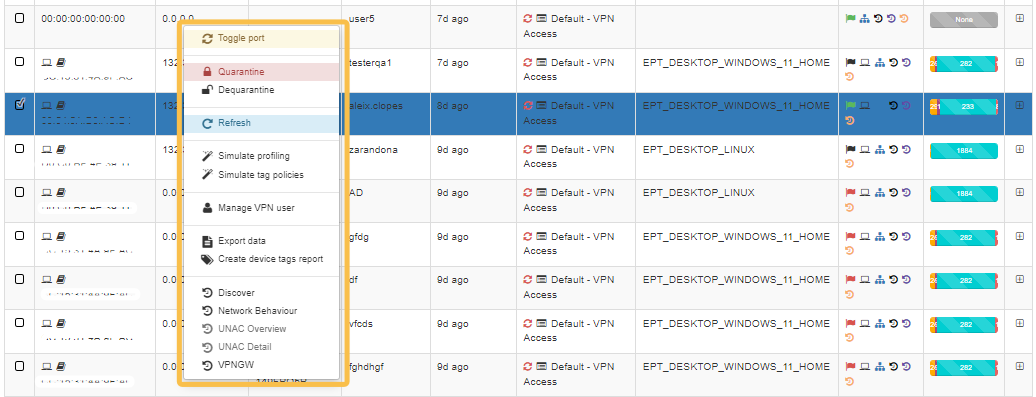
In addition to actions that we have already seen (Toggle port, Quarantine/Dequarantine, and Refresh), there are more features that allow administrators to verify outcomes without causing any direct impact on the user device’s configuration:
Simulate profiling
The Simulate Profiling button serves as a convenient tool for administrators. It enables them to determine which EPT_ type tag would be assigned to a user’s device without triggering a full policy evaluation.
This is particularly helpful when modifications are made to existing profiles within ON NAC > Profiling > User device profiling. The purpose is to verify if any devices will meet the profile criteria and consequently be labeled with the EPT_ tag.
Note
This simulation process does not actually apply the EPT_ tag to the user device; rather, it merely generates a simulated outcome and provides a report. This allows for confirmation without causing any disruption.
Simulate tag policies
The Simulate Tag Policies button provides insight into the specific result tag that would be applied to a user’s device based on existing policies. This evaluation occurs without the need to trigger a complete policy reevaluation for the device.
This feature is helpful when modifications are made to any of the established tag policies within ON NAC > Tag policies > UD Tag policies. The primary purpose is to confirm which result tag from the tag policies will be assigned to the device following the changes.
Note
This simulation doesn’t actually implement any tag onto the user’s device. It only conducts a simulated assessment and subsequently presents a report detailing the anticipated result.
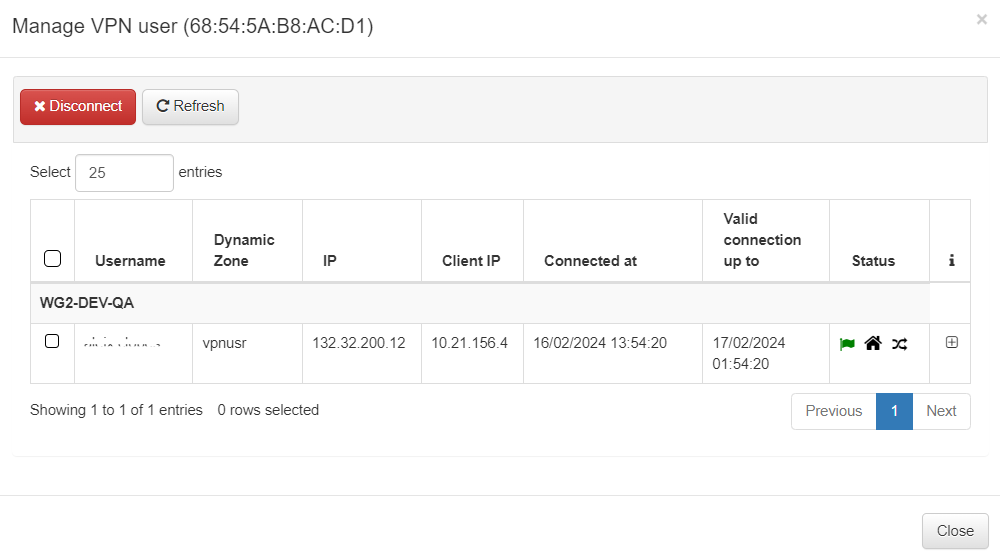
Manage VPN user
If the event comes from an VPN connection, the Manage VPN User option will be available. By clicking on it, it will open the Manage VPN user view.
Export data
This option exports the event data onto a CSV file. If you only want to export a subset, filter the table by the desired value and then click the ‘export’ button.
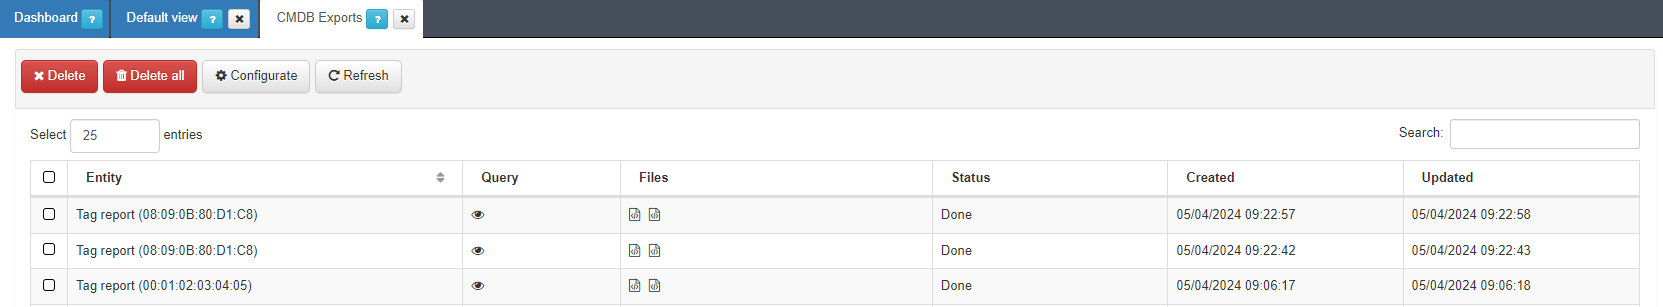
Create device tags report
This option creates a tag report for the selected device. Click on “Create device tags report” to initialize the process. You can download the report from the Status > CMDB Exports in CSV or JSON file format.
Dashboards
By clicking on Discover, Network Behaviour, UNAC Overview, UNAC Details, and VPNGW dashboards, it will open the corresponding dashboard displaying data related to the selected event.