3.1.2. Dashboard
When accessing the OpenNAC Web Administration Portal (installed on the ON Core component by default), the first thing that will appear will be the initial dashboard. This dashboard shows information about the devices of the last 30 days.
Note
The devices with MAC 00:00:00:00:00:00 are excluded on this tab.
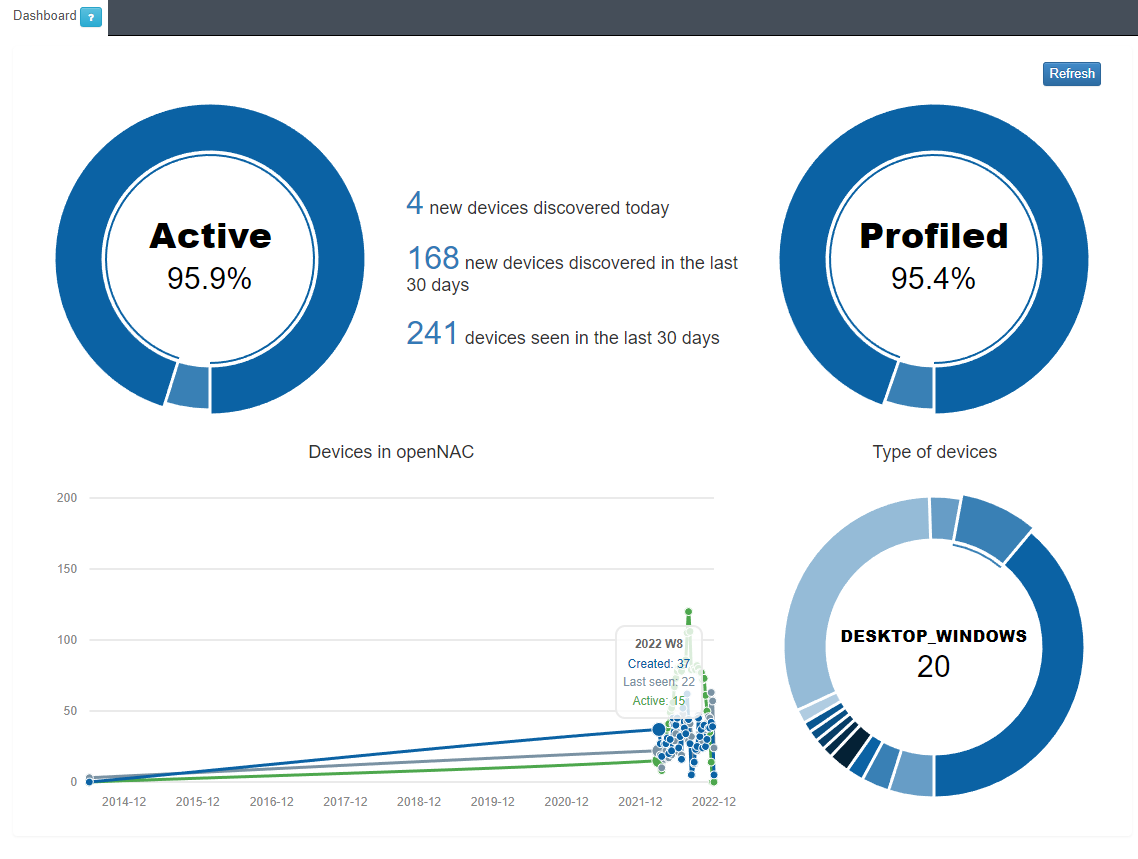
In this first dashboard, we can find basic but useful information, as detailed below.
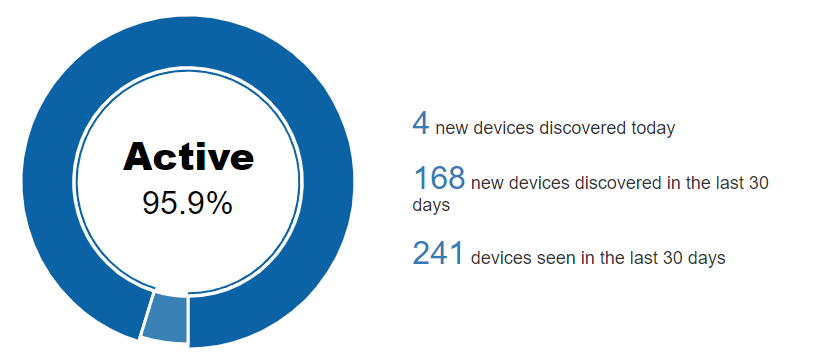
In the Active/Inactive pie chart, we can see the percentage of devices that are currently active on the network.
The central part of the dashboard shows 3 relevant numbers:
Total number of devices discovered in the last 24 hours.
Total number of devices discovered in the last 30 days.
Total number of devices seen in the last 30 days, we understand as a seen device any known device (previously discovered) that has connected to the network.
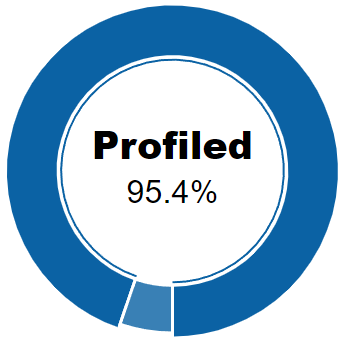
In the Profiled/Not profiled pie chart, we can see the percentage of total devices that have been profiled and those that have not. In other words, once discovered, the percentage of devices that could have their type determined and the percentage that could not.
Profiled information largely corresponds to the Visibility module.
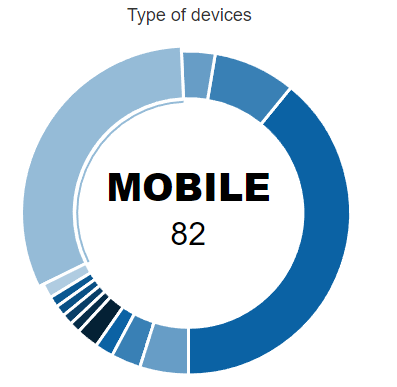
The last pie chart on the bottom right, shows the number of devices identified classifying them by their type. For example, in this case we have discovered and profiled 82 “MOBILE” devices on our network.
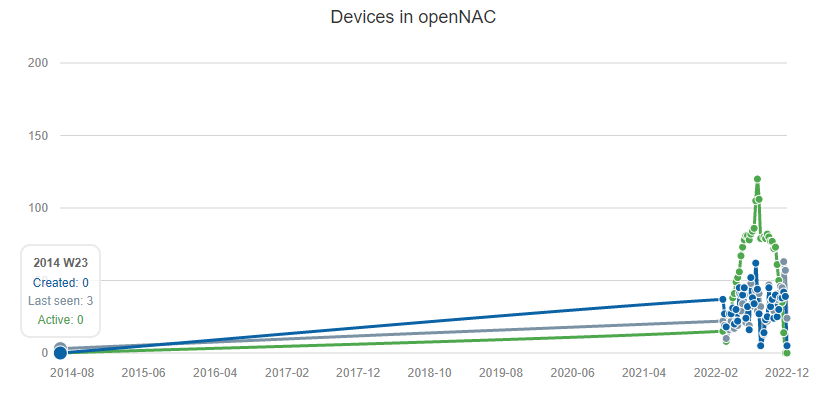
Finally, we have the line chart with 3 variables:
Created: Devices created/discovered during the week.
Last seen: Devices seen during the week.
Active: Active devices during the week.