4.1.5. Administration
The administration section focuses on advanced tasks related to the ongoing management and maintenance of the system covering more complex configurations and advanced features.
This section will detail the steps to configure the system, preparing it to operate its Visibility functionality:
Note
It is essential to have correctly deployed and configured the necessary nodes for this use case.
4.1.5.1. Choose your Visibility Methods
The 3 main sources of Visibility explained in the Introduction (Network Device, Sensors, and Agents) will be detailed in this section.
Note
Keep in mind that Visibility Methods are not mutually exclusive; they complement each other.
4.1.5.1.1. Network Device Method
With this Visibility method, it is possible to obtain a real-time inventory of all the assets connected to the network. All communication with network assets takes place regardless of the access layer and how the asset was connected. The visibility and categorization of corporate and non-corporate assets provide us with critical information about the state of the network. This method is implemented at layers 2 through 4.
All these assets are discovered in passive and active modes, which allows us a deep and non-intrusive discovery of the assets. With this implementation it is possible to identify when and where the asset is connected in real time as well as keeping a history for each device, type of device (Laptop, printer, VoIP phone, tablet, mobile phone, IOT, SmartTVs, etc.) and information about its features.
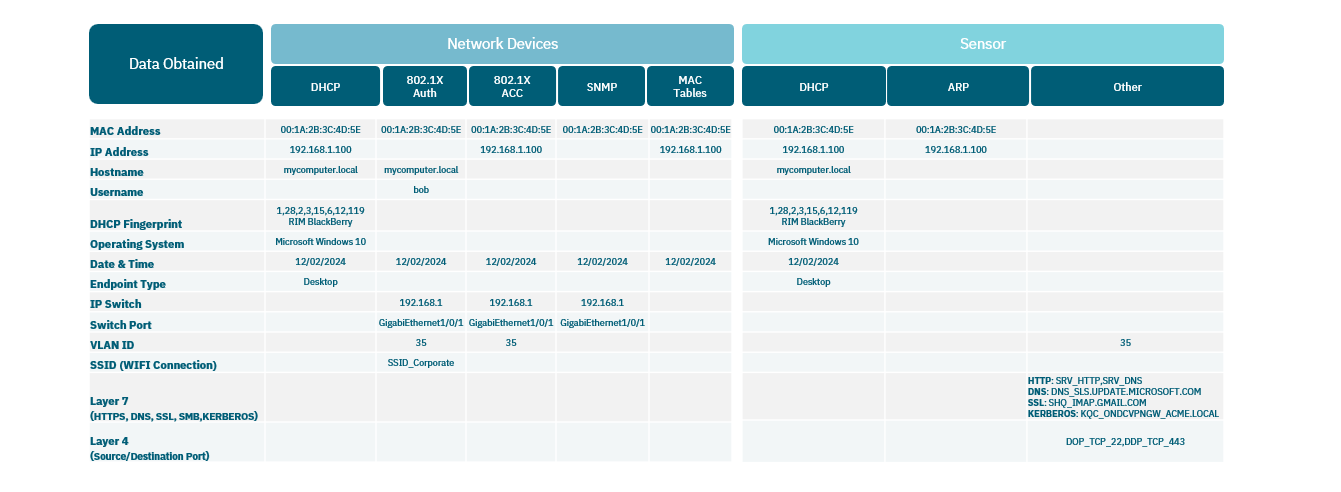
The Network Device visibility method can use the following methods to collect network information to build the CMDB database:
DHCP: Through DHCP-Helper-Reader, the system collects information on the DHCP requests generated on the network. Reading and processing this information provides us with data on existing assets on the network.
802.1x events: Depending on the capabilities of the network, it is possible to collect information from 802.1x accounting events collected from users and devices on the network. This is part of the AAA capabilities provided by network devices that support the 802.1x standard.
SNMP Traps Events: “snmp-traps mac learn” reveals when and where a device connects by identifying its MAC address.
MAC tables of switches and routers: For assets where static IPs are used, this can be a useful method to identify IP information and its MAC address. This method connects to network assets to extract MAC tables and stores the information in the ON Core CMDB.
The following are examples of Network Device Methods scenarios:
4.1.5.1.1.1. DHCP Scenario
The DHCP-HELPER-READER component reads the DHCP protocol, extracting vital information such as IP-MAC pairs, hostnames, DHCP fingerprinting for device identification, and IP-helper addresses to locate device positions within the network.
OpenNAC never replies to any DHCP request, but this component stores the information for profiling and inventory processes.
Refer to the DHCP Concept section for more information.
Learn how to configure it, by following its basic and advanced configuration instructions.
4.1.5.1.1.2. SNMP Trap Scenario
The process of obtaining information by SNMP Traps happens as follows:
A network device generates an SNMP Trap. These traps are typically triggered by events such as a MAC address change on a specific port.
The SNMP Trap is transmitted to the ON Core server using the UDP protocol and ports 161 and 162.
The ON Core server, facilitated by the snmpd daemon, listens for and receives the SNMP Trap.
The Gearmand service acts as an intermediary, managing the SNMP information flow between the network location and the ON Core device.
The ON Analytics node receives the information regarding connected devices, processes it for parsing, and stores it for further analysis.
4.1.5.1.1.3. MAC Discover Scenario
The process of obtaining information by MAC Discover happens as follows:
The ON Sensor, by listening to the network traffic, will generate a new entry in the Business Profiles > Default View registering the device IP without a MAC.
When the IP without MAC is found, the MAC Discover process will start
If the discovered IP network and its gateway are registered, and the Gateway’s SNMP credentials, OpenNAC will try to make an SNMP request to retrieve the Gateway’s ARP table and look for the IP-MAC relationship.
If found, a “VISIBILITY” event will be generated with the IP and MAC of the device.
4.1.5.1.1.3.1. SNMP Traps Configuration
If you have chosen the Network Device visibility method, you can use SNMP Traps to collect information about the MAC, the switch, and the port where the devices are connected and disconnected.
To activate the SNMP Traps functionality, go to the Configuration > Configuration Vars section and select the Generic tab.
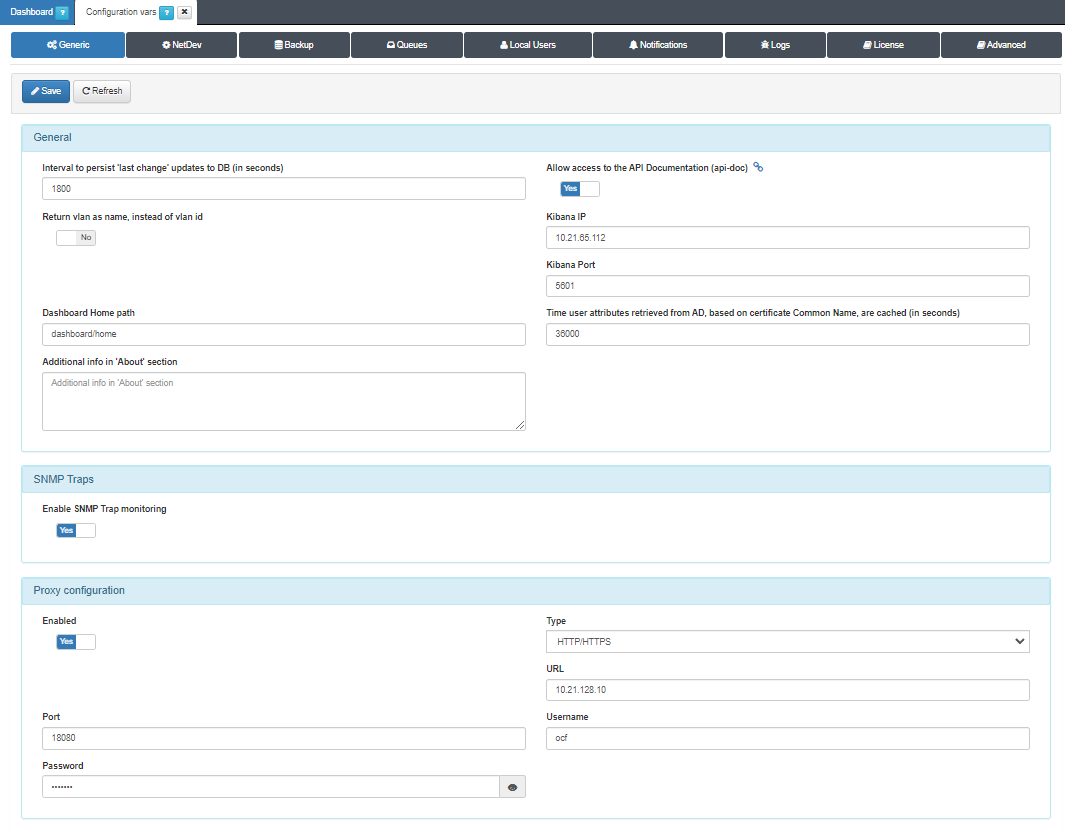
To activate the functionality we simply switch the Enable SNMP Trap monitoring flag to Yes.
Note that a correct configuration of the network switches is necessary. In this case, it is required that the SNMP Traps of the switches point to the system so that it receives the information correctly.
4.1.5.1.2. Sensor Method
This Sensor method enables real-time monitoring of network events by passively inspecting all traffic, providing comprehensive visibility into network activity from layers 2 through 7. It includes monitoring HTTP(S) sessions (web traffic), DNS requests and responses, and SMTP sessions (email traffic).
The ON Sensor collects network traffic via port SPAN and analyzes it using the Zeek service (BRO-IDS), sending the data to ON Analytics for storage using the Filebeat service. Multiple sensors can be deployed based on infrastructure needs and architecture. See the OpenNAC Components section for more information about the ON Sensor node.
The Sensor listens for network traffic through the Port Span configured on the network devices. It collects information passing through these devices, encompassing numerous protocols at the application layer, such as DNS, FTP, HTTP, IRC, SMTP, SSH, and SSL.
Port SPAN (Deep Packet Inspection): This is a mechanism to monitor network traffic. This functionality is limited by the functionalities available in network electronics. This port must be configured on the switch where we want to collect traffic. It works by sending a copy of each packet that passes through another port or ports to a single port. This can be configured with 3 different methods:
SPAN (Switched Port Analyzer): allows you to capture all the input and output traffic of one or more ports on a switch and then send it to another port where the capture device (ON Sensor) will be connected to that same switch.
RSPAN (Remote SPAN): allows you to capture all the incoming and outgoing traffic of a switch port and send it to a VLAN where the traffic of different switches with RSPAN can be accumulated. The Sensor listens on the port where the traffic of said VLAN is being mirrored. By encapsulating the packets in a new VLAN we lose the information regarding the original VLAN of the traffic.
ERSPAN (Encapsulated Remote SPAN): allows traffic from one or more source ports or VLANs to be captured and traffic sent through a routed network (Layer 3) to other devices using a GRE (Generic Routing Encapsulation) tunnel.
Zeek (Bro-IDS): Analyzes activity at the application level and by comparison with predefined patterns. Zeek allows us a great capacity for analysis at the protocol level and a great capacity to manage large volumes of traffic.
4.1.5.1.2.1. Sensor Scenario
Note
Make sure you have properly configured the ON Sensor node for the Visibility use case to enable this method.
The process for obtaining events via the Sensor happens as follows:
An event is generated on a network device and sent to the ON Sensor.
The Zeek service, enabled in ON Sensor, captures and analyzes the events received from the Port Span.
The Filebeat service, also enabled in ON Sensor, sends the events to ON Analytics.
The ON Analytics node, fulfilling the role of On Aggregator, receives the information from Filebeat. It filters and normalizes the data using Logstash, and ultimately stores it in the Elasticsearch of the ON Analytics node. The roles of ON Aggregator and ON Analytics may be on the same node or distributed across multiple nodes, depending on the volume of data being handled. See the OpenNA components section for more information about the ON Analytics node.
4.1.5.1.3. Agent Method
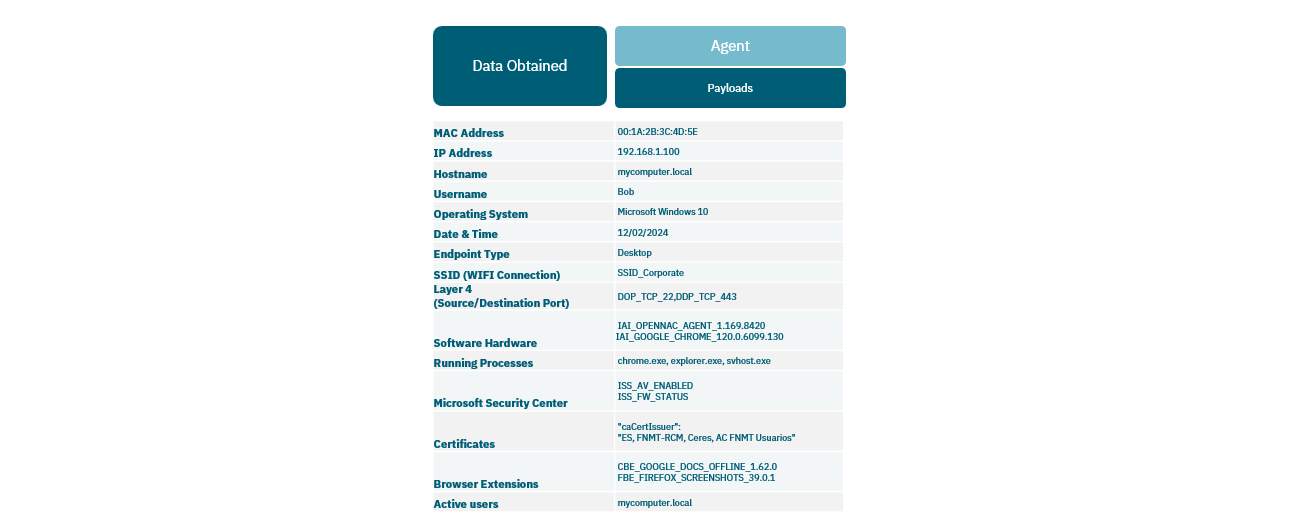
The Agent method involves installing a software (Agent) on user devices to obtain detailed information about them, including a complete hardware and software inventory. This information can enhance both the Network Device and Sensor modes with granular details for more refined profiling rules.
This method operates at the OS layer and is available for Windows, Linux, and macOS in its installable form.
Refer to the OpenNAC Agent section for detailed information about the application.
Familiarize with the most relevant concepts in terms of information exchange between OpenNAC and the user device using the Agent application:
OSquery: By executing queries against the operating system, we gather information related to both software and hardware. Periodically, checks are performed to detect any changes made to the device, including hardware and software alterations.
Events generated by the OS: At times, the operating system itself generates events and notifies without requiring manual queries.
Payloads: Through payloads, relevant information is transmitted to ON Core, such as system details, login/logout events, and the termination of the Agent application.
PowerShell scripts: Utilizing programmable scripts within the Agent, additional device information can be retrieved.
4.1.5.1.3.1. Agent Scenario
The process of obtaining information via Agent happens as follows:
Users download the application to their devices.
Once the Agent is up and running it will send a first payload to the ON Core.
The ON Core will return the Agent configuration file (previously set on the Administration Portal) with the connection rules for that device..
The agent runs on the computer and collects all available information using the mechanisms described above.
This information is sent to ON Core through POST calls to the API through port 443 (by default), this information will be sent from ON Core to ON Analytics for processing and storage.
4.1.5.1.3.1.1. Agent Configuration
If you use the Agent as a visibility source, you must configure the Agent Download and Install Options in the Administration Portal to allow users to download the Agent application to their devices.
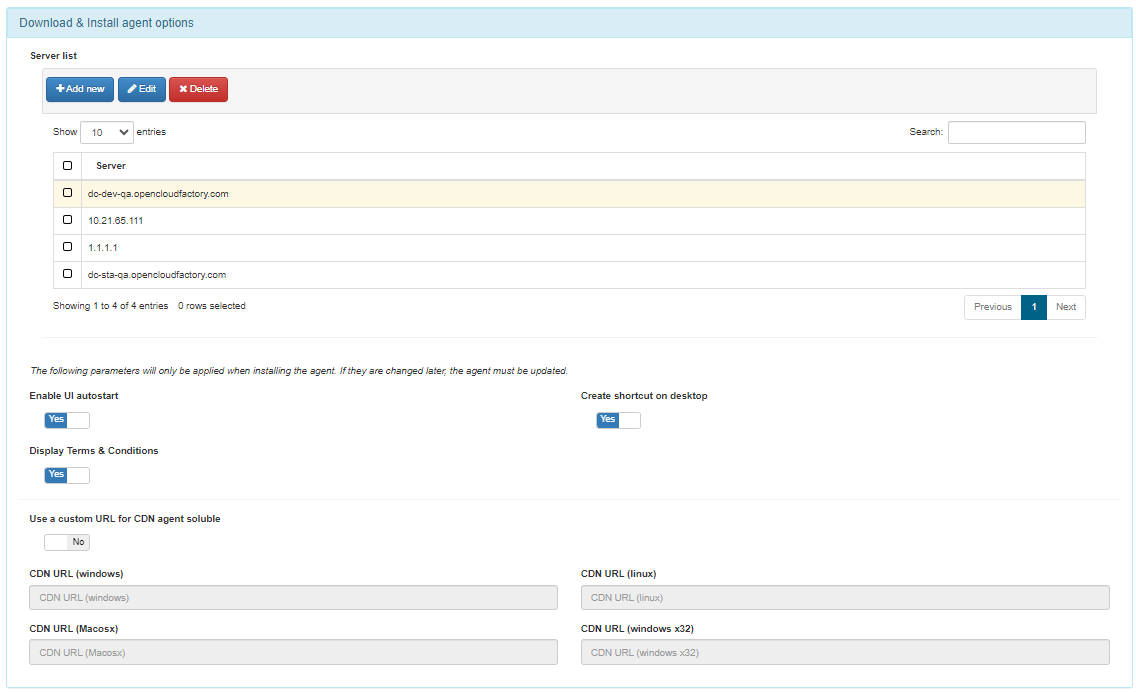
- Download & Install agent options
This section sets up the configuration the agent is installed with and from where it can be installed.
Server list: From this section, you can configure multiple agent URLs and set one as the default to indicate where the Agent can be downloaded from. IP, IP:PORT or FQDN are possible values. This is where the ON Agent will send the payloads.
The following parameters will only be applied when installing the Agent. If they are changed later, the Agent must be updated.
Enable UI autostart: Allows running the Agent’s UI when the Agent is installed.
Create shortcut on desktop: Enabling it creates an Agent shortcut in the desktop.
Display Terms & Conditions: Disable this flag if you want avoid being asked to accept the Terms & Conditions disclaimer in massive deployments.
Enable Wireguard: Inserts the Wireguard plugin in the agent configuration.
Use a custom URL for CDN agent soluble: Flag to enable using Content Delivery Network (CDN) to download the soluble agent. The CDN infrastructure optimizes the download process for the soluble agent.
CDN URL (Windows): Field to insert CDN URL specific to Windows.
CDN URL (Linux): Field to insert CDN URL specific to Linux.
CDN URL (Macosx): Field to insert CDN URL specific to Macosx.
CDN URL (windows x32): Field to insert CDN specific to Windows x32.
4.1.5.1.3.1.2. Agent Profile
If you use the Agent as a visibility source, you can create an Agent Profile and then associate it with a Policy. When a device connection matches a policy and is configured with an Agent Profile as a post-condition, that profile is incorporated into the Agent along with the corresponding configuration.
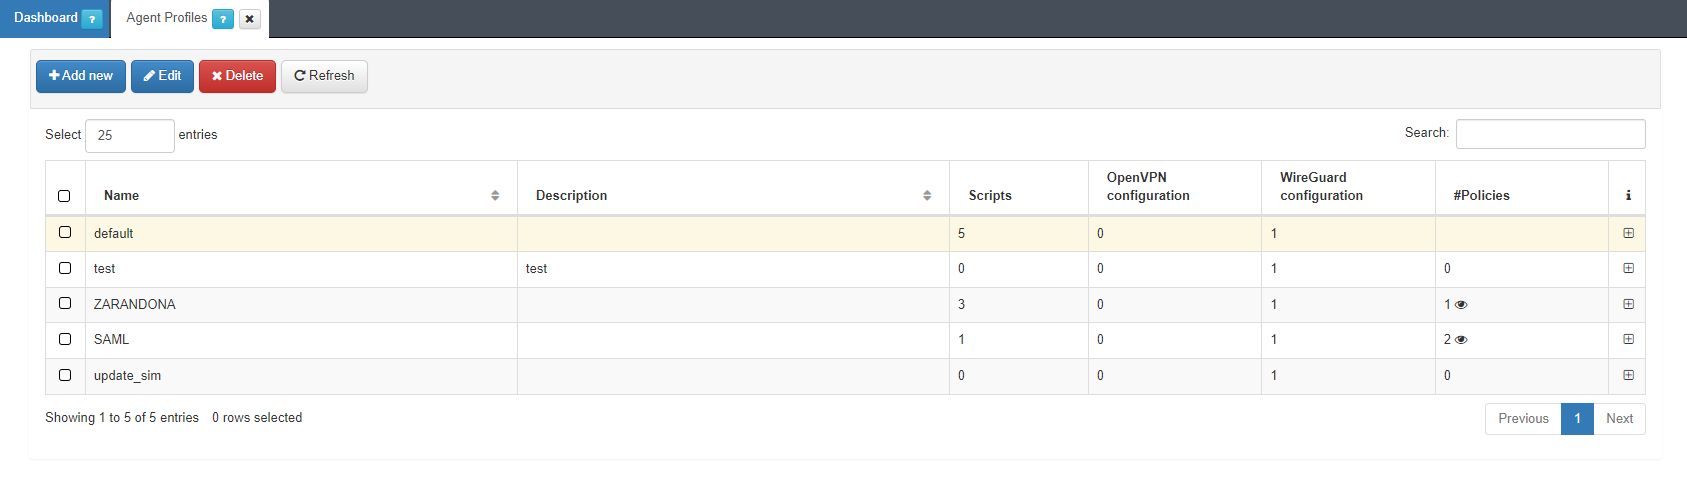
Click on Add new to start configuring an Agent Profile by providing it with a name and description. The Agent profile configuration process involves the following:
Service configuration
VPN configuration
Network renewal configuration
Taskbar configuration
Refer to the ON Agent > Agent Profiles section for detailed information about the parameters needed to properly configure an Agent Profile.
Once the configuration is complete, users will need to download the Agent application to their devices. Refer to the Agent End User Guide for instructions on how to install and use the Agent application.
4.1.5.2. Configure Visibility Policies
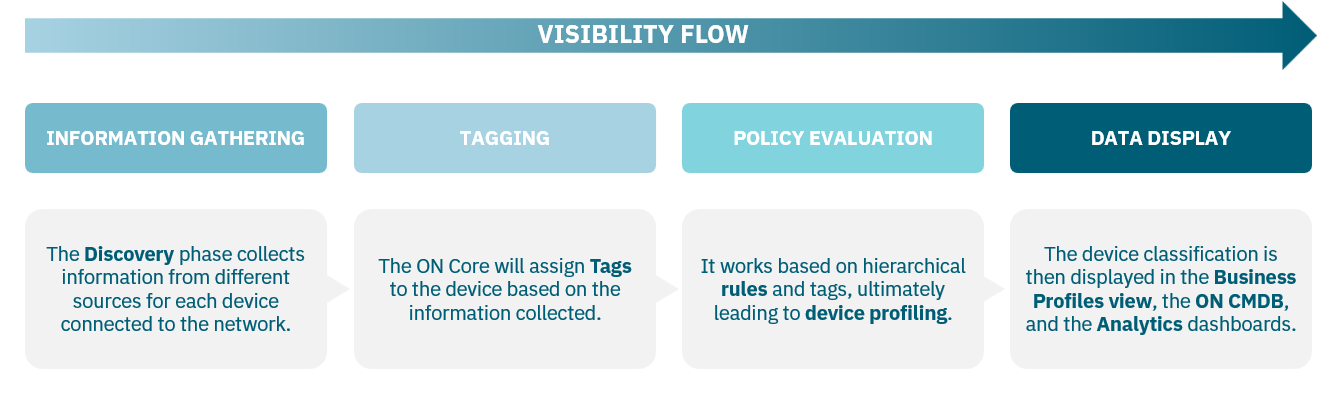
The Visibility Policies enable OpenNAC to profile devices that match established conditions. Refer to the Visibility Introduction section to understand the policy logic.
For each use case, specific policy parameters are relevant. In the case of Visibility, note that you don’t need to configure every available parameter in the policy. We will only focus on those necessary for achieving visibility within the network.
You will configure policies according to the Visibility source or sources deployed in your network. This section will detail the policy examples based on the different sources:
To create a new policy, navigate to ON NAC > Policies and click on Add new.
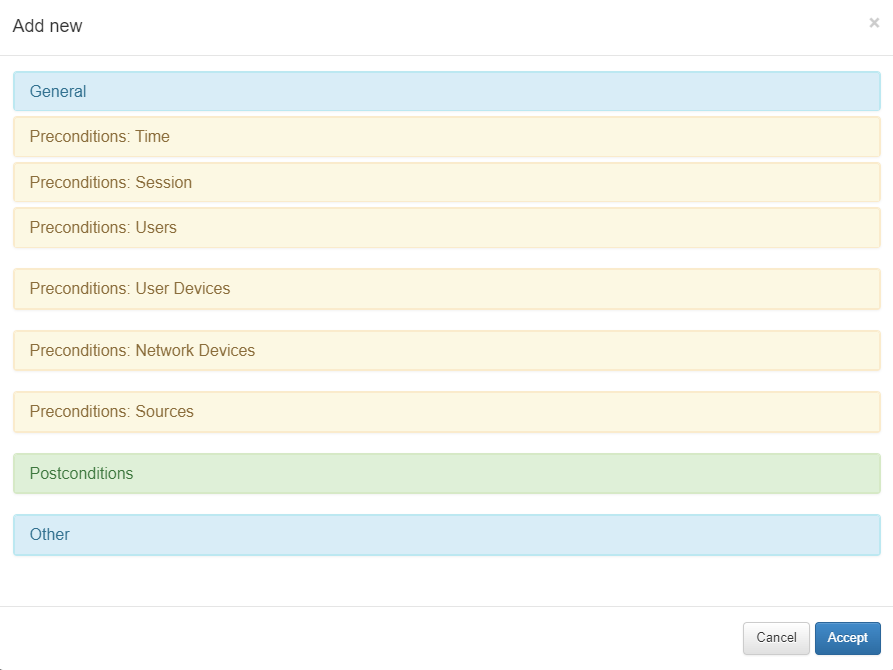
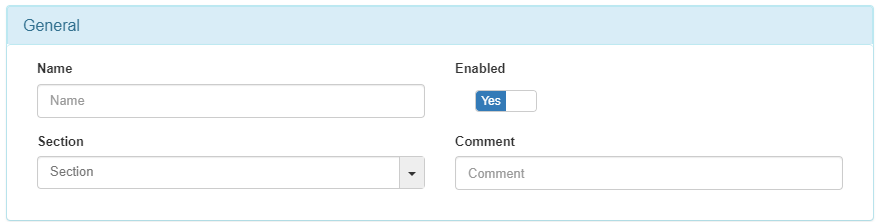
4.1.5.2.1. General
Every policy must have a name, a comment detailing its behavior. Additionally, if you intend to activate the policy, ensure that it is enabled.
4.1.5.2.2. Preconditions: Sources
The preconditions serve as prerequisites for a connection to match a policy before authentication. Enable the flags according to the Sources chosen for your policy.
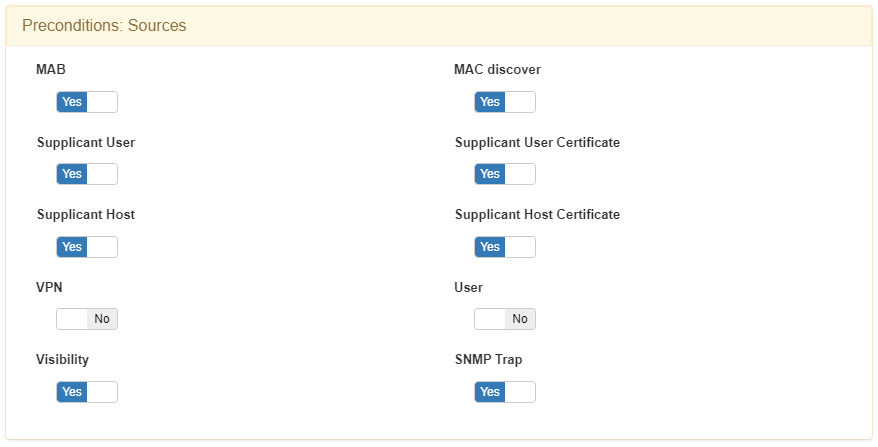
802.1x events: 802.1x events give us network visibility and device discovery through AAA (Authentication, Authorization, and Accounting) packets. Keep in mind that this discovery method is directly related to the network access control (NAC) functionality and therefore its use is conditioned by the implementation of the ON NAC module.
MAB
Supplicant User
Supplicant User Certificate
Supplicant Host
Supplicant Host Certificate
MAC Discover: When we see traffic through the Sensor with an IP that was not previously identified by the system, MAC discover offers us the possibility of discovering the user device or MAC associated with this IP. By asking the network devices (configured in the CMDB), which act as default gateway, we can determine the MAC by consulting the ARP tables of these network devices.
Visibility Events: The visibility source allows ON Core to process all those events generated that give us network visibility, for example, events from ON Sensor. Any event can become a visibility event if there is no previous data related to the connection, these can be from IpMac, Agent, Accounting, etc.
SNMP Traps Events: The SNMP TRAP source allows ON Core to process events that come from SNMP Traps sent by network devices. This Trap must be in version 1, 2, or 3 and include the MAC address of the user device. It is important to emphasize that the Traps must be of the MacChange type since the LinkUp/LinkDown do not have an associated MAC, so they do not provide us with visibility.
4.1.5.2.3. Postconditions
Once a policy has been embedded, you can define certain actions against the discovered device. These actions are called postconditions.
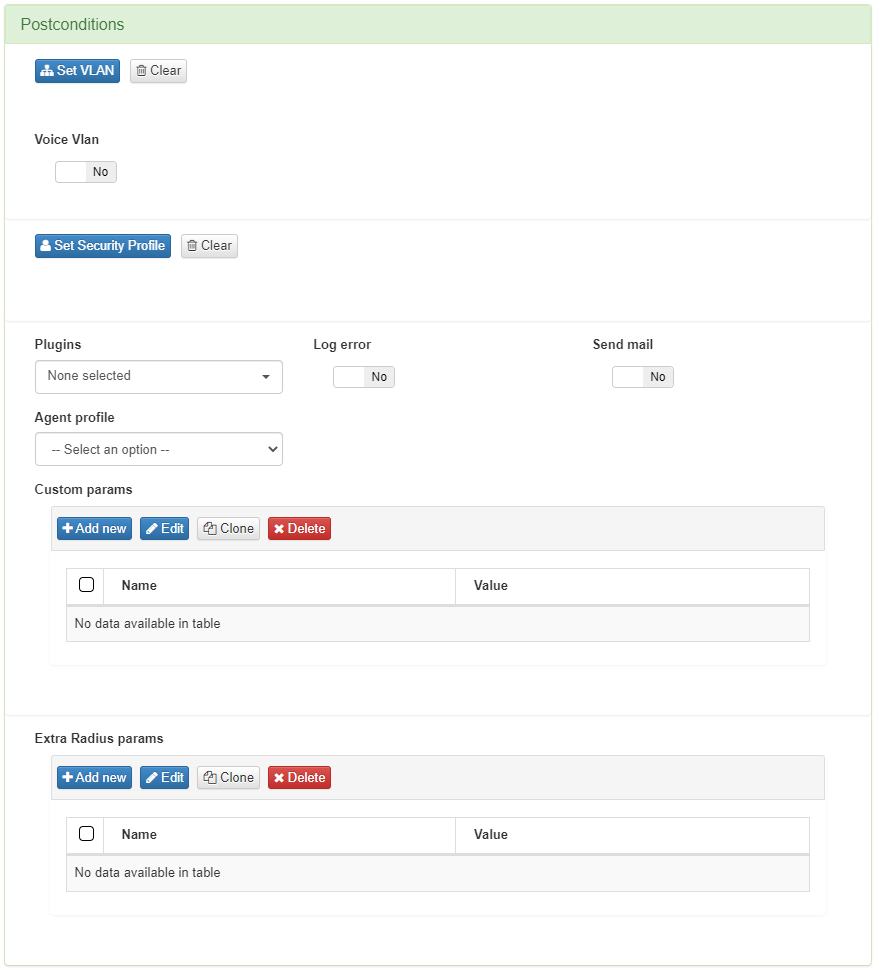
VLAN
You can determine into which VLAN the device is going to be sent to. Since this is a visibility module and not a NAC or network segmentation module, the default option should be VLAN 0 or Switch Default. By using Switch Default, OpenNAC Enterprise will not modify the VLAN to which a device will be assigned and the switch will use the one defined by default. The definition of a VLAN is mandatory in all policies.
Plugins
Before applying plugins as postconditions, they must be previously enabled. Learn how to do so in the following section dedicated to Plugin configuration.
These plugins perform deeper profiling of the devices accessing the network. In this section, you can select the plugins you want to execute once the preconditions of the policy have been met.
4.1.5.3. Plugins Configuration
The plugins must be correctly configured so they can extract the most information to provide visibility.
Note
It is only recommended to enable those plugins that are necessary for the proper functioning of the organization. Installing more Plugins than necessary increases the attack surface, thus benefiting attackers.
To activate and configure these plugins, navigate to Configuration > Plugins. Here you can enable the plugins that you want to use and have available when configuring you policy postconditions.
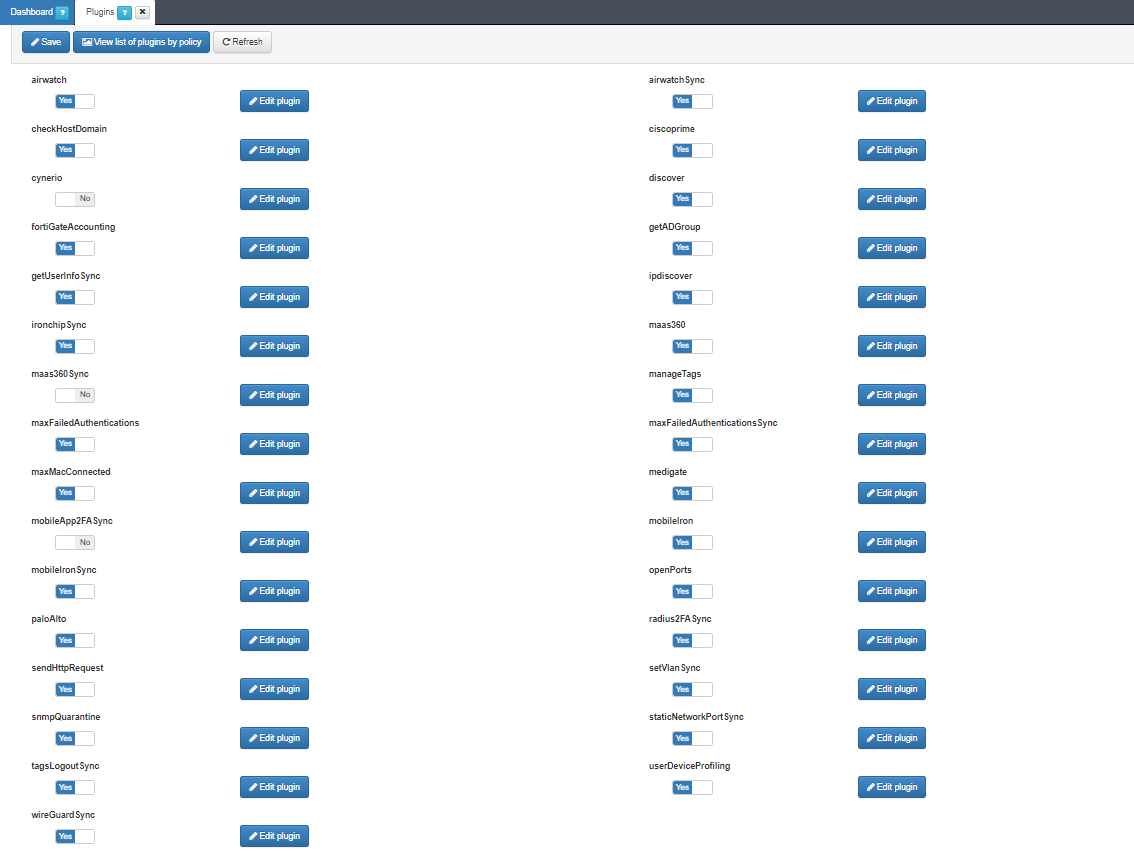
Enable the plugins from the flags on the main view, and configure each plugin by clicking on their respective Edit Plugin button.
Although OpenNAC offers an extensive list of plugins to provide visibility in different scenarios, the main visibility plugins are:
discover
checkHostDomain
userDeviceProfiling
openPorts
It is important that after individually configuring the plugins that will be used, you click on the Save button at the top of the main view to apply the configurations.
Navigate each the Visibility Plugin sections to learn their corresponding configuration options:
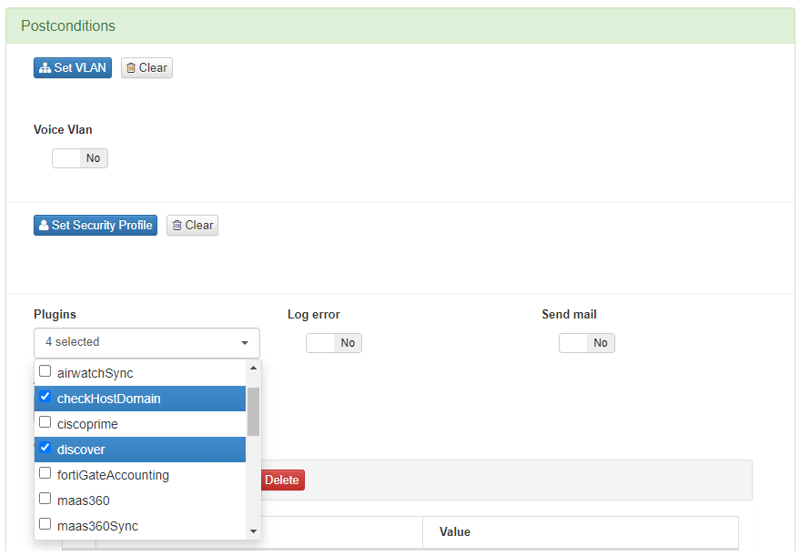
4.1.5.3.1. Apply plugins to policies
To make use of the visibility plugins, they must be activated in each of the network access policies. remember these plugins are part of the “Postconditions” section of the policies, that is, they are executed once the device has matched said policy.
To activate these plugins navigate to ON NAC > Policies to create a new policy or modify an existing one.
Click on Add new or Edit and the configuration window will pop-up. Scroll down to the Postconditions section and in the Plugins dropdown, select those that you want to activate.
You can modify the configuration of these plugins in the policy itself by adding Custom params. In this way, the configuration parameters of the plugin are modified only for their execution within the current policy.
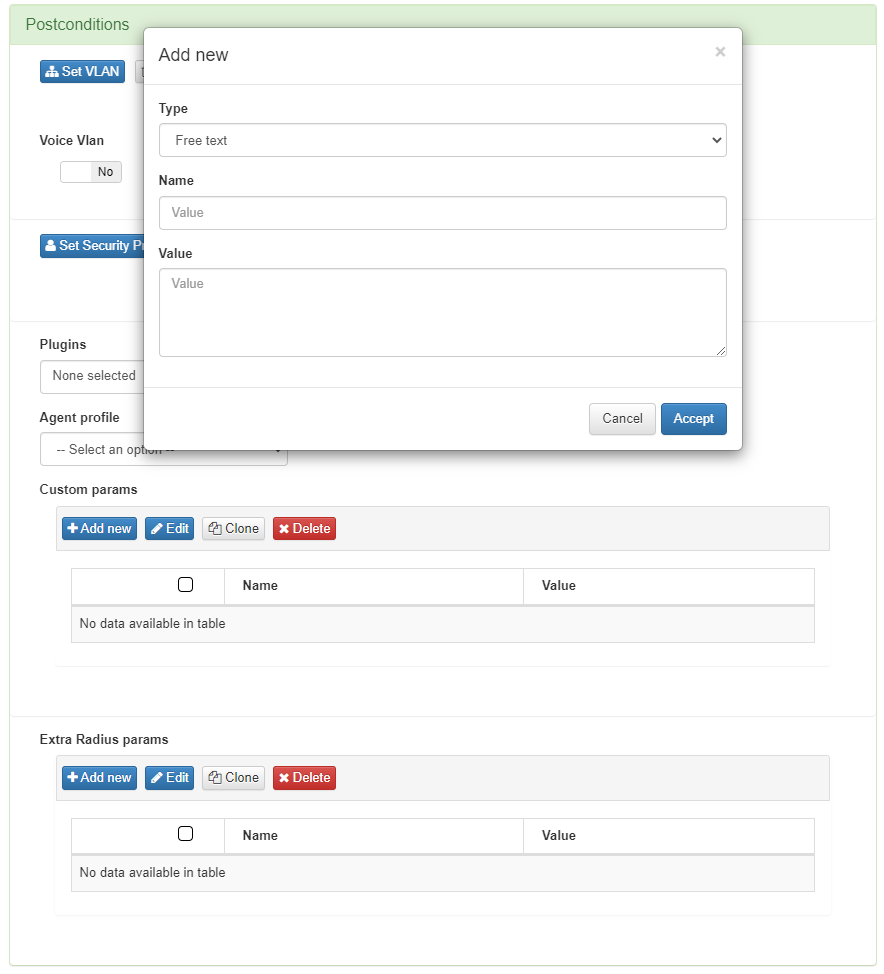
These custom params are configured with the following attributes:
Type: Type of custom parameter, in this case Plugin configuration.
Name: Name and parameter of the plugin that we want to modify.
Value: Value to be assigned to the selected parameter.
Once all the necessary plugins have been activated and the rest of the policy variables configured, click on Accept to save it.
4.1.5.4. Profiling
Another feature of the Visibility module is the ability to assign profiles to discovered devices on the network. This allows categorization based on device type, such as phones, computers, printers, Smart TVs, PLCs, cameras, sensors, etc.
Device profiling is achieved by setting up profiling rules. These rules utilize collected information and assess various parameters such as OS, DHCP fingerprint, and ports. This allows for the assignment of different device profiles, aiding in the visual organization and classification of devices in your network.
Unlike the Tag policies, OpenNAC only adds EPT (End Point Type) Tags with profiling Tags. These tags are exclusive, ensuring that no two EPT type tags are assigned to the same device.
Device profiling flow:
Once the device connects to the network and it is discovered, by using any of the methods described in the Visibility Discovery section, the new connection will be displayed in the Administration Portal. The view that will give you the richest information about the profiled device is the Business Profiles section:
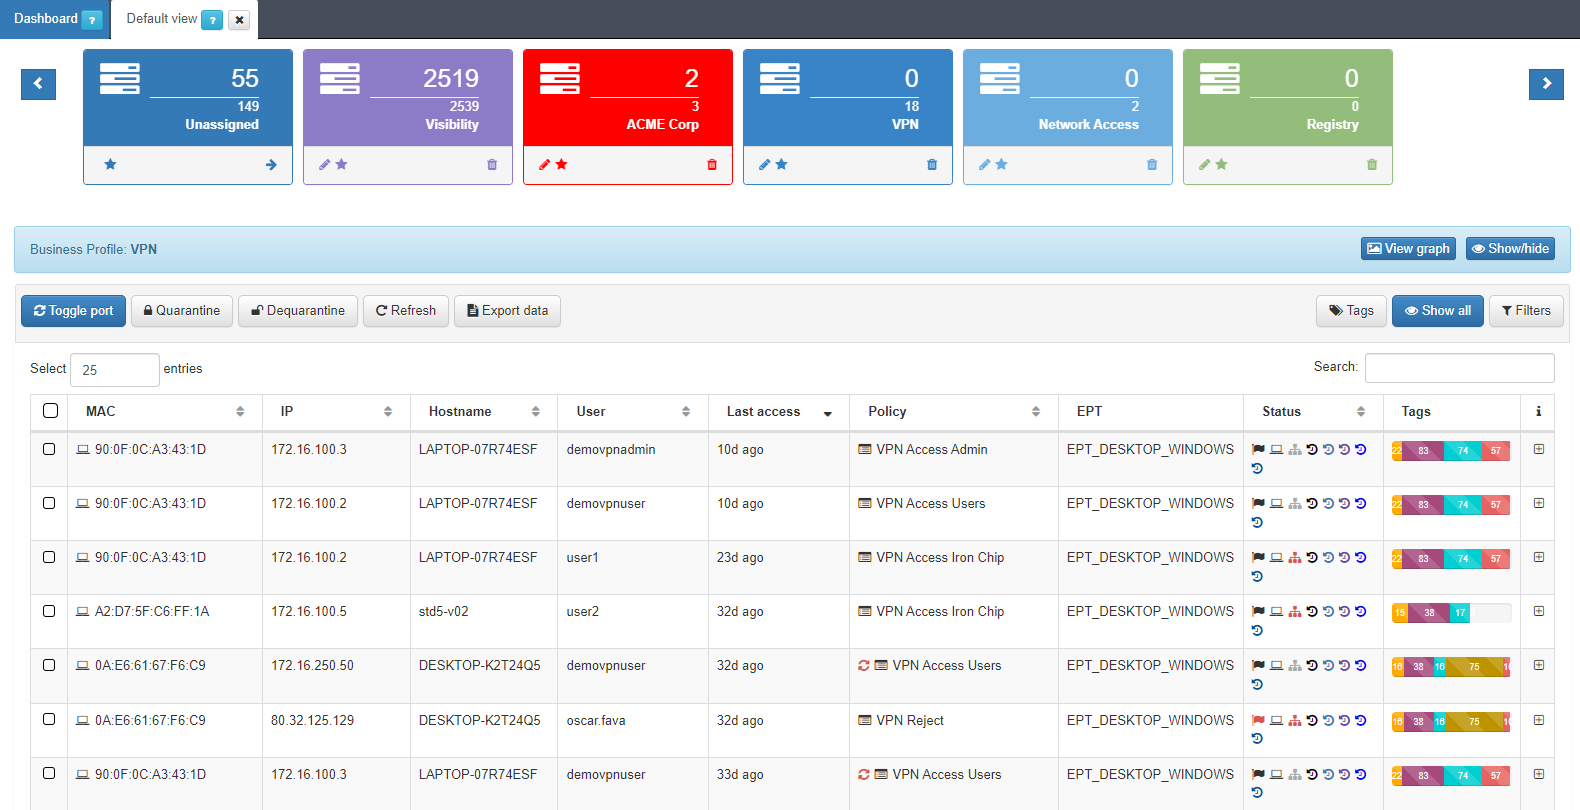
Given that the profiling of the devices is carried out continuously, if new information related to the device is discovered, the connection can be re-evaluated and it could change its profile.
4.1.5.5. Profiling Rules
This section allows defining different parameters to evaluate every single asset discovered by OpenNAC Enterprise. Based on this evaluation OpenNAC Enterprise inserts an EPT tag on the asset and the user can generate a policy or policies to validate or filter the assets that match it.
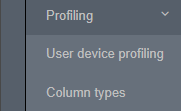
User device profiling: Allows managing policies associated with the mechanism to identify the type of asset
Column types: Allows to manage (add, edit, or remove) the components used by user device profiling.
4.1.5.6. User device profiling
In this section, the user can create, edit, clone, delete, and simulate tags for endpoints discovered in the network. Also, administrators can import profiles from a JSON file. Based on this evaluation, OpenNAC Enterprise will insert a tag indicating the type of the device with the aspect “EPT_<device type>”
Note
When traversing this section, only continue traversing one of the hierarchies if at least one rule of the main hierarchy has been met. For example, EPT_DESKTOP_WINDOWS will be checked if at least one rule of EPT_DESKTOP is satisfied.
In addition, Parent Profile (PP<hierarchy level>_) and Parent Device Profile (PDP) tags will be added to tag different levels of the hierarchy, for example EPT_DESKTOP_WINDOWS will create PP1_DESTKOP, PP2_DESKTOP_WINDOWS, and PDP_DESKTOP.
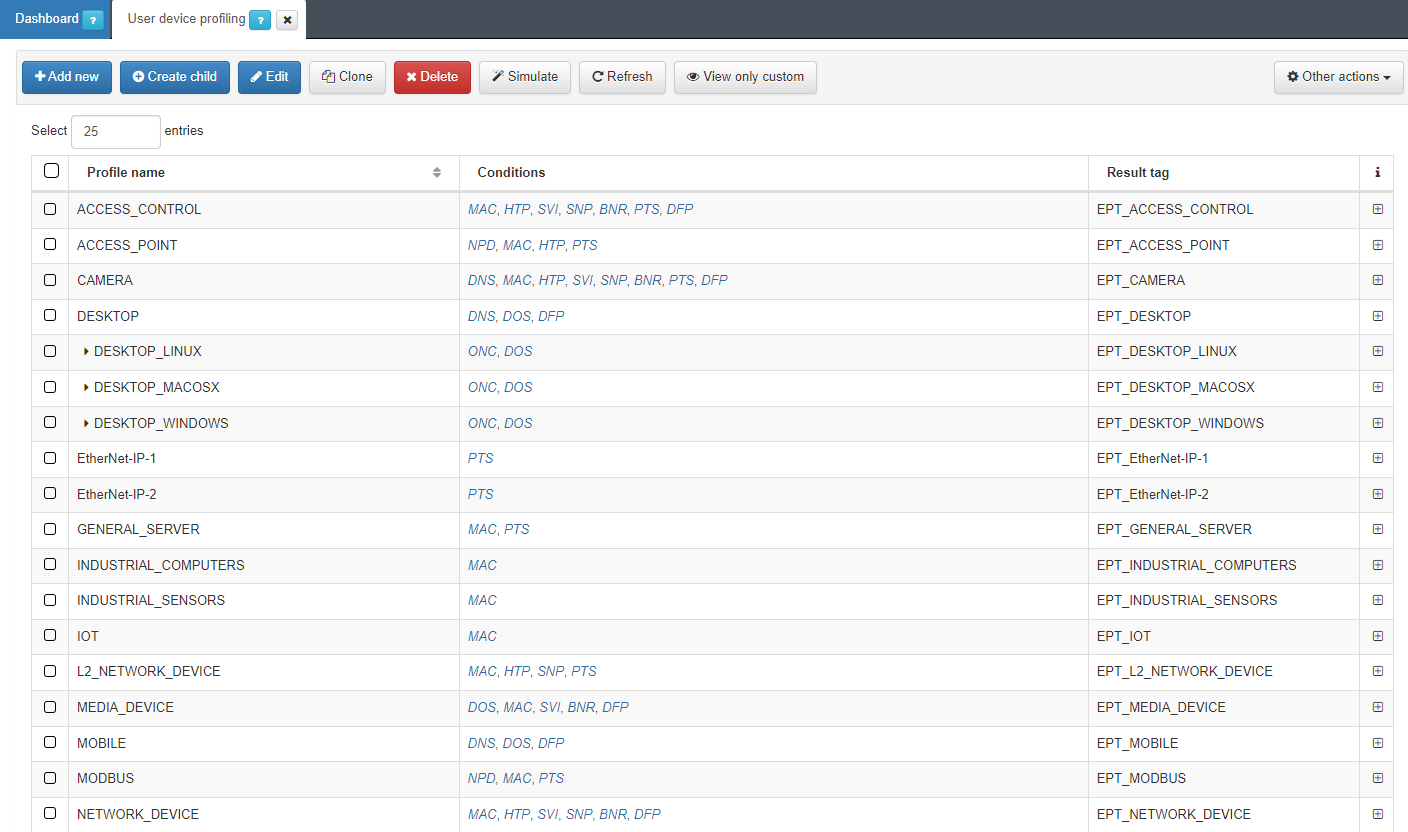
It is recommended to keep intuitive names to identify the profile’s reason. We can expand the information of each profile by clicking on the + icon:
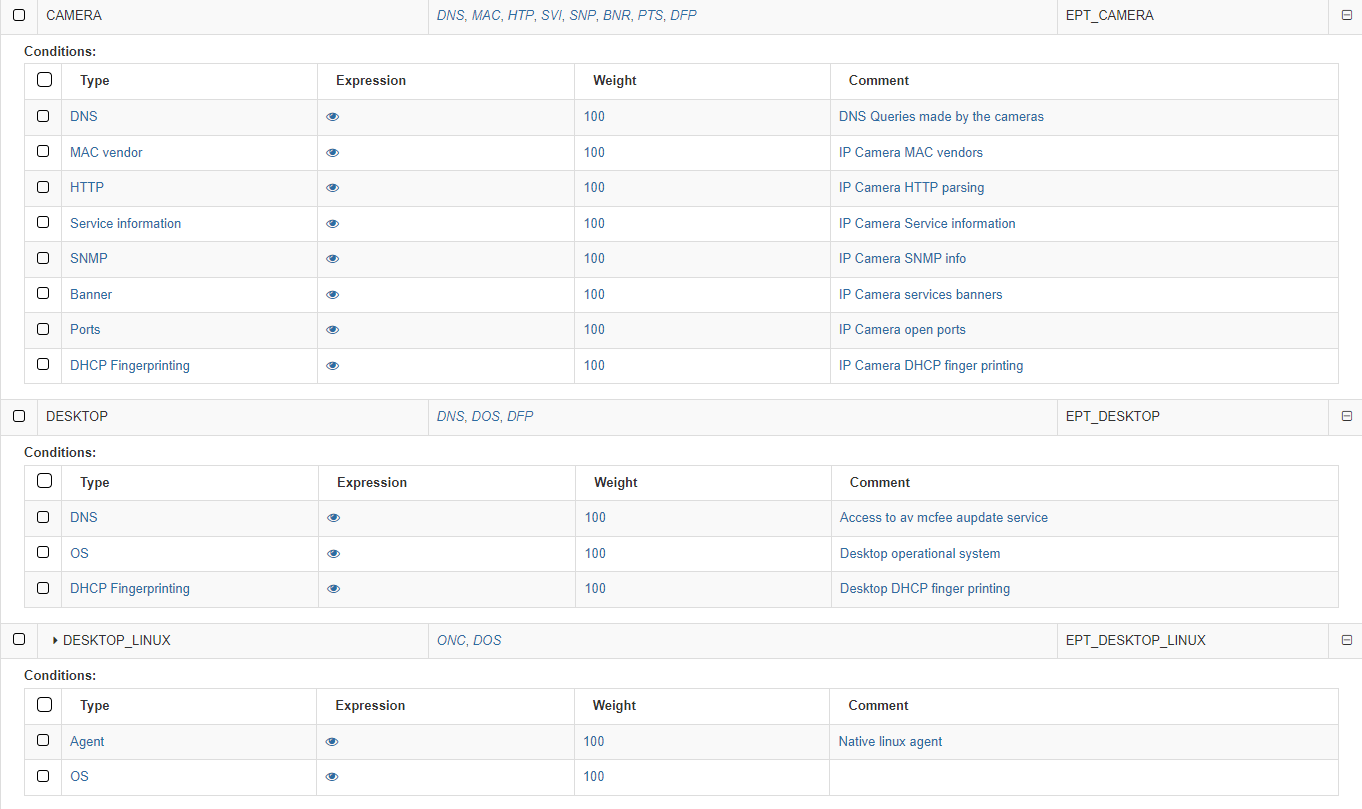
The first column on conditions shows the Type. The following list shows examples of mechanisms and methods used to identify the type of asset discovery and how it is going to be categorized:
Banner: OpenNAC Enterprise uses the banner discovered by the scanner used.
DHCP Fingerprint: OpenNAC Enterprise uses the DHCP Fingerprint capability to identify the asset type. DHCP Fingerprint is a profiling technic that allows you to identify the type of assets based on DHCP messages and its behavior.
HTTP: Information harvested by an HTTP request to the asset discovered -customized streams can be included to identify assets.
MAC Vendor: OpenNAC Enterprise can use the OUID associated with the MAC Vendor in order to discover asset typology. There may be general manufacturers (components) but in some cases, these are specific to the type of device. This system performs a weak identification since it is relatively easy to change or spoof the MAC on a device (MAC Spoofing)
Ports: OpenNAC Enterprise can use the open ports by the asset to identify the asset types.
Service Information: OpenNAC Enterprise uses the service information identified by the OpenNAC Enterprise Scanner (based on nmap), that provides the asset associated with a service.
SNMP: OpenNAC Enterprise can get and use SNMP information from the assets, additional information such as communities and OID can be used and defined.
OS: OpenNAC Enterprise uses the device operating system to get a better profiling.
Network protocol: OpenNAC Enterprise identifies the network protocol used by the device.
DNS: The DNS queries made by the device are used by OpenNAC Enterprise.
Agent: The native agent attributes allows OpenNAC Enterprise to get better profiling.
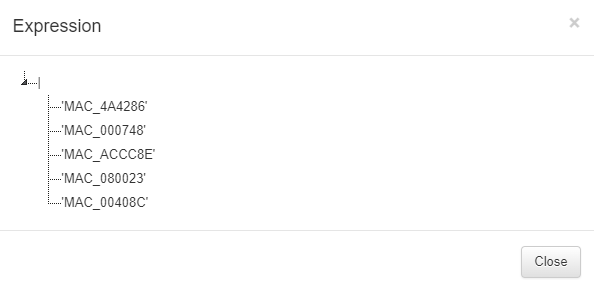
The second column Expression allows us to see the expression used by clicking on the eye icon. by the product to identify the assets types. For example an “or” (|) between some MACs:
The expressions used for creating rules must be written using the following specifications:
parameters: Elements that make up the expressions (Tags).
( ): Parentheses are used to group expressions and parameters.
|: The OR character (logical operational) to indicate that any of the parameters are valid.
&: We use the AND character (logical operational) to indicate that the parameters are sums, meaning they all have to be fulfilled.
!: We use the NOT character (logical operational) to indicate that it should not contain the parameter.
,: The comma is used to indicate and separate the new parameter to analyze.
‘ ‘: Parameters are declared in quotes. For example:
Must contain all parameters = (&,’MAC_B2C7BE’,’EPC_CORPORATE_DEVICE’)
Must contain one of the parameters = (|,’MAC_B2C7BE’,’EPC_CORPORATE_DEVICE’)
Must not contain the following parameter = (!,’MAC_B2C7BE’)
The third column Weight defines a number from 0 to 100 that indicates the weight we want to apply to that condition.
The last one, Comment, shows the comments associated with the mechanism.
For each profile, we can see the tag that will associate with the device that matches the conditions.
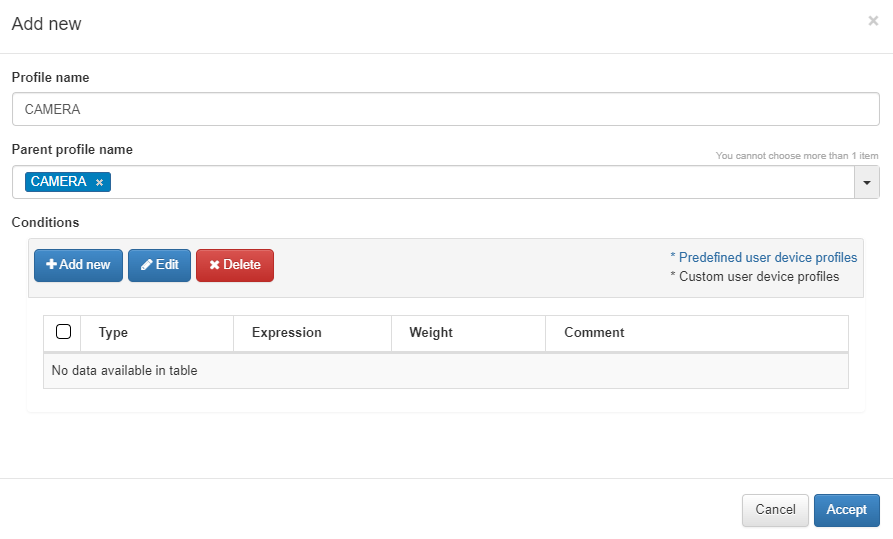
To add a new rule, click on Add new:
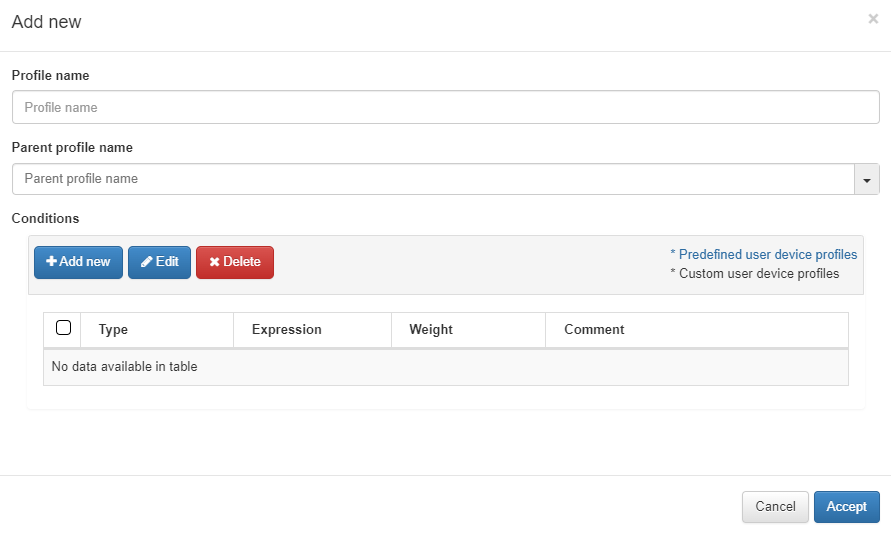
The parameters that should be configured are the following:
Profile name: Name of the profile that corresponds to the tag that will be added to the device if it matches (EPT_<profile name>). When defining the name, it is not necessary to add the EPT prefix since it will be added automatically.
Parent profile name: In the case of a “child” rule (explained below), we select the name of the parent rule that it belongs to.
Conditions: The next step will be to configure the conditions for our rule. Some of them will already be predefined, but if not, we can configure them at our convenience. If we already have one configured, we can select and edit it if not, to create a new one click on Add new and a window like the following one will open.
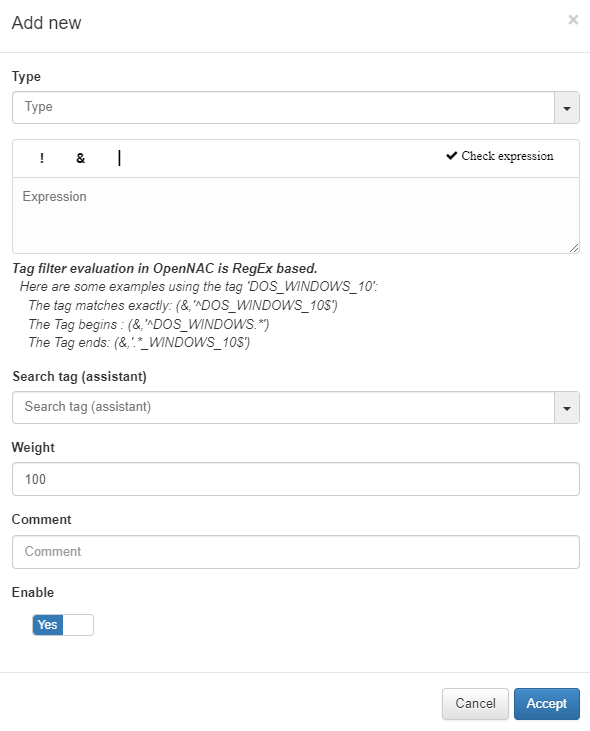
Type: The list with all the options that we have configured in the Column Types section. This field will indicate what type of condition it is and what it verifies.
Expression: Logical expression to be evaluated on each device. When this condition is executed within the rule, for these expressions we will use operators AND(&), OR(|), and NOT(!) and the operands will be those Tags that the devices should or should not have.
Search tag (assistant): We can use the tag search assistant to find those tags that we can use in the expressions. If we click on the found tags, they will be added automatically in the expression field.
Weight: This is the weight that this condition will have. At the time of evaluating them, if they coincide, said weight will be assigned to the overall score of the profiling rule. The greater the weight, the greater the importance of the condition.
Comment: To detail the behavior of this condition.
Enable: Flag to enable this condition.
As previously mentioned, another option is the creation of “Child” rules, which will be a subcategory of the rules that we have already created. They will help us to modify, add, or eliminate some extra parameters to that existing policy so it can accurately profile the discovered device.
Note
It is important to mention that the child rules will inherit all those conditions defined in their previously created parent rule.
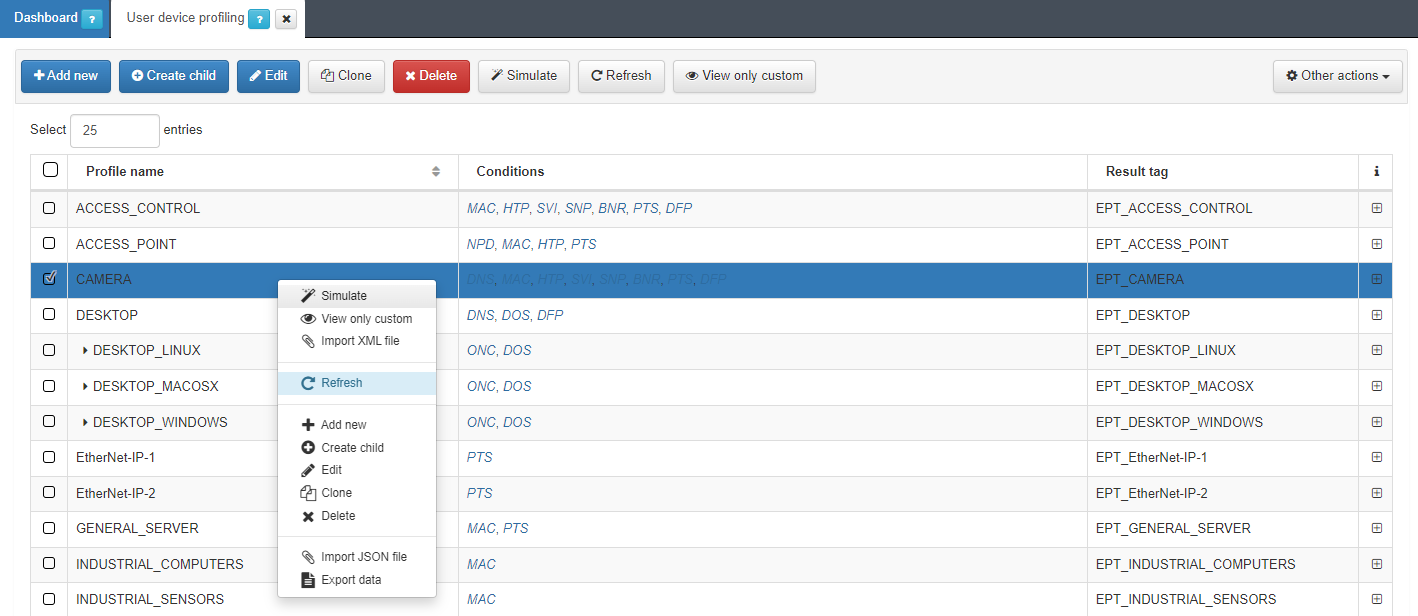
To create a Child policy, select a created policy and click on Create child
Child rules will inherit all the rules of their parent rule, but these can overwrite them to make them more specific and identify the child device.
For the conditions, we will click on Add new and configure the same parameters as when configuring a normal rule.
The user device profile allows us to create new expressions with the tag associated, in this example EPT_CAMERA. By adding a new UD tag policy, we can see the new tag with the Search tag (assistant). For more information, read ON NAC -> Tag policies -> UD Tag Policies.
Note
Administrators can perform a user device profiling simulation for any asset in OpenNAC Enterprise CMDB by right-clicking and selecting Simulate option.
4.1.5.7. Column Types
Column types define the parameter to evaluate before inserting a tag into the assets.
Each existing entry in Column types will correspond to a condition type entry available in ON NAC > Profiling > User device profiling.
The user can define a tag that evaluates some open ports or the MAC vendor and later based on the result insert a tag into the devices.
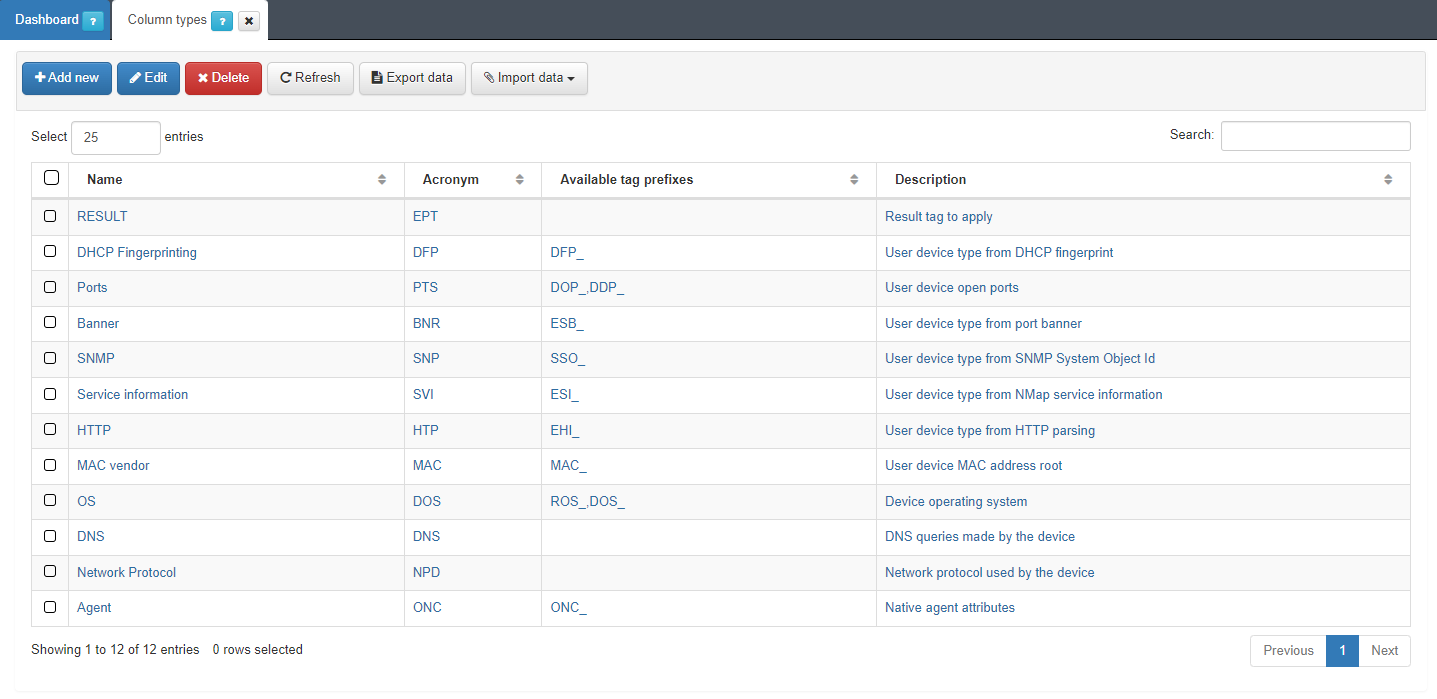
These Column Types do not add any logic to device profiling beyond the classification by condition type in the profiling rules.
To create a new parameter, click on Add new.
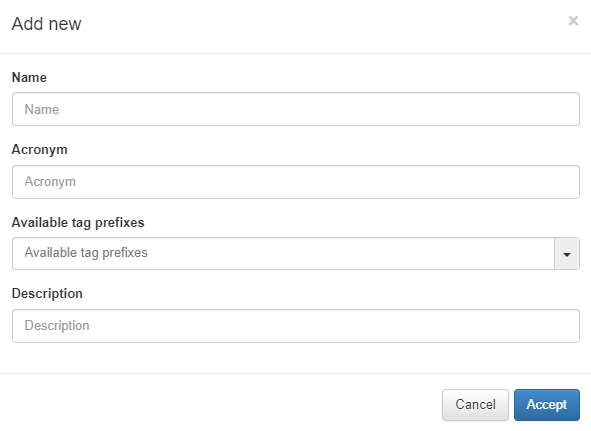
Name: Name of the new column type.
Acronym: Acronym used for this Column Type. It is recommended that it as descriptive as possible and refers to the name to avoid confusion. For example, DHCP fingerprint -> DFP.
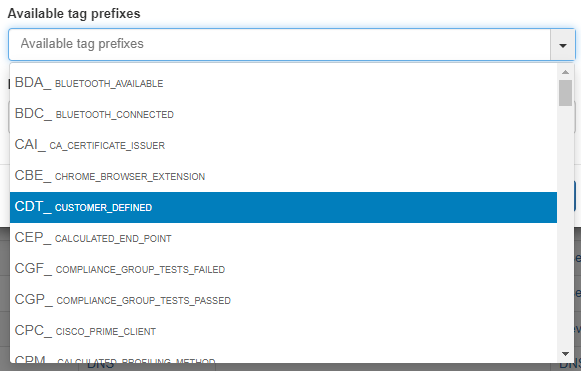
Available tag prefixes: Tags related to the type that is being defined. For example, in an operating system Column type, the Tags related to this could be ROS (Root operating System) and DOS (Device Operating System). This information is purely informative and does not imply any limitation when creating the profiling rules.
Description: description of the column type.
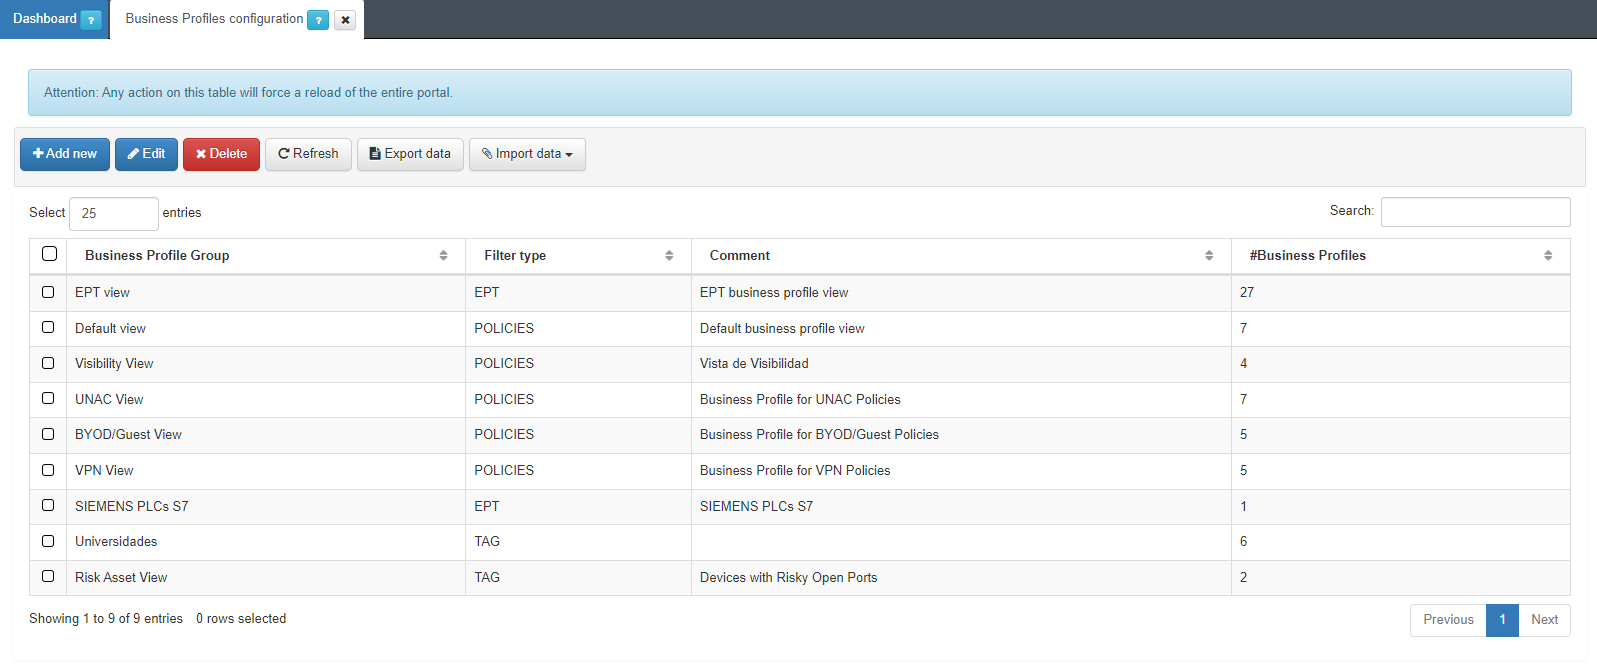
4.1.5.8. Create Business Profiles
It is possible to create new groups of Business Profiles to categorize our connections. It can be useful to create a group of Business Profiles for each company site.
To create a new group we must access ON NAC -> Business Profiles -> Business Profiles configuration:
Click on Add new to create a new group and a new window will appear:
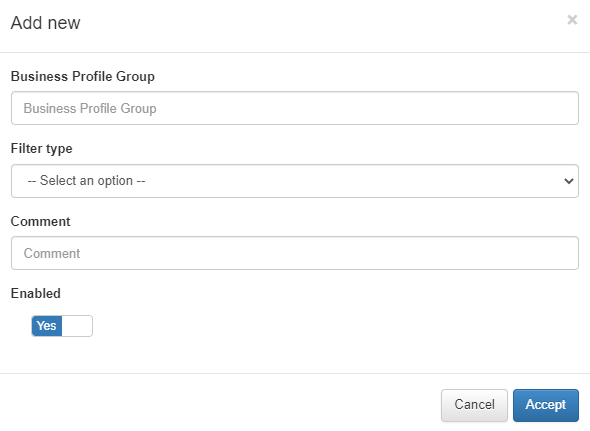
Business Profile Group: Name of the new Business Profiles group.
Filter Type: Type of Business Profile filtering, this can be “DEFAULT” which filters by NAC policies or “EPT” which filters by type of device according to the EPT tag.
Comment: Comment from the Business Profile group.
Enabled: We activate or deactivate the group.