4.1.6. Operation
This section will outline the views that, from a basic operational perspective, offer valuable insights into the visibility of our network.
Note
Before proceeding with the operation section, make sure you have completed the administration configurations to prepare the system for basic operations.
The main objectives of this section are:
Analyze the information contained in the Business Profiles.
Understand the information available in the solution’s dashboards.
Learn to filter the information within the dashboards
4.1.6.1. Initial Dashboard
When accessing the OpenNAC Web Administration Portal (installed on the ON Core component by default), the first thing that will appear will be the initial dashboard. This dashboard shows information about the devices of the last 30 days.
Note
The devices with MAC 00:00:00:00:00:00 are excluded on this tab.
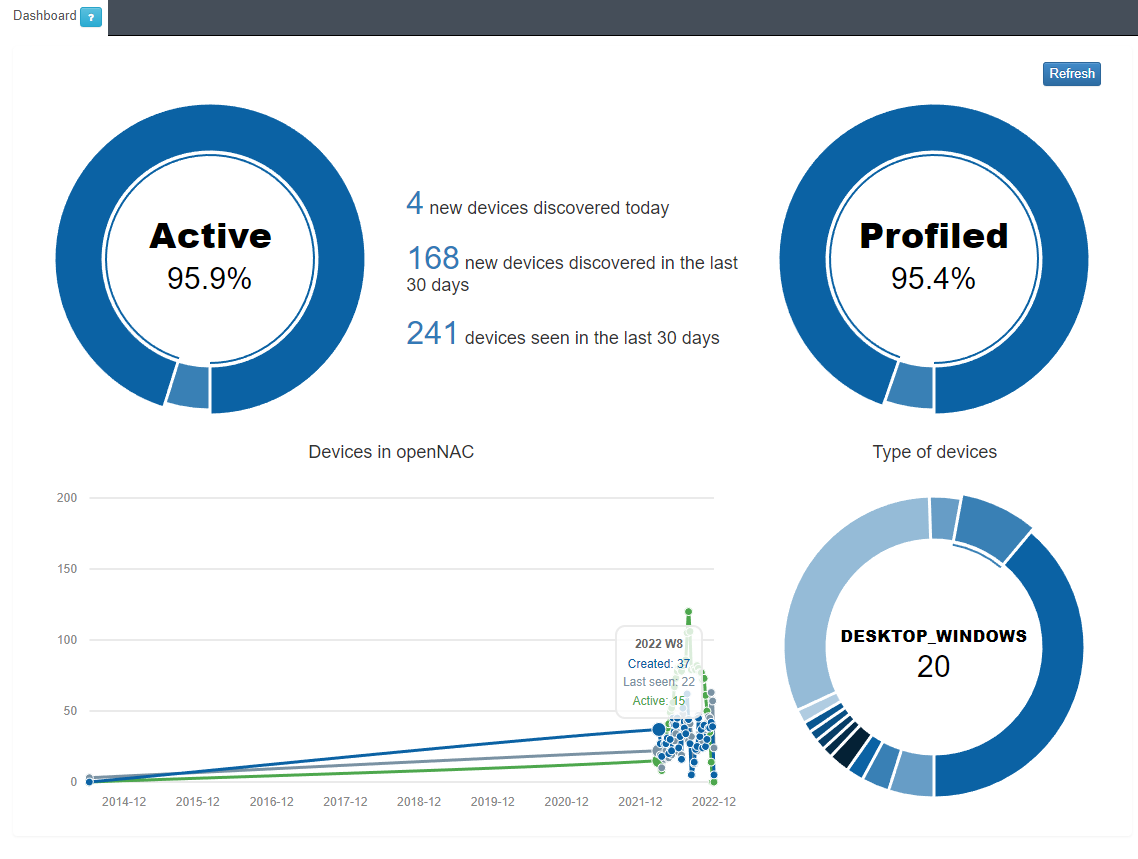
In this first dashboard, we can find basic but useful information, as detailed below.
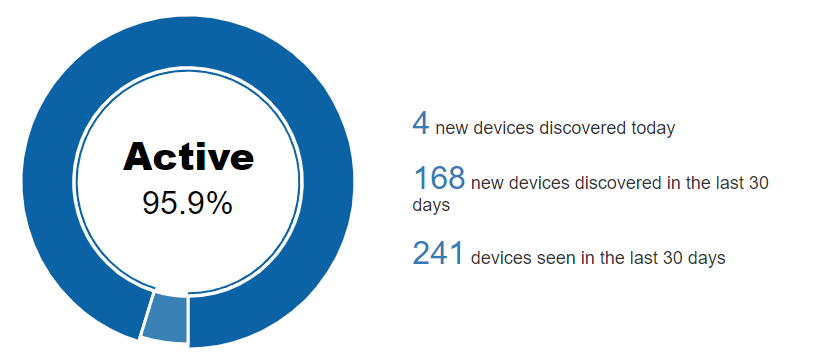
In the Active/Inactive pie chart, we can see the percentage of devices that are currently active on the network.
The central part of the dashboard shows 3 relevant numbers:
Total number of devices discovered in the last 24 hours.
Total number of devices discovered in the last 30 days.
Total number of devices seen in the last 30 days, we understand as a seen device any known device (previously discovered) that has connected to the network.
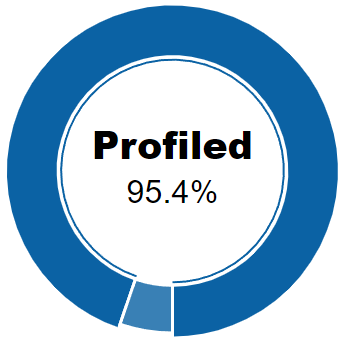
In the Profiled/Not profiled pie chart, we can see the percentage of total devices that have been profiled and those that have not. In other words, once discovered, the percentage of devices that could have their type determined and the percentage that could not.
Profiled information largely corresponds to the Visibility module.
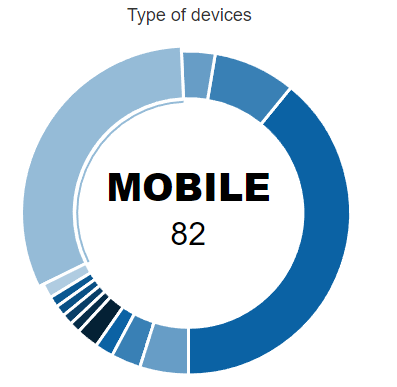
The last pie chart on the bottom right, shows the number of devices identified classifying them by their type. For example, in this case we have discovered and profiled 82 “MOBILE” devices on our network.
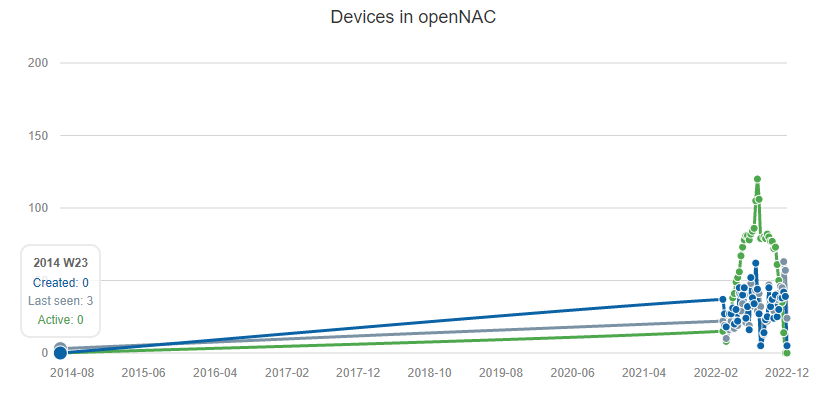
Finally, we have the line chart with 3 variables:
Created: Devices created/discovered during the week.
Last seen: Devices seen during the week.
Active: Active devices during the week.
4.1.6.2. Business Profiles
In Web Administration Portal, we can find the Business Profiles section (inside the ON NAC menu) where we will be able to see the latest status of the connections made on the network that have been detected by the system. For each of these connections we will have information related to the device and the connection itself: status, source, policy, etc.
4.1.6.2.1. Default View
The Default View window can display several Profiles, where each one of them can group the connection states depending on the Policy in which they have entered.
Note
You can create as many Business Profiles as you need; there is no limit.
These groups are created to structure and organize these connections in environments where there may be a large number of devices and connections, thus facilitating the queries in this section.
To access the Default View navigate to ON NAC > Business Profiles > Default View.
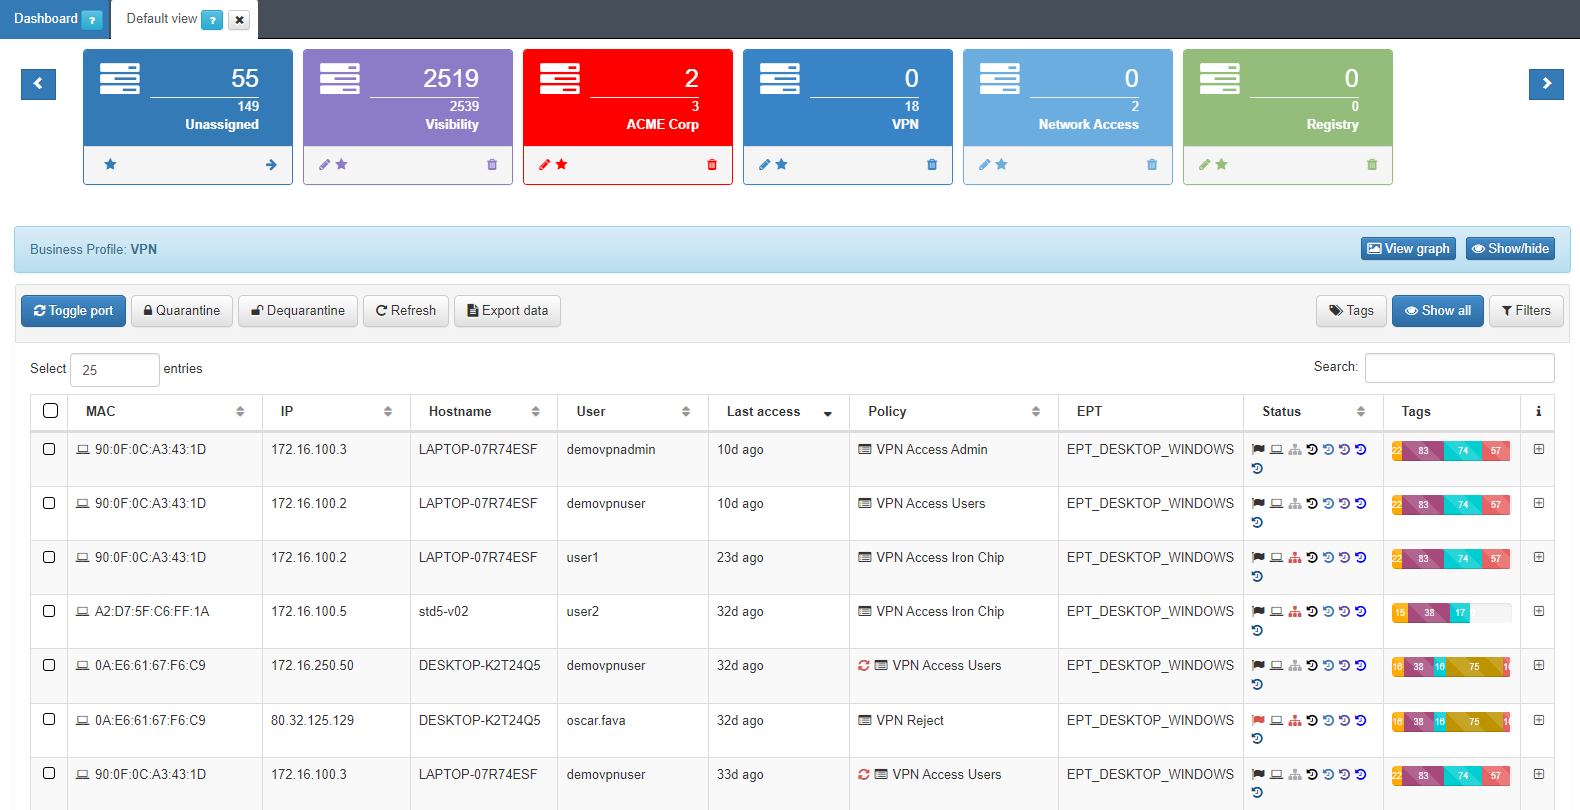
MAC: MAC address of the device.
IP: IP assigned to the device.
IP Switch: IP of the switch to which the device has been connected.
Hostname: Hostname of the device in case it is discovered.
User: User with which the device authenticates.
Last Access: Time elapsed since the last event related to the user.
Policy: Policy with which the device has matched.
VLAN: Vlan that has been assigned to the device. The VLANs must be previously defined in the system since it does not perform an active discovery of VLANs.
Source: Connection source type (802.1x, Visibility, VPN, etc.)
EPT: Tag* referring to the type of device (End Point Type).
Status: Status of the connection (Active/Disconnected, vlan assigned, etc.).
Tags: Numerical representation of the Tags* assigned to the device.
Tip
Learn all operational capabilities of this view within the Business profiles Overview section.
Expand the information of each connection by clicking on +, located at the right end of each connection row:
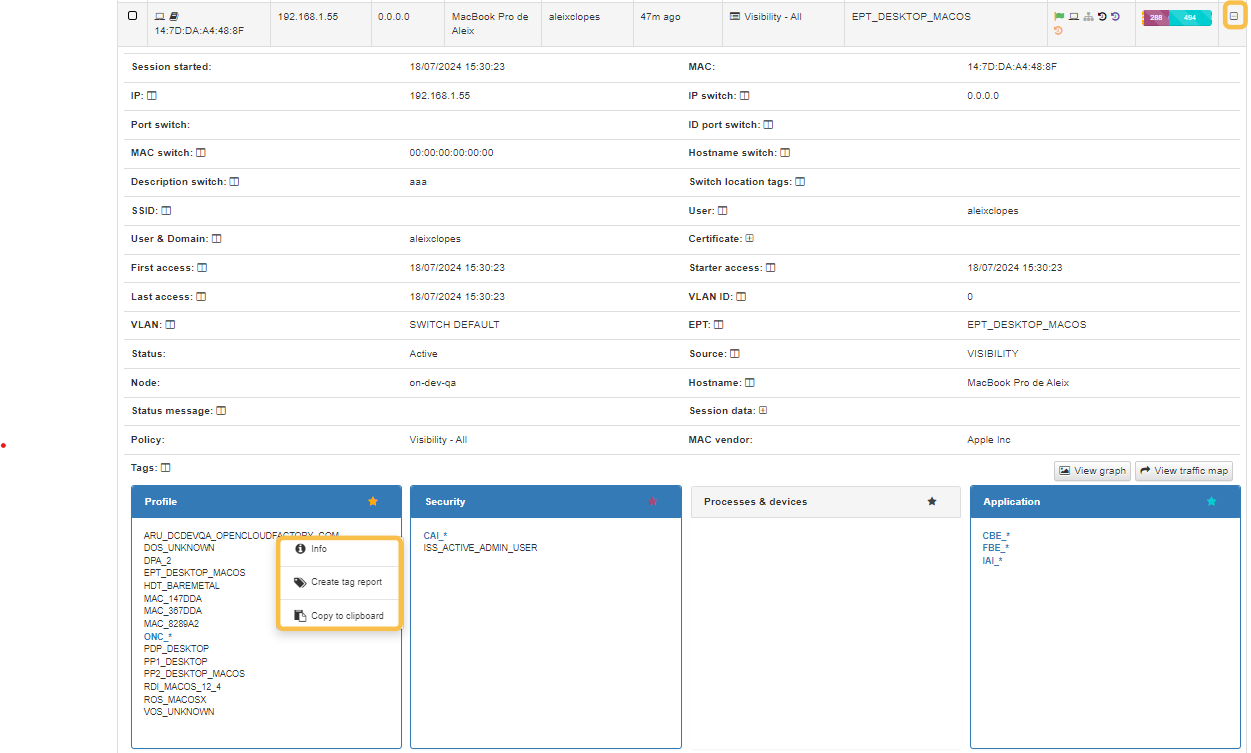
This expanded drop-down includes all relevant information about the devices and the established connections, obtained using the different Visibility methods (802.1x, plugins, agent, etc.)
The upper section presents essential details of the connection, such as MAC address, hostname, user, policy, and connection source.
The lower section showcases the TAGs, which are labels assigned to devices that provide us with additional information. These tags are categorized by families, represented by three letters at the beginning of the tag, followed by an underscore and the specific characteristic. For instance, the tag “ROS_WINDOWS” stands for Root Operating System of the Windows type.
Refer to the Tags Table for a complete list of Tags prefixes and their description.
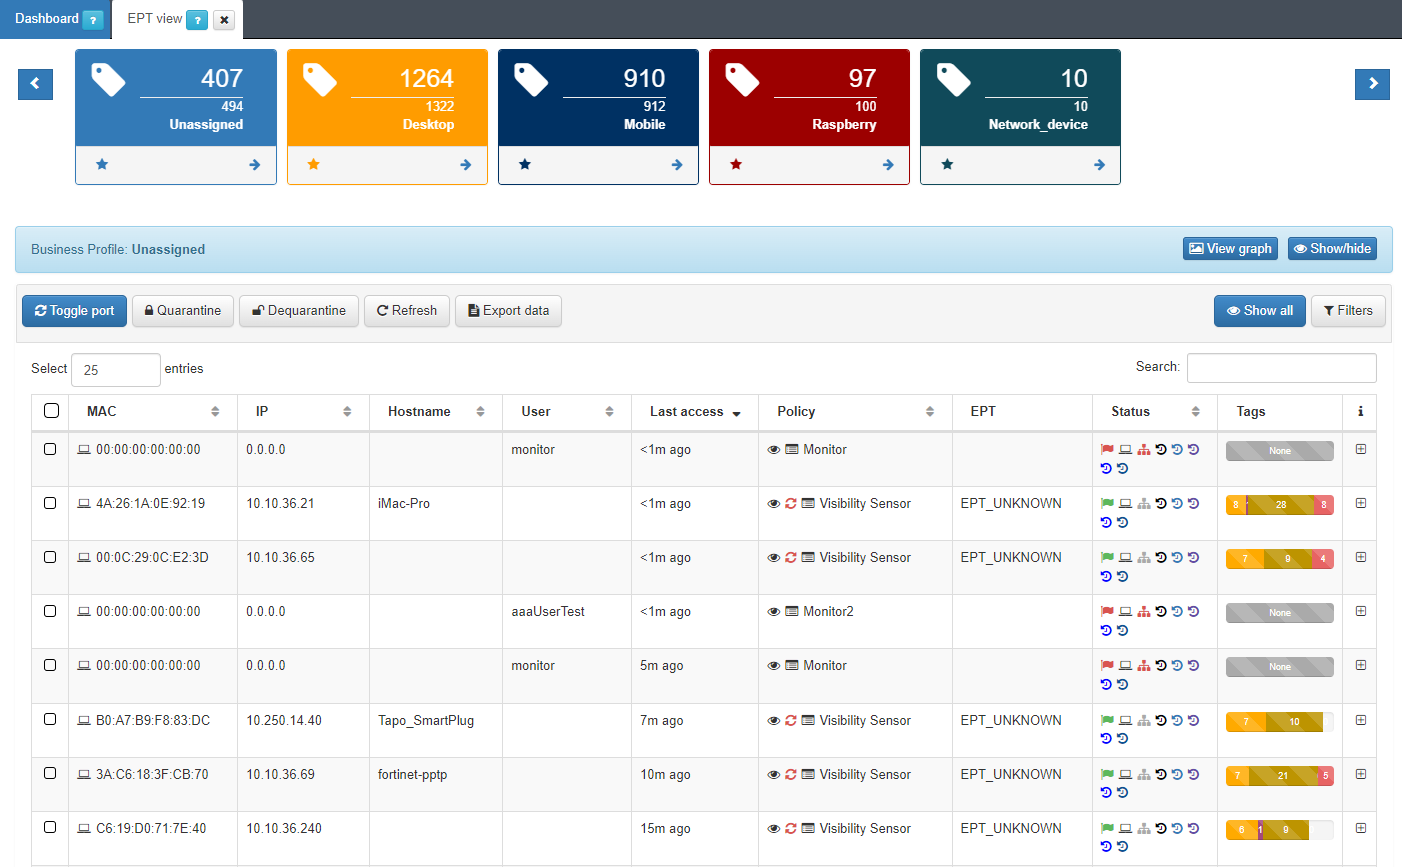
4.1.6.2.2. EPT View
In the Business Profiles section, we can also see another profile that shows us a group of devices classified by the EPT label, End Point Type. By default, we have the “EPT View” profile.
The system has the ability to assign a profile to a device that has been discovered on the network, this is possible thanks to a set of predefined profiling rules. New profiling rules can be added or existing ones modified according to the requirements that each client decides to define.
After executing these profiling rules, the EPT_<Device Type> tag is inserted into the discovered device.
To access the Business Profiles of EPT View we must go to ON NAC -> Business Profiles -> EPT View
4.1.6.3. CMDB - User Devices
Navigate to ON CMDB > User Devices to access the ON Core database, which stores information related to the system, infrastructure, networks, VLANs, security profiles, user devices, network devices, and more.
In this section, you’ll find all the ‘User Devices’ that have accessed the network. This list includes all devices that have ever connected to the network and been discovered by the system.
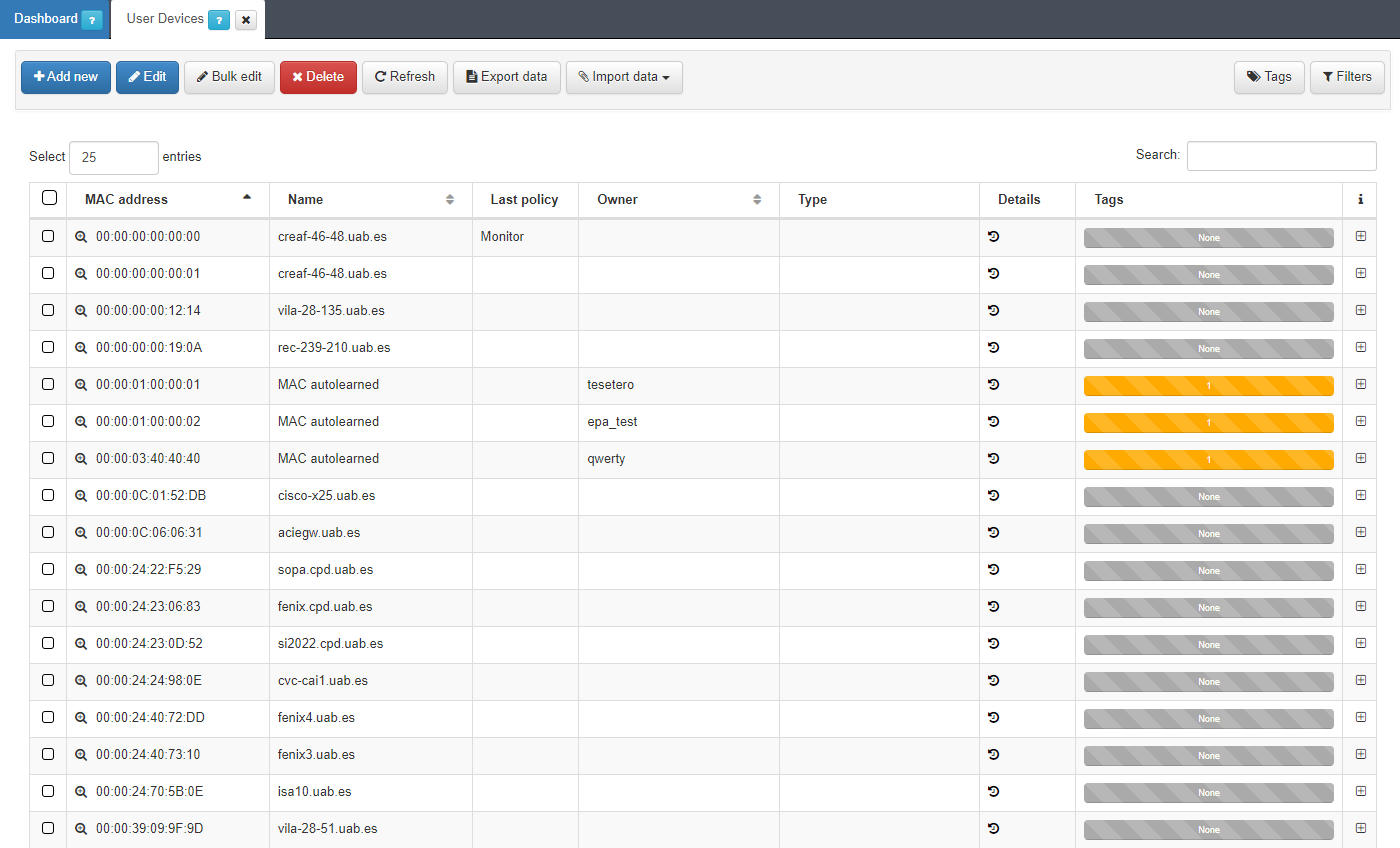
Expand the information for each user device by clicking the + icon at the right end of the device row.
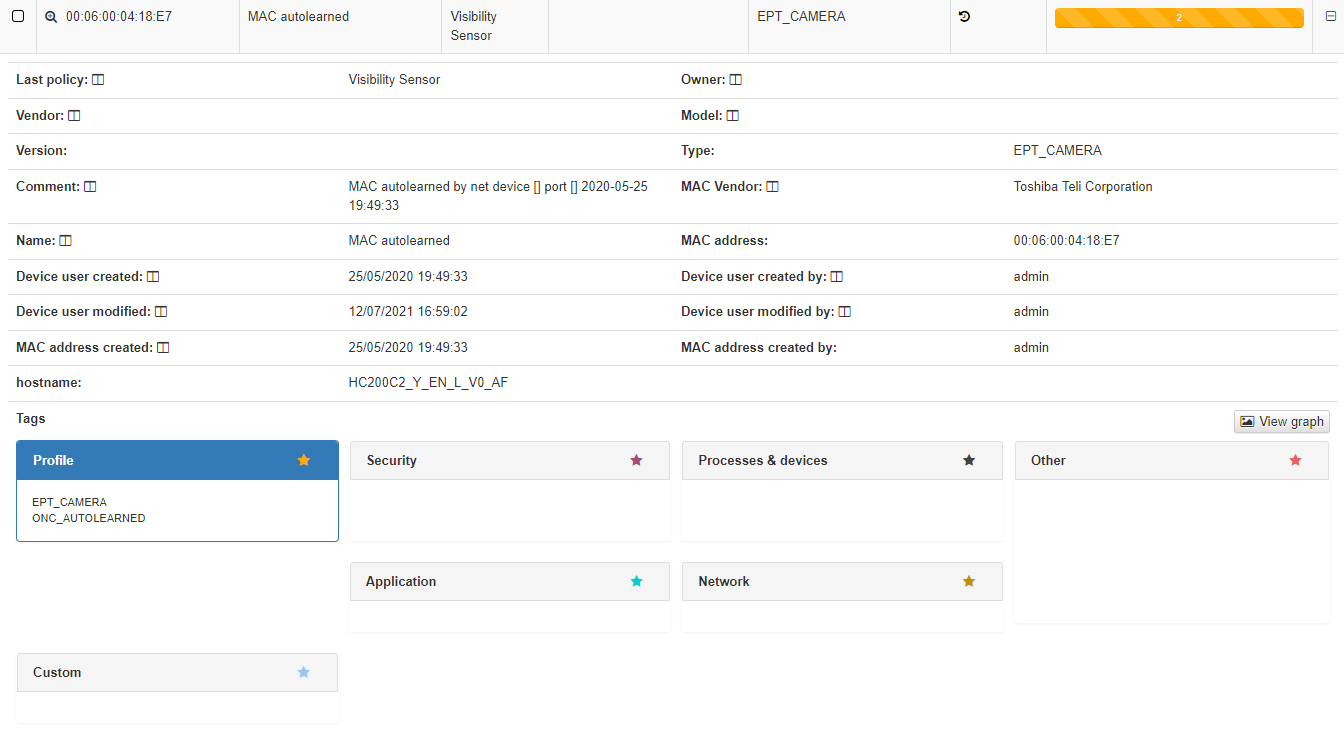
In the dropdown displaying device information, you can view basic details such as MAC address, device type, creation date, hostname, and more. This information is similar to what is available in Business Profiles, but in this case, it only includes details about the device itself, without displaying the connection status. At the bottom, you will find categorized groups showing all the Tags assigned to the device.
4.1.6.5. Dashboards
Dashboards are generated based on the network visibility information collected by the system, presenting the data in an easily readable and interpretable format for the user. Due to the large volume of data from various sources, different dashboards have been created to group the information using graphs and tables.
Each dashboard includes filters that allow users to specify which parameters should be displayed and the time period for generating the dashboards. It’s important to note that if a specific device hasn’t provided an update within the specified time period, it will not be included in certain events or displays.
The Analytics section includes dashboards organized by use cases. The following topics will give you an overview of all sections and the information collected within them. Navigate to the Administration Portal > Analytics section for more information about managing dashboards, filtering data and customizing your views.
4.1.6.5.1. Visibility
The Visibility section presents a range of dashboards arranged from general to specific, allowing for a drill-down approach. This means you can start with a broad view and then dive into more detailed information as needed.
Visibility Overview: Provides an overview of all the user devices connected to the network.
CMDB Metrics: Displays CMDB objects metrics.
Network Behavior: Displays all the information captured from the ON Sensor that is stored in the index of “bro-”.
Profiling metrics: Presents device tag metrics to enhance device profiling capabilities.
Profiles per VLAN: Dashboard that show the relationship between EPT and VLANs.
4.1.6.5.2. UNAC
The UNAC section presents a range of dashboards arranged from general to specific, allowing for a drill-down approach. This means you can start with a broad view and then dive into more detailed information as needed.
UNAC Overview: Allows visualizing the authentication features of user devices connected to the network, including information about the location of the devices and the policies associated with them.
UNAC Detail: Provides detailed information about User Devices.
Authentication Methods: Displays information about RADIUS requests.
4.1.6.5.3. Segmentation
The Segmentation section presents a range of dashboards arranged from general to specific, allowing for a drill-down approach. This means you can start with a broad view and then dive into more detailed information as needed.
Segmentation Overview: Overview of the events related to segmentation use case.
Segmentation Metrics: Displays information about RADIUS requests
4.1.6.5.4. UDC
The UDC (User Device Compliance) section presents a range of dashboards arranged from general to specific, allowing for a drill-down approach. This means you can start with a broad view and then dive into more detailed information as needed.
UDC Overview: Overview of the events related to User Device Compliance.
UDC Metrics: Displays various metrics and statistics related to UDC.
UDC Agent Metrics: Displays various metrics and statistics related to Agent events.
:ref:` EPT Changes<ept_changes>`: Displays information and records related to changes in Endpoint types.
4.1.6.5.5. NDC
The NDC (Network Device Compliance) section presents a range of dashboards arranged from general to specific, allowing for a drill-down approach. This means you can start with a broad view and then dive into more detailed information as needed.
NDC Overview: Overview of the events related to Network Device Compliance.
NDC Details: Displays detailed information about Network Devices.
NDC Metrics: Displays various metrics and statistics related to NDC.
4.1.6.5.6. 2SRA
The 2SRA (Secure Remote Access) section presents a range of dashboards arranged from general to specific, allowing for a drill-down approach. This means you can start with a broad view and then dive into more detailed information as needed.
2SRA Overview: Overview of the events related to the 2SRA use case.
2SRA Metrics: Displays various metrics and statistics related to the 2SRA use case.
VPNGW: Displays displays VPN connections and their features.
Third Party VPN: Displays all events related to the Third Party VPN Use case.
4.1.6.5.7. Guest/BYOD
The Guest/BYOD (Bring Your Own Device) section presents a range of dashboards arranged from general to specific, allowing for a drill-down approach. This means you can start with a broad view and then dive into more detailed information as needed.
Guest/BYOD Mngt Overview: Overview of the events related to the Guest/BYOD use case.
Guest/BYOD Mngt Metrics: Displays various metrics and statistics related to the Guest/BYOD use case.
4.1.6.5.8. Log Aggregation
The Log Aggregation section features a Network Devices Syslog dashboard, providing information on syslog types, and events.
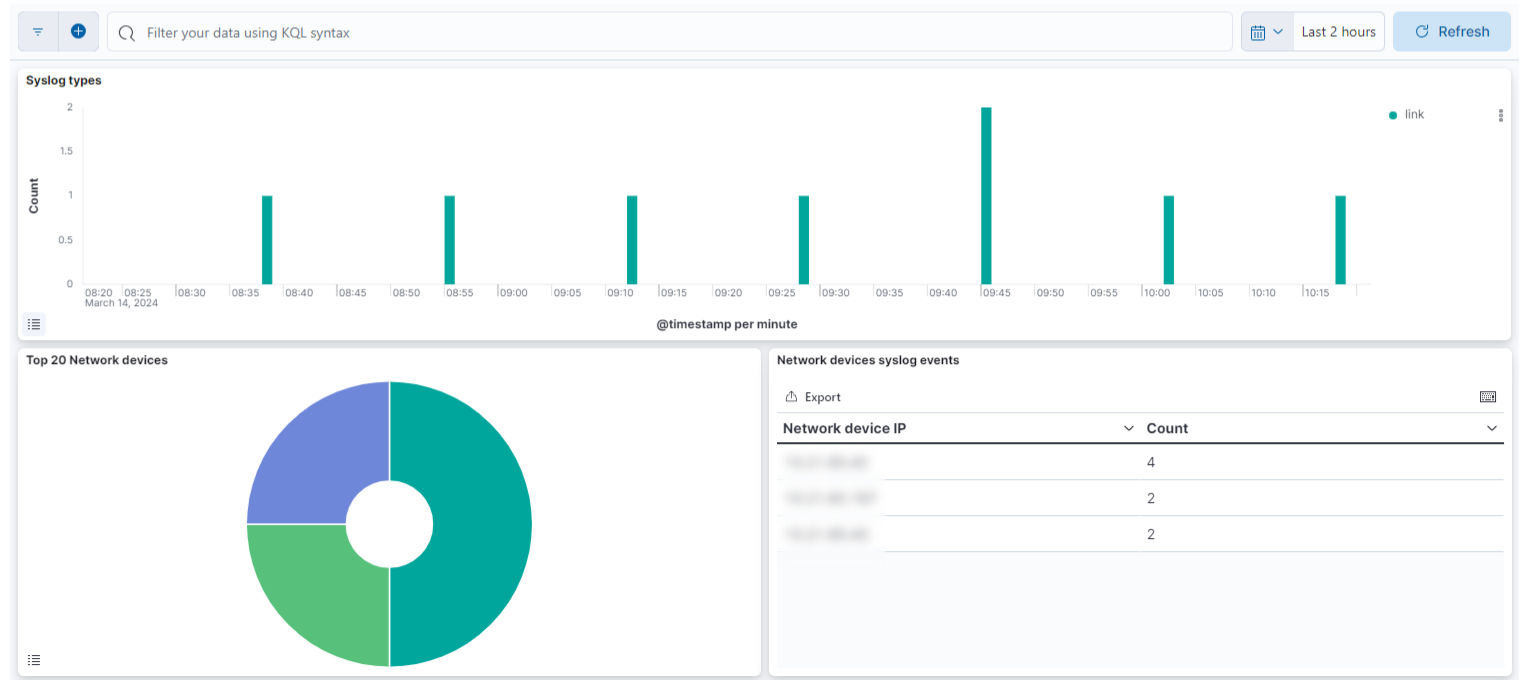
Syslog types: Displays the different syslog types resulting from various log events.
Top 20 Network devices: Features a list of the top 20 network devices currently connected to the network.
Network devices syslog events: Displays a log of events generated by network devices via the syslog protocol.
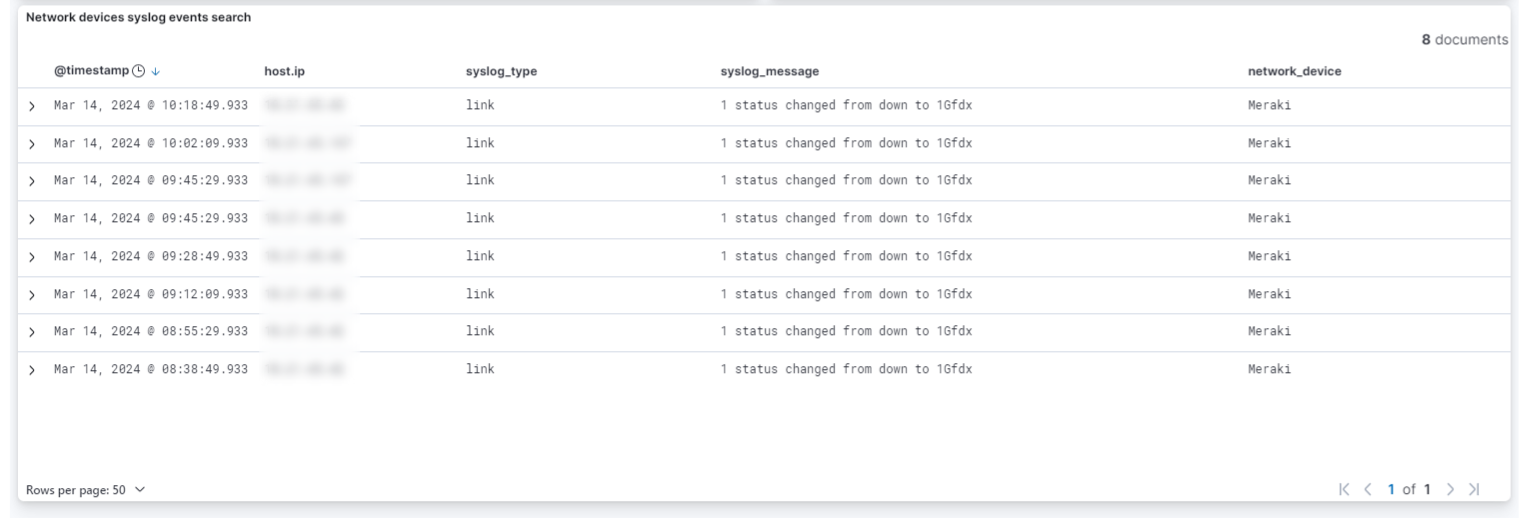
Network devices syslog events search: Allows searching and filtering network devices syslog events.
4.1.6.5.9. Custom Dashboards
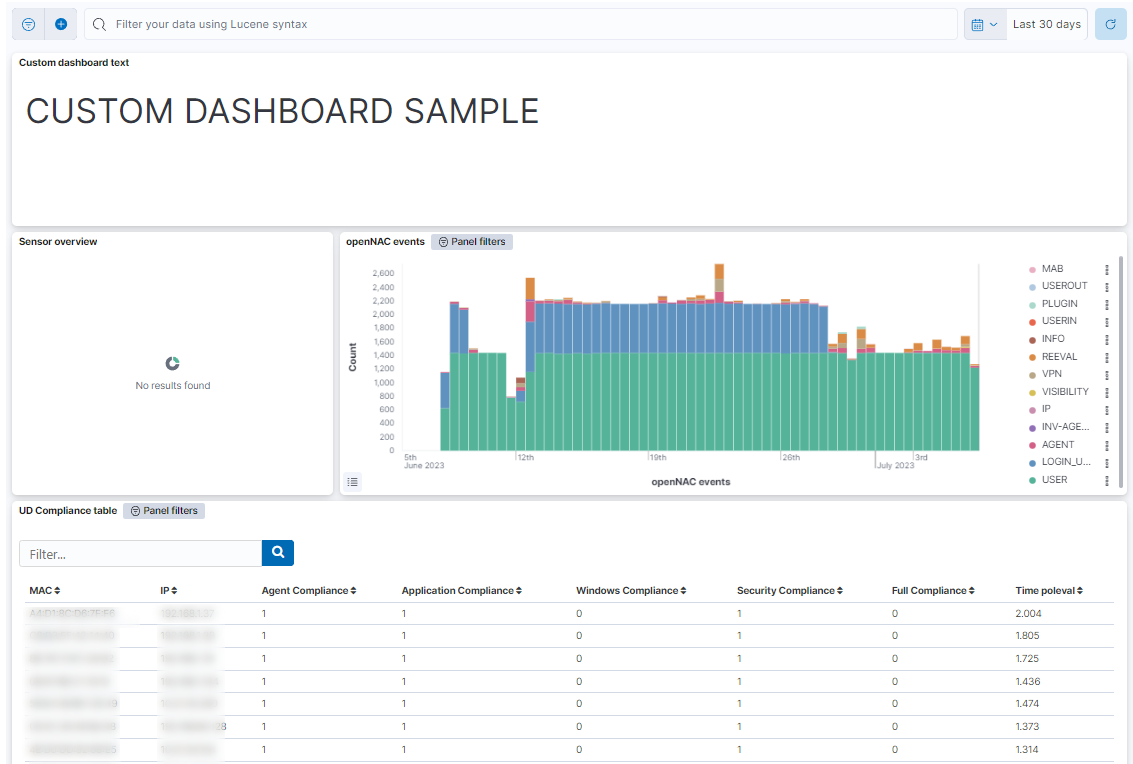
From the Configuration > Dashboards section, you can create Custom Dashboards. While creating a dashboard you can define the path to render your dashboard in the Analytics menu.
For more information on how to create a customized dashboard that will suit your particular needs, see the Configuration > Dashboards section.
Here, you can see an example of a Custom Dashboard Sample that displays a text field, Sensor overview, openNAC events, and UD compliance table:
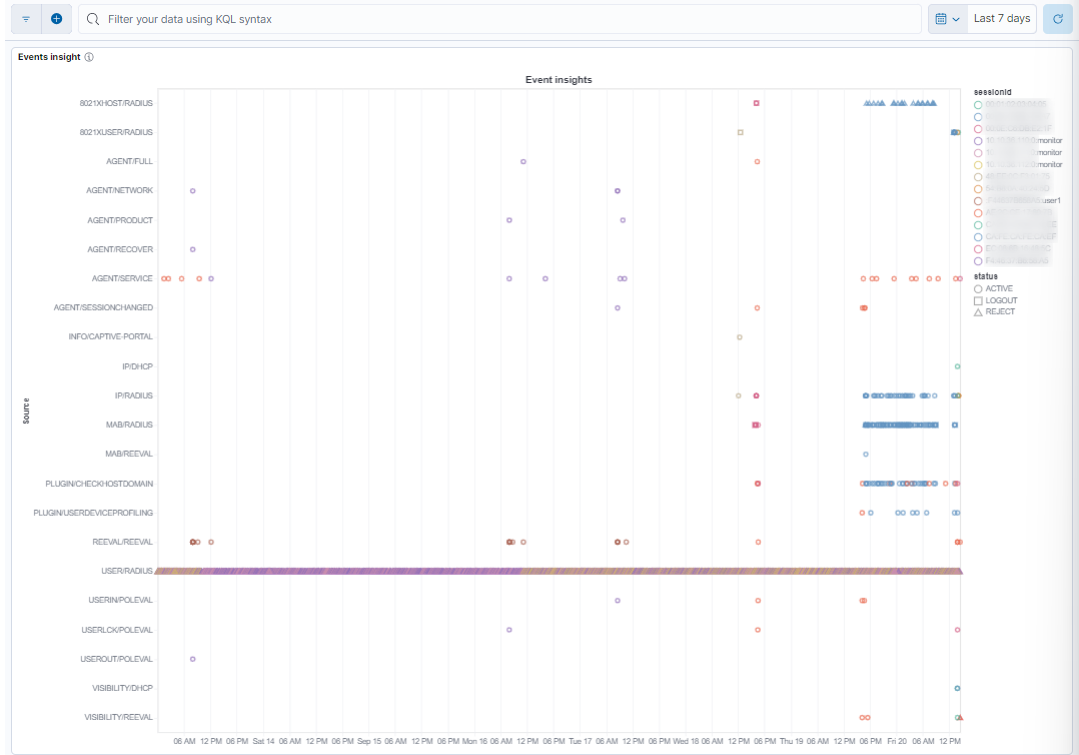
4.1.6.6. Raw data insights
This visualization shows events over time, differentiated by source/module and session, with detailed information (hostname, IP address, MAC address, evaluation time, number of tags, and network device tags associated with each event) in tooltips.
4.1.6.6.1. Time period filtering
To quickly filter, we can select the calendar icon. This will open a dropdown menu where we can configure the time period of the dashboard.
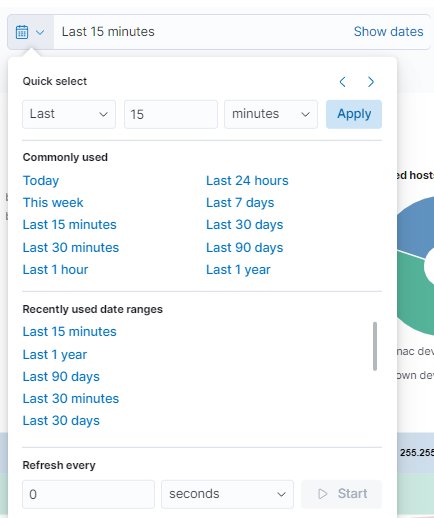
In the first section (Quick select), we can quickly select a time period from the current moment to where it is configured. For example, the last 15 minutes, hours, days, etc.
In the next section (Commonly used), we can select time periods that are frequently used and that are already configured.
In the (Recently used date ranges) section, also using time periods already configured, it will filter the ones we used recently.
The last section corresponds to the refresh rate of the graph (by default disabled). With this, the graph is updated periodically when pressing Start.
If we want to further customize the time period of the graph, we can select each of the times (start and end) in which we can select the exact point.
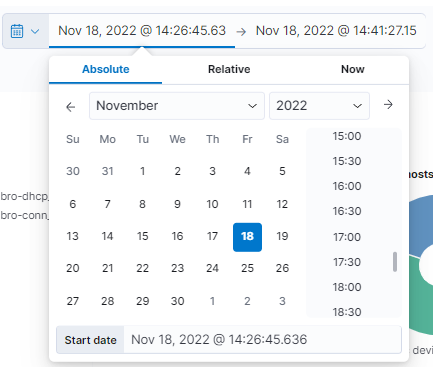
If we select the Absolute type, we will be asked for an exact calendar date. On the other hand, when selecting Relative, we must indicate a period of time from the current moment. If we select Now means that on every refresh the current time will be set to the time of the refresh.
It is important to take into account the rotation of the data. If the data rotation is defined in one month we will only be able to obtain information up to one month before the current moment.