3.1.12.3.6. Profiling Metrics
The Profiling Metrics dashboard presents device tag metrics to enhance device profiling capabilities.
We can see the following views on this dashboard, starting from the header:
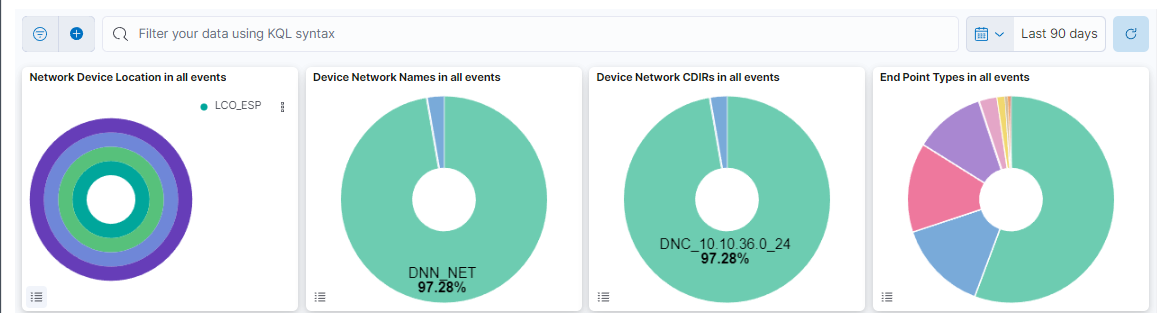
This header composed of four dashboards allows filtering by Network Device Location, Device Network Name, Device Network CDIRs, Endpoint Types. It will always look for the temporary index that is regenerated every day. In this toolbar, filter your data using KQL syntax.
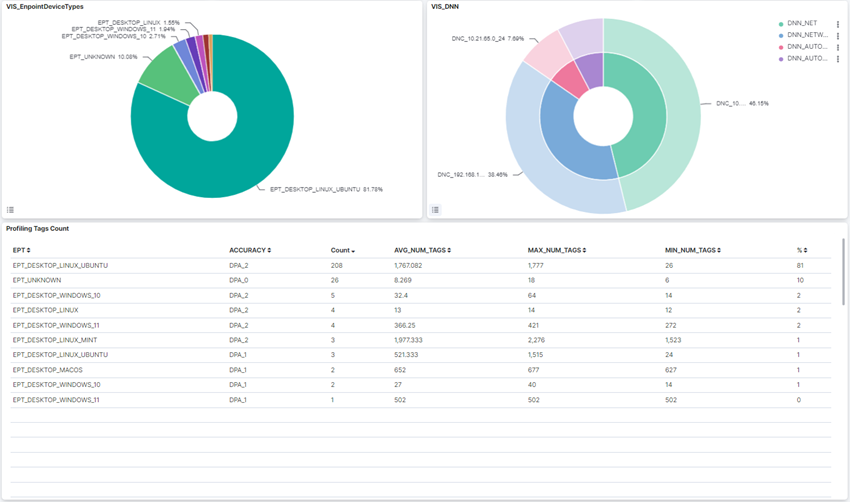
End Point distribution: A pie chart that displays the percentage of each EPT.
Profiling tags stats: A table that shows statistics based on EPT: tag, accuracy (TAG DPA), total, percentage, minimum number of tags, average, and a maximum of TAGs.
MAC vendor per End Point Type:
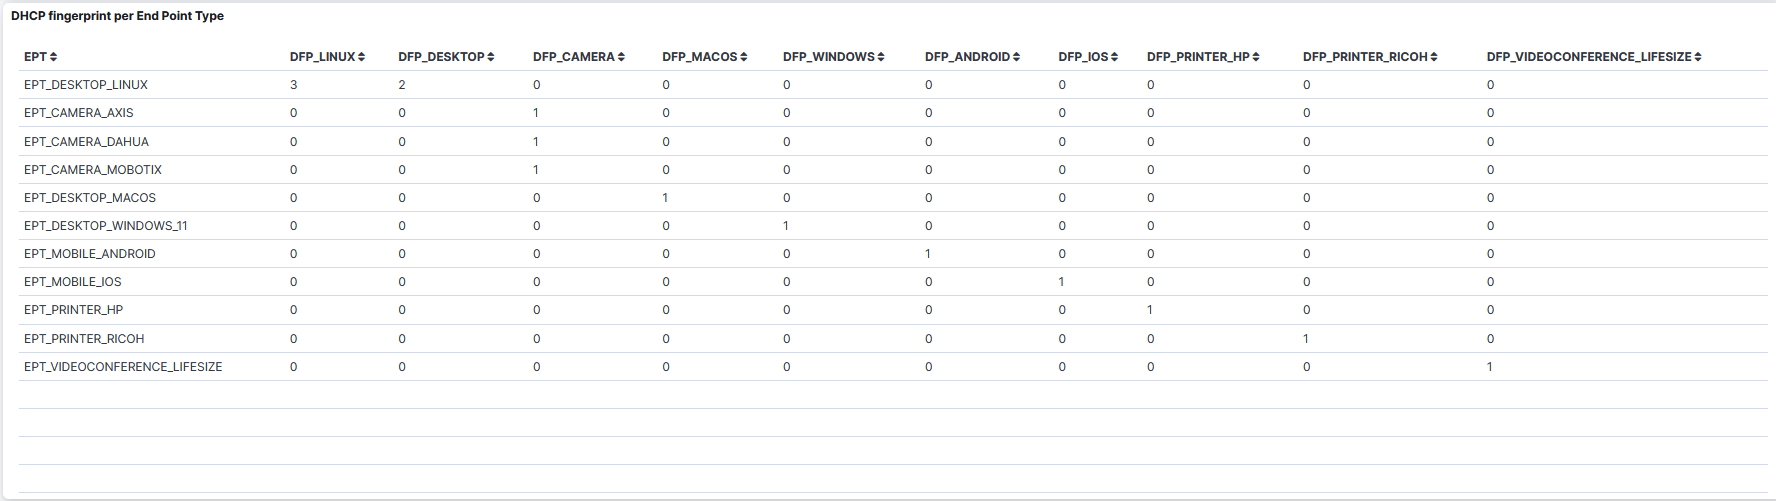
DHCP fingerprint per Endpoint Type:
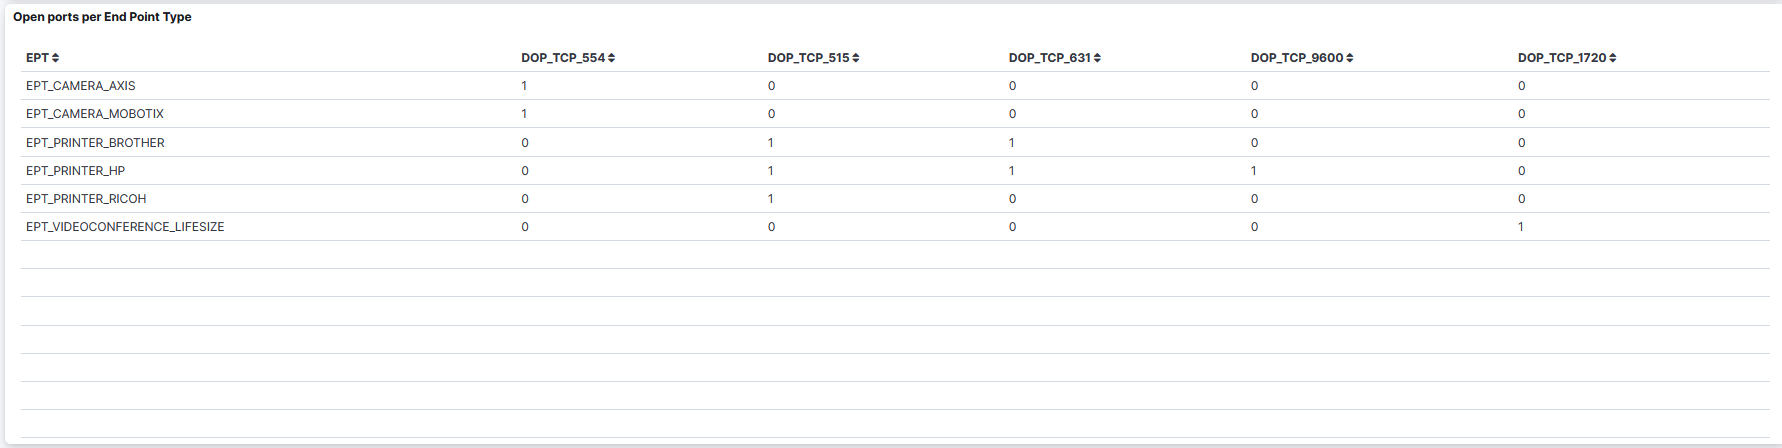
Open ports per End Point Type:
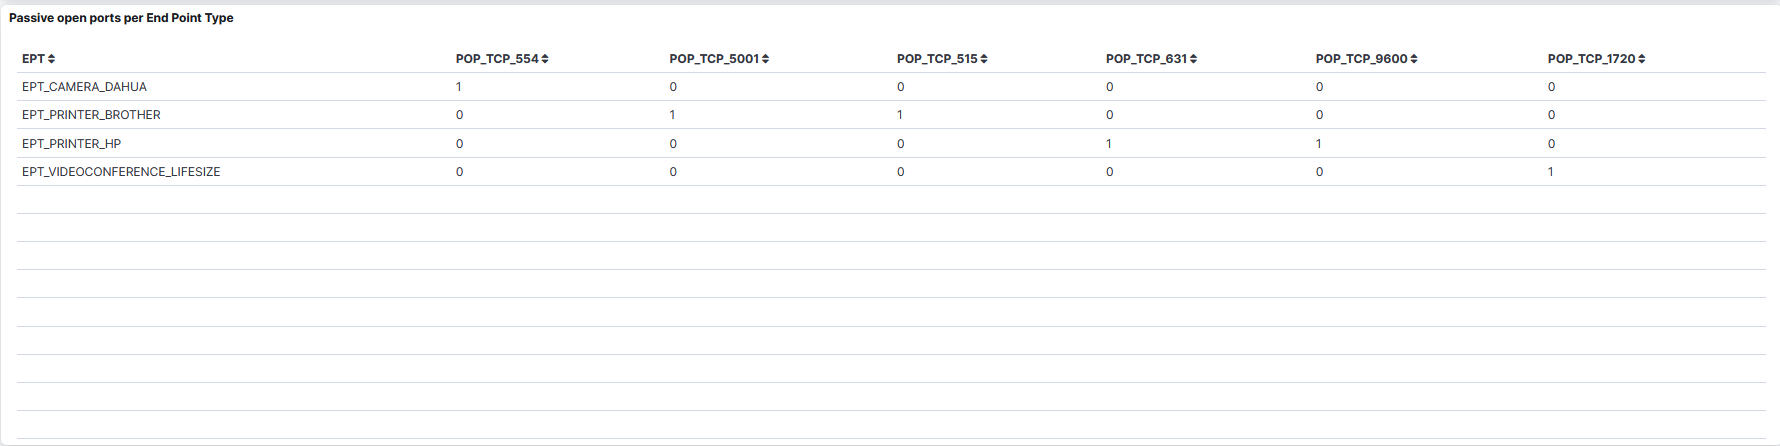
Passive Open ports per End point Type:
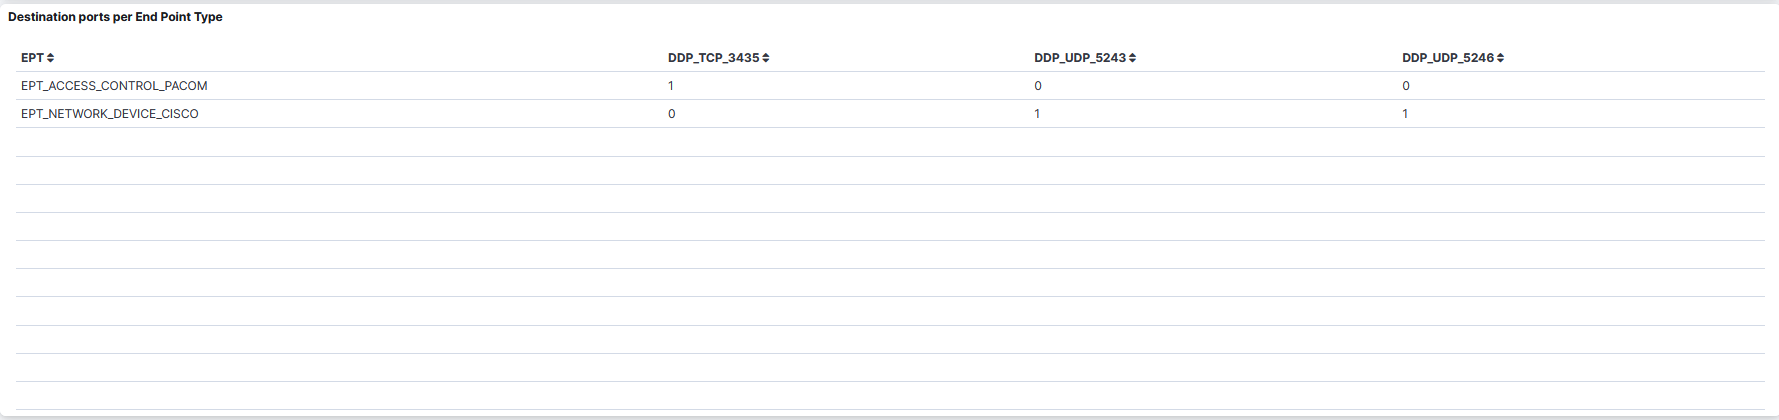
Destination ports per End Point Type:
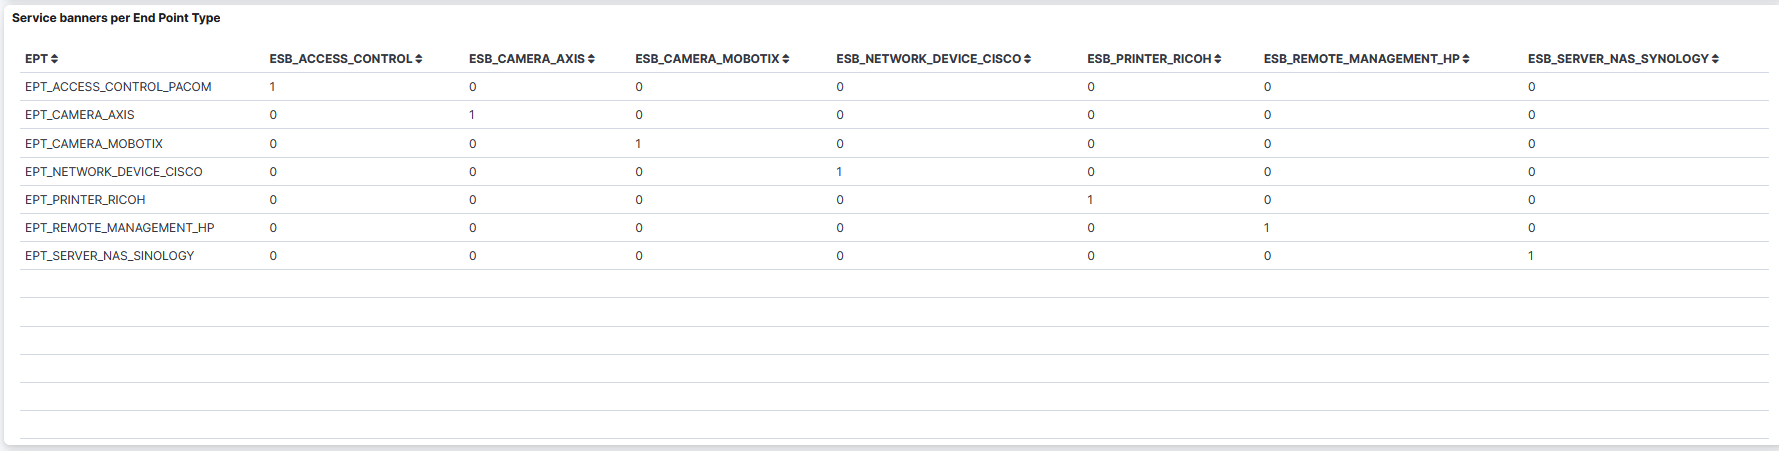
Service banners per End Point Type:
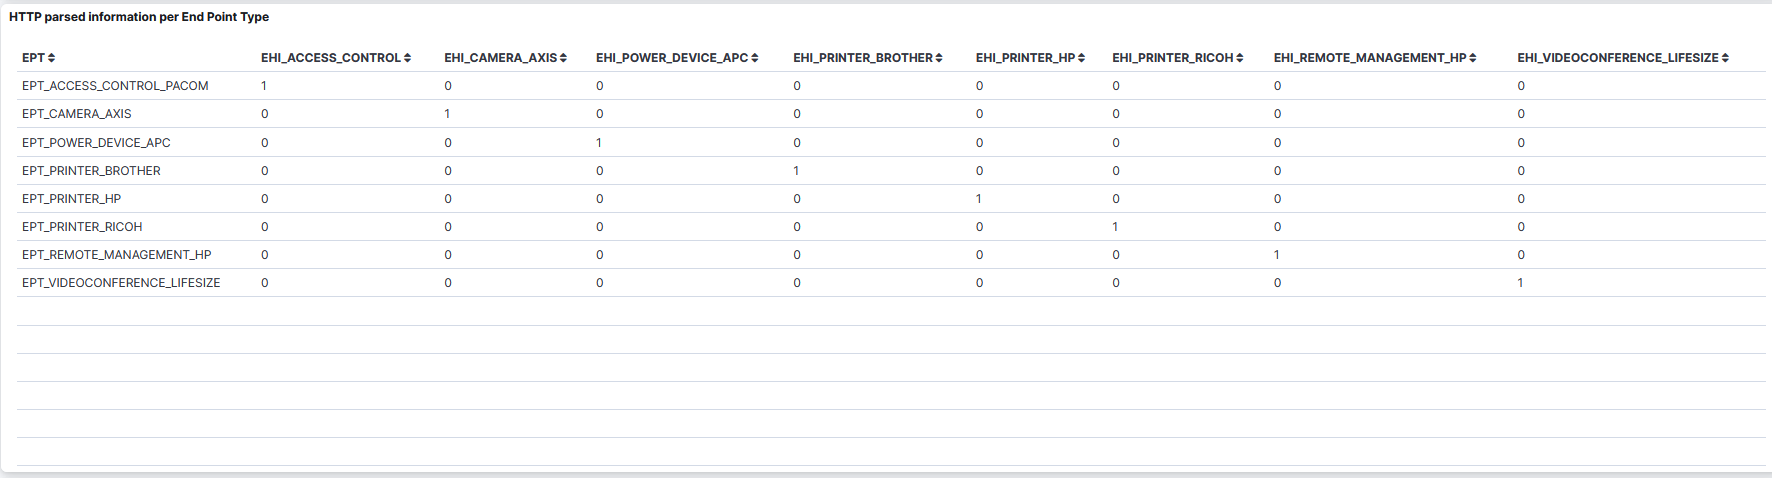
HTTP parsed information per End Point Type:
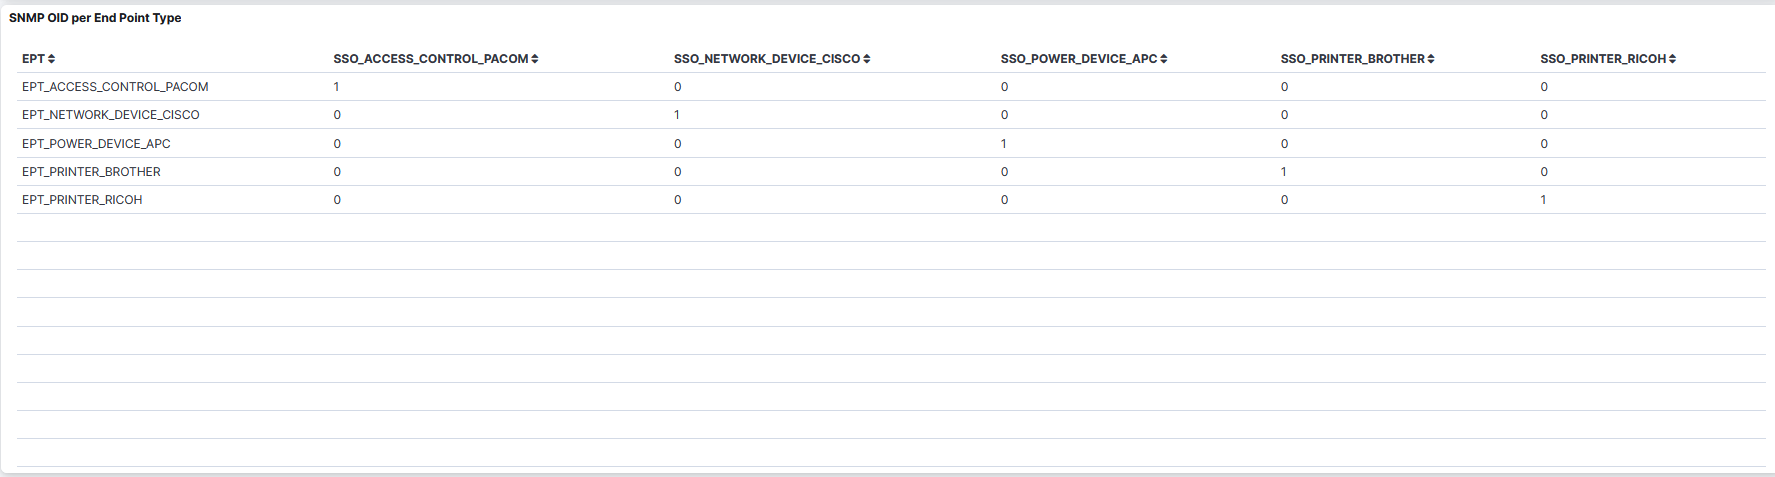
SNMP OID per End Point Type:

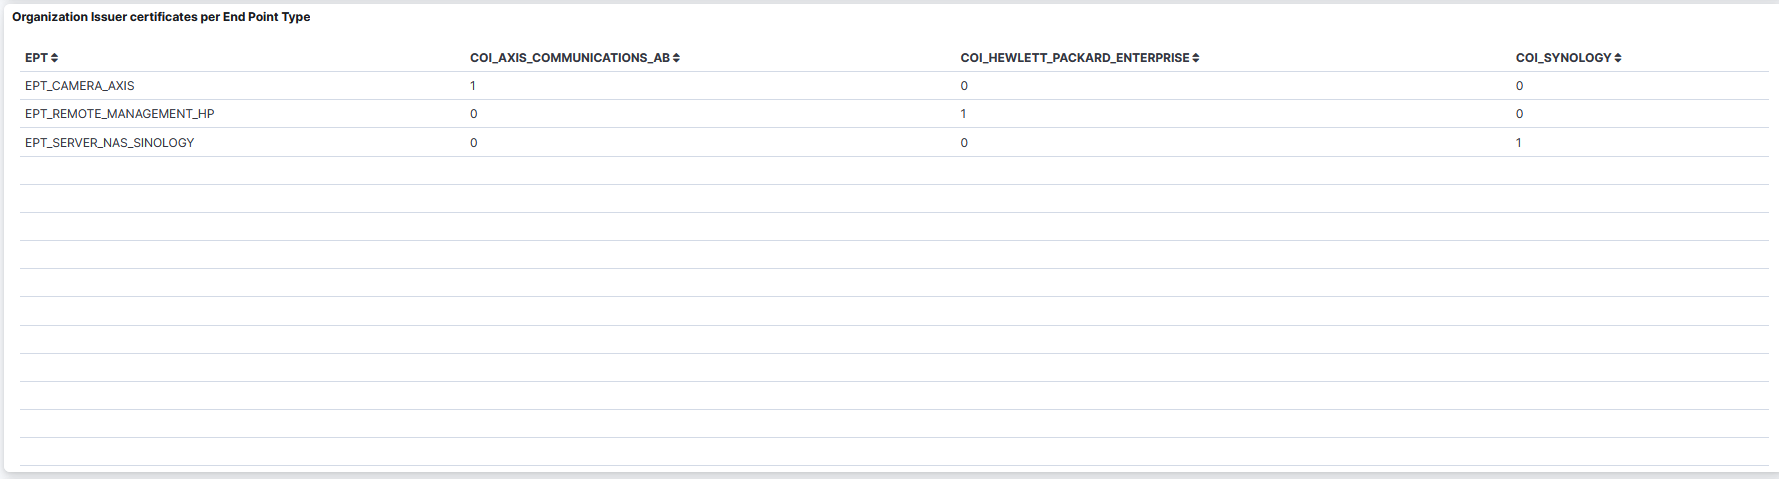
Organization Issuer certificates per End Pint Type:
Common Name Subject certificates per End Point Type:
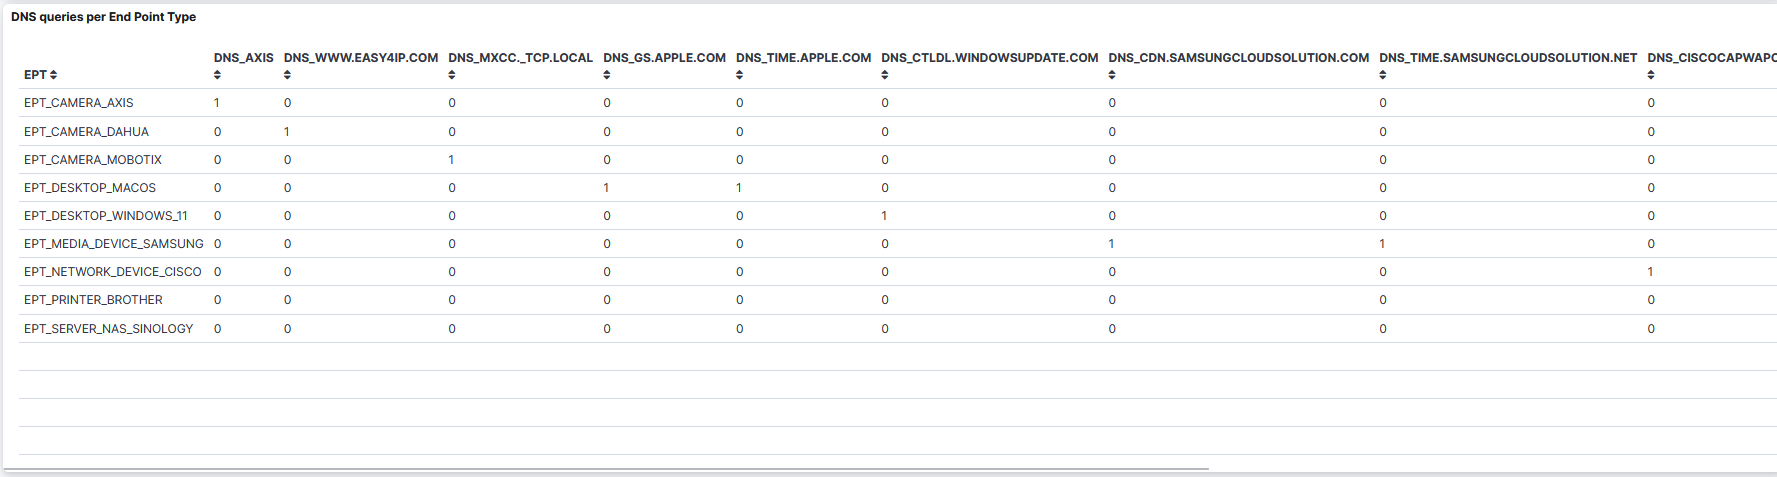
DNS queries per End Point Type:
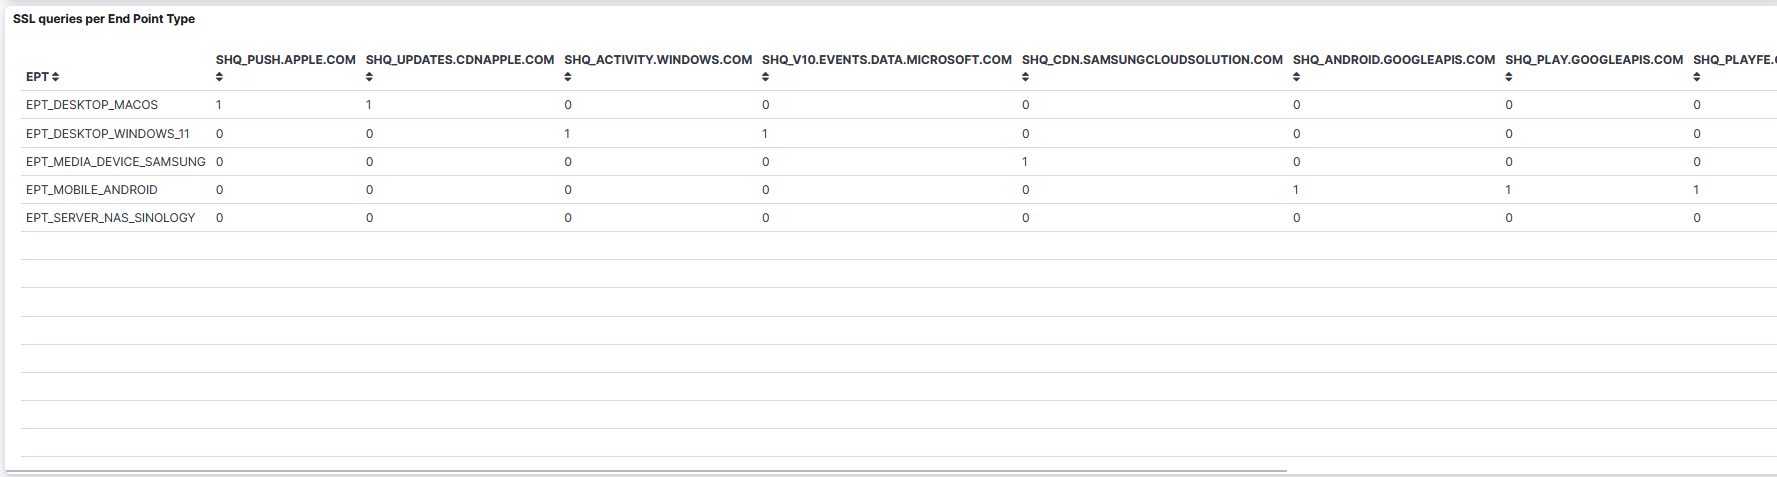
SSL queries per End Point Type:
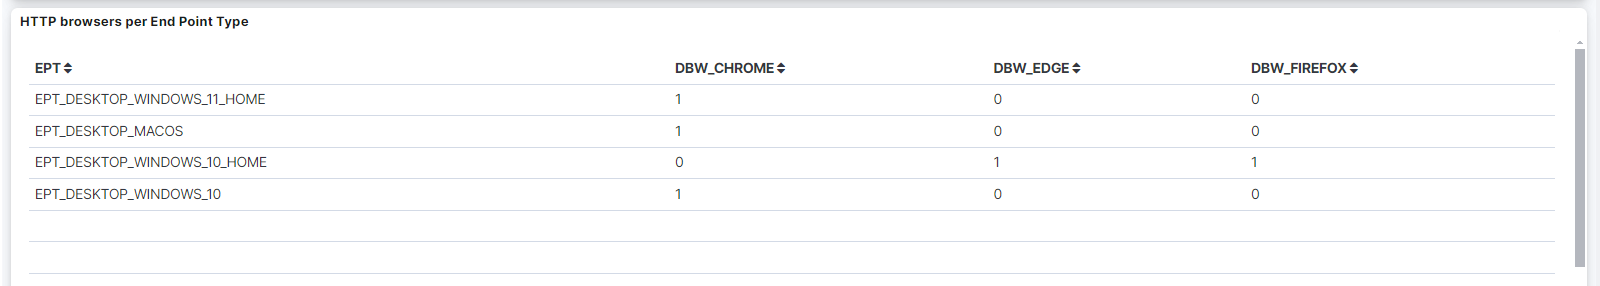
HTTP browsers per End Point Type:
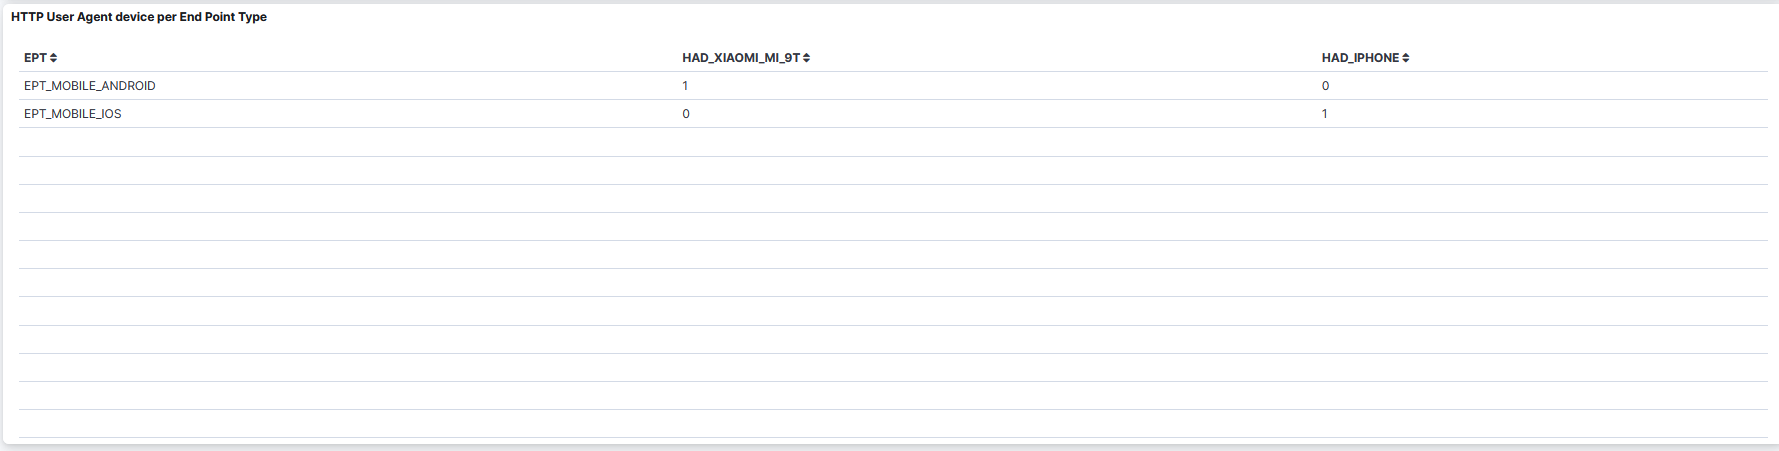
HTTP User Agent Device per End Point Type: