3.1.12.12. Custom Dashboards
From the Configuration > Dashboards section, you can create Custom Dashboards. While creating a dashboard you can define the path to render your dashboard in the Analytics menu.
For more information on how to create a customized dashboard that will suit your particular needs, see the Configuration > Dashboards section.
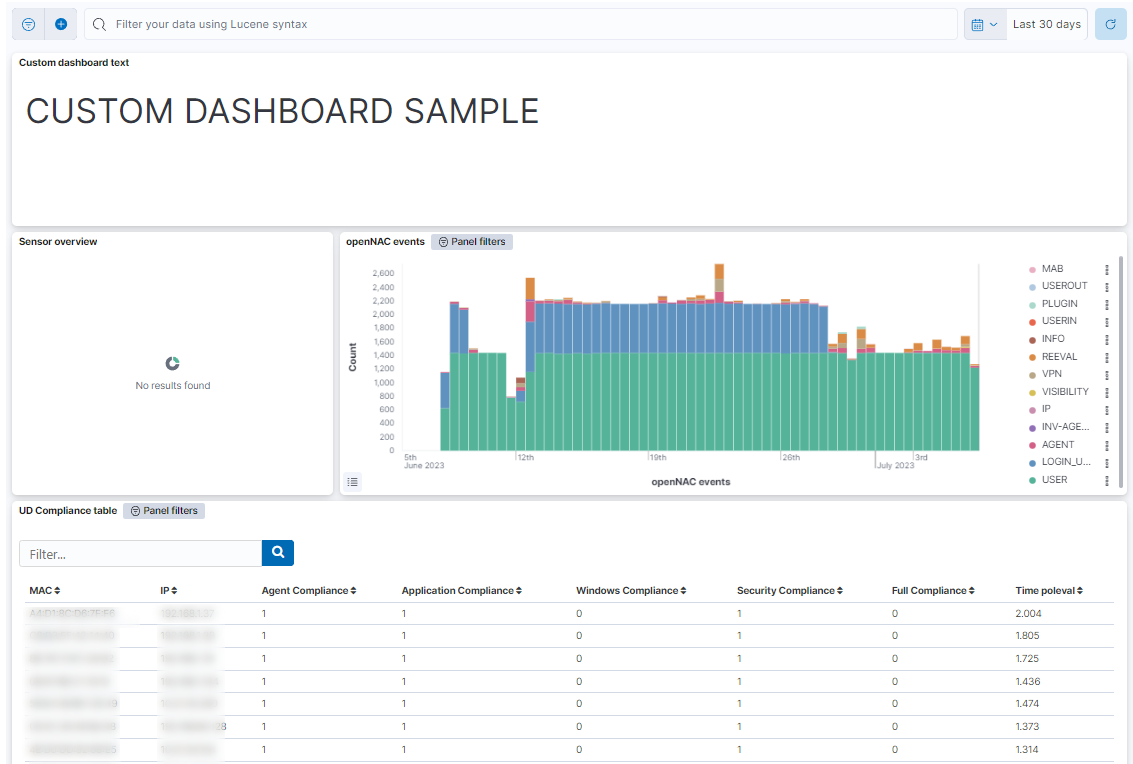
Here, you can see an example of a Custom Dashboard Sample that displays a text field, Sensor overview, openNAC events, and UD compliance table:
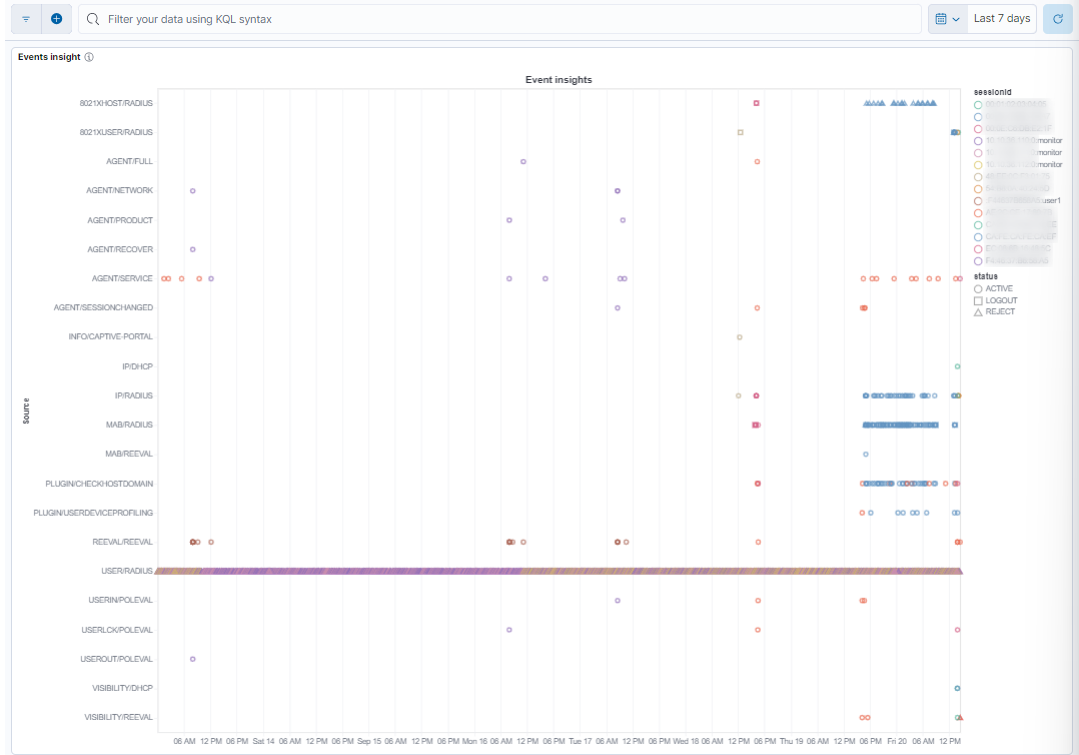
3.1.12.12.1. Raw data insights
This visualization shows events over time, differentiated by source/module and session, with detailed information (hostname, IP address, MAC address, evaluation time, number of tags, and network device tags associated with each event) in tooltips.