3.1.12.5.1. UNAC Overview
The UNAC overview dashboard displays all the authentication features of user devices connected to the network. It includes information about the location of the devices and the policies associated with them. They are separated by connected, rejected, and network device queries.
3.1.12.5.1.1. Header
The three available views in the UNAC Overview section show different information about user devices and network devices. However, they have a common header, which refers to a consistent section at the top of each view that contains shared information.
Menu
The menu features different windows, such as Connected, Rejected, and Network Devices. Each window offers distinct dashboard views, allowing you to navigate between these sections. The following topics will explore these menu options in detail.
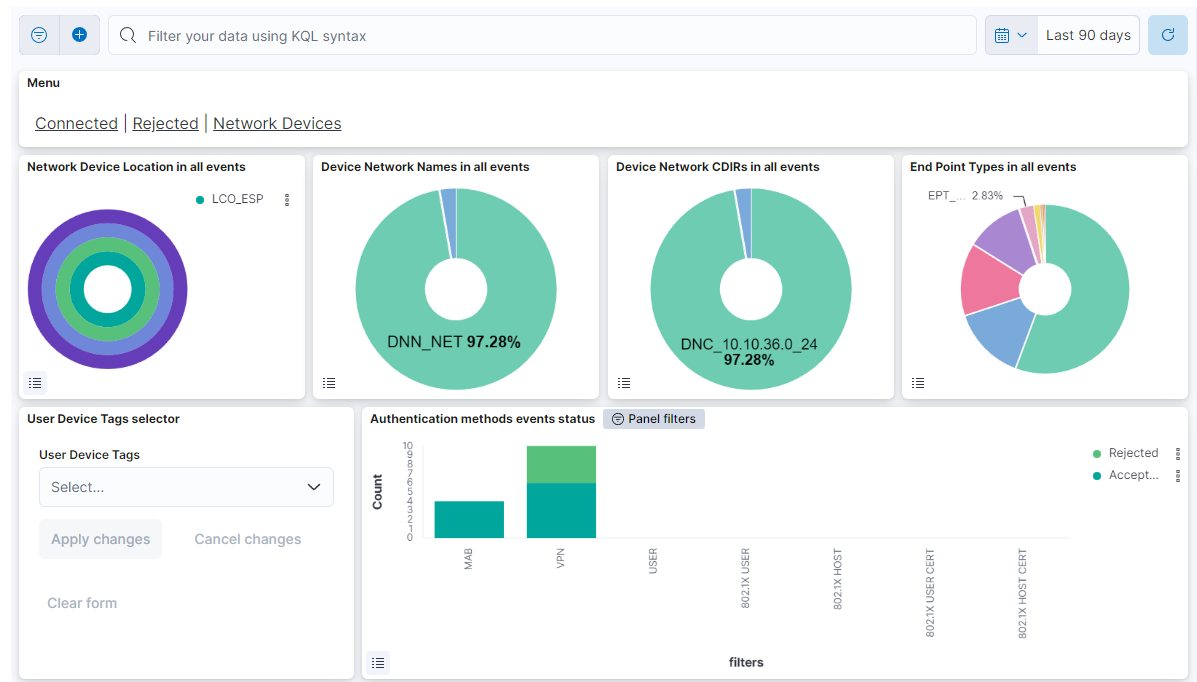
This header first row composed of four dashboards allows filtering by Network Device Location, Device Network Name, Device Network CDIRs, Endpoint Types. It will always look for the temporary index that is regenerated every day. In this toolbar, filter your data using KQL syntax.
User Device Tags selector: Allows filtering by user device tags.
Authentication methods events status: Shows the 7 authentication methods with the count of the number of authentication events for this method in the Y axis. The count of events is divided between accepted or rejected authentications.
3.1.12.5.1.2. Connected
The Connected window displays a view of the latest user device events with successful authentication.
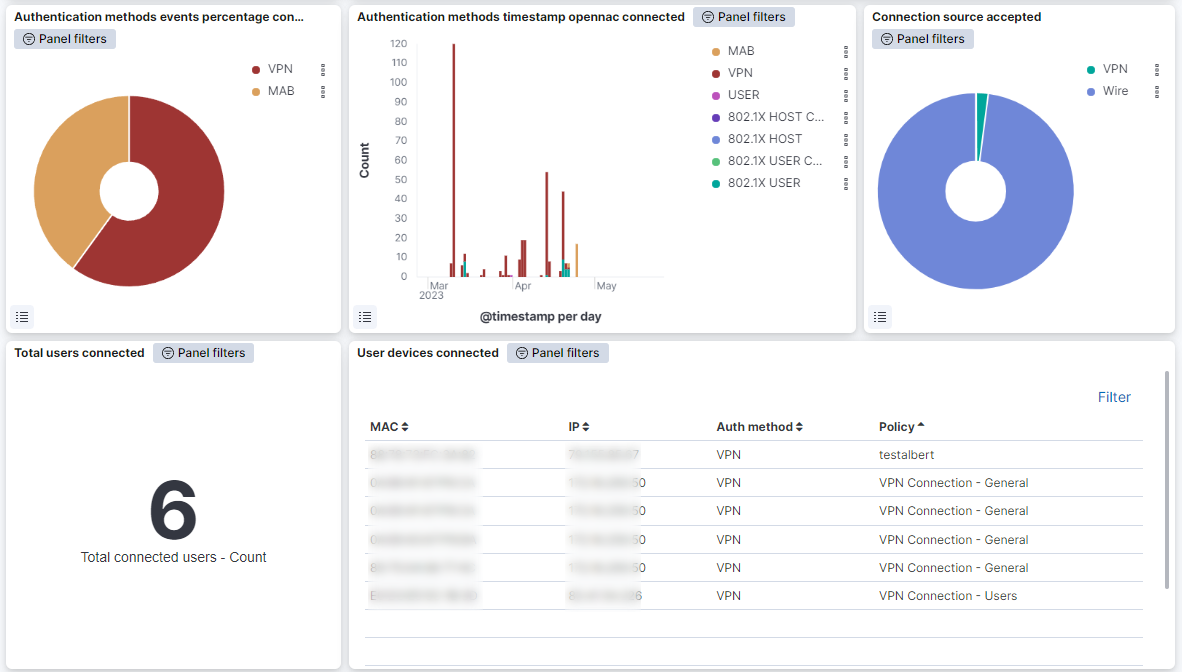
Authentication methods events percentage connected: Represents the percentage of successful authentication events for each method.
Authentication methods timestamp opennac connected: Shows the successful authentication events, separated by authentication method on a timeline.
Connection source accepted: Represents the percentage of successful authentication events with source VPN, Wi-Fi and Wire.
Total users connected: Shows the number of total user devices connected to the network.
User devices connected: Shows a table with the user devices connected to the network. In this table the MAC address, the IP, the authentication method and the policy of the user device are represented.
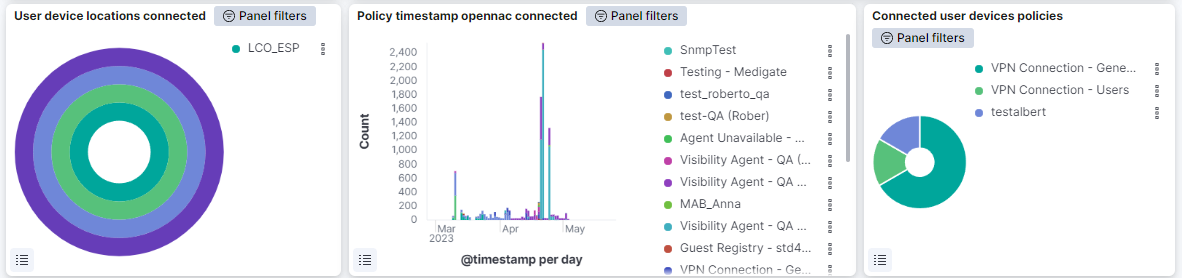
User device locations connected: This pie shows the locations of the successfully connected user devices of the network; the internal pie shows percentage of devices by country (LCO), the second pie the percentage of devices by city (LCI), the third pie the percentage of devices by building (LBD) and the external and last pie shows the percentage of devices by floor (LFL).
Policy timestamp opennac connected: Shows the successful authentication events, separated by the policy on a timeline.
Connected user devices policies: Represents the percentage of the policies of the connected user devices.
3.1.12.5.1.3. Rejected
The Rejected window displays the latest user device events with rejected authentication.
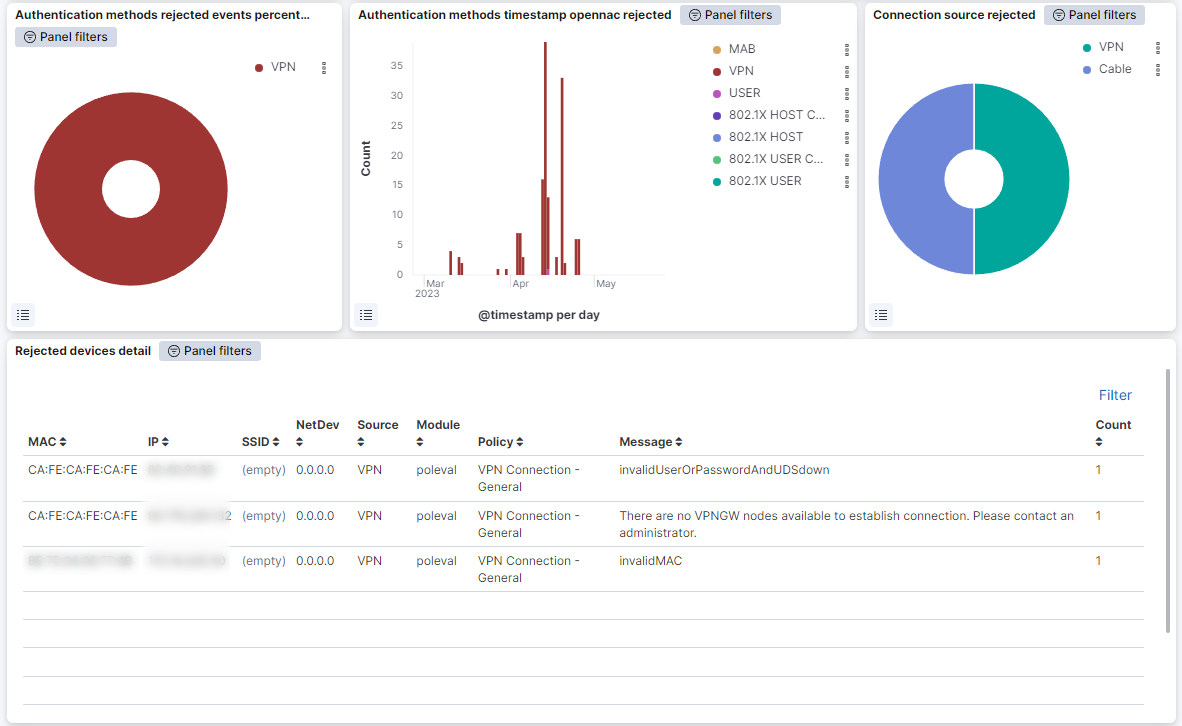
Authentication methods rejected events percentage: Represents the percentage of rejected authentication events for each method.
Authentication methods timestamp opennac rejected: Shows over time the rejected authentication events, separated by authentication method.
Connection source rejected: Represents the percentage of rejected authentication events with source VPN, Wi-Fi and Wire.
Rejected devices detail: Shows a table with the user devices rejected. Devices are represented in this table by MAC address, the IP, the SSID, the network device, the source, the module, the policy, the method and the number of times this event is repeated.
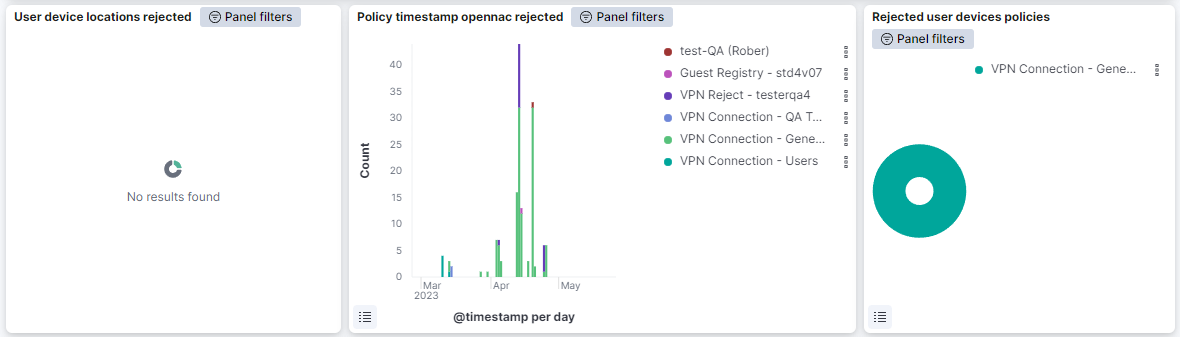
User device locations rejected: This pie shows the locations of the user devices that have been rejected from connecting to the network; the internal pie shows percentage of devices by country (LCO), the second pie the percentage of devices by city (LCI), the third pie the percentage of devices by building (LBD) and the external and last pie shows the percentage of devices by floor (LFL).
Policy timestamp opennac rejected: Shows the rejected authentication events, separated by the policy on a timeline.
Rejected user devices policies: Represents the percentage of the policies of the rejected user devices.
3.1.12.5.1.4. Network Devices
The Network Devices displays views about network devices connected to the network.
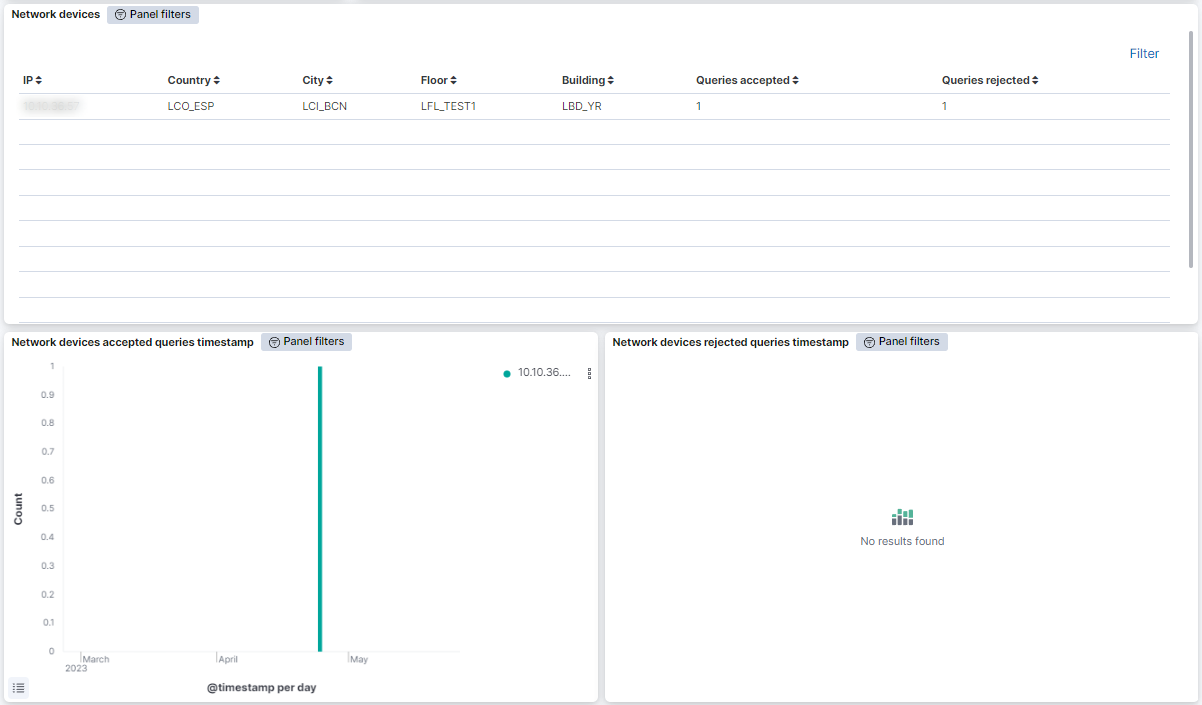
Network devices: Shows a table with the network devices. In this table network devices are represented by their IP, the Country, City, Floor and Building where they’re located, and the queries accepted and rejected for that network device.
Network devices accepted queries timestamp: Shows over time the accepted queries of the network devices, separated by network device IP.
Network devices rejected queries timestamp: Shows over time the rejected queries of the network devices, separated by network device IP.