5.2.5. Healthcheck
The healthcheck is an OpenNAC Enterprise monitoring module. This module checks that all OpenNAC services are up and running, helping us to verify that the main functions and services are active and work correctly.
Note
In case you have to open a support issue, please include a screen capture of the healthcheck.
5.2.5.1. Healthcheck Configuration
In an OpenNAC Enterprise installation, the first step is to check if the healthcheck package is already installed:
rpm -qa | grep opennac-healthcheck
If it is not installed, we need to run the following:
dnf install opennac-healthcheck -y
It is necessary to check if the healthcheck of each machine has the correct role.
Note
If we are using a customized healthcheck, we can omit the differences.
5.2.5.1.1. ON Core Principal
Check the following when the role is ON Core Principal in single deployment or cluster.
cd /usr/share/opennac/healthcheck/
diff healthcheck.ini.principal healthcheck.ini
If there is any difference, we need to configure the healthcheck as we can see in the ON Core Principal deployment.
5.2.5.1.2. ON Core Worker
Check the following when the role is ON Core Worker in cluster deployment.
cd /usr/share/opennac/healthcheck/
diff healthcheck.ini.worker healthcheck.ini
If there is any difference, we need to configure the healthcheck as we can see in the ON Core Worker deployment.
5.2.5.1.3. ON Core Proxy
Check the following when the role is ON Core Proxy.
cd /usr/share/opennac/healthcheck/
diff healthcheck.ini.proxy healthcheck.ini
If there is any difference, we need to configure the healthcheck as we can see in the ON Core Proxy deployment.
5.2.5.1.4. ON Analytics + ON Aggregator
Check the following when the role is ON Analytics with ON Aggregator in single deployment.
cd /usr/share/opennac/healthcheck/
diff healthcheck.ini.analy+agg healthcheck.ini
If there is any difference, we need to configure the healthcheck as we can see in the ON Analytics with ON Aggregator deployment.
5.2.5.1.5. ON Analytics
Check the following when the role is ON Analytics in cluster deployment.
cd /usr/share/opennac/healthcheck/
diff healthcheck.ini.analytics healthcheck.ini
If there is any difference, we need to configure the healthcheck as we can see in the ON Analytics deployment.
5.2.5.1.6. ON Aggregator
Check the following when the role is ON Aggregator in cluster deployment.
cd /usr/share/opennac/healthcheck/
diff healthcheck.ini.aggregator healthcheck.ini
If there is any difference, we need to configure the healthcheck as we can see in the ON Aggregator deployment.
5.2.5.1.7. ON Sensor
Check the following when the role is ON Sensor.
cd /usr/share/opennac/healthcheck/
diff healthcheck.ini.sensor healthcheck.ini
If there is any difference, we need to configure the healthcheck as we can see in the ON Sensor deployment.
5.2.5.1.8. Captive Portal
Check the following when the role is ON Captive Portal.
cd /usr/share/opennac/healthcheck/
diff healthcheck.ini.portal healthcheck.ini
If there is any difference, we need to configure the healthcheck as we can see in the Captive Portal deployment.
5.2.5.1.9. VPNGW
Check the following when the role is VPNGW.
cd /usr/share/opennac/healthcheck/
diff healthcheck.ini.vpngw healthcheck.ini
If there is any difference, we need to configure the healthcheck as we can see in the VPNGW deployment
5.2.5.2. Healthcheck Execution
To be able to execute this verification script, go to the desired component (ON Core, ON Analytics, ON Sensor, VPNGW) and execute it through the script healthcheck.php
php /usr/share/opennac/healthcheck/healthcheck.php
When executing the script, we will be shown the result of this check in the same command line where we have carried out the execution.
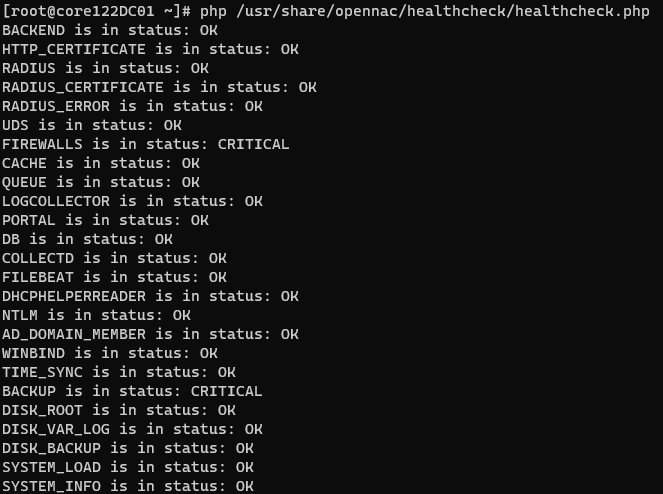
The results can display three different states:
Result |
Description |
|---|---|
OK |
Indicates that the service works correctly. |
WARNING |
Indicates that the service fails, but the effect is not critical |
CRITICAL |
Indicates that the service does not work correctly and can compromise the proper functioning of the system. |
The tests that are carried out to run this check can be found in the following directory:
cd /usr/share/opennac/healthcheck/libexec
In this directory, we will have the possibility of individually executing each of these tests to see its result. In case of obtaining a result that we do not expect, we can carry out the troubleshooting process by executing said test in “shell debug” mode with the following command:
sh -x /usr/share/opennac/healthcheck/libexec/<test>.sh
There is an option to activate or deactivate specific tests during the healthcheck execution. To do this, access the file in </usr/share/opennac/healthcheck/healthcheck.ini> .
To deactivate or activate a specific test, comment or uncomment the line by adding or removing the “;” symbol at the beginning, respectively. The example below comments the SYSTEM_LOAD service:
; opennac's healthcheck configuration file
; sections [MODULE] are opennac components monitored
; variables are host/ip that hosts monitored service in the opennac component.
; values: "checkname; check description; check string"

;[SYSTEM_LOAD]
;127.0.0.1[] = "SystemLoad;System Load average;/usr/lib64/nagios/plugins/check_load -w 2,6,12 -c 4,12,24"

[SYSTEM_INFO]
127.0.0.1[] = "SystemInfo;System information;/usr/share/opennac/healthcheck/libexec/check_nodeinfo.sh PRINCIPAL"
127.0.0.1[] = "CoreVersion;Check core version;/usr/share/opennac/healthcheck/libexec/checkCoreVersion.php"
127.0.0.1[] = "WorkersVersion;Check workers version;/usr/share/opennac/healthcheck/libexec/checkWorkersVersion.php"

[BACKEND]
127.0.0.1[] = "Portal_Status;Check http API status;/usr/share/opennac/healthcheck/libexec/check_http -H 127.0.0.1 -u /status -f follow -r 'db.:1'"

...
5.2.5.3. Administration Portal
We can also find this result in the Administration Portal by clicking on the healthcheck icon located in the Settings Menu, as shown in the image below
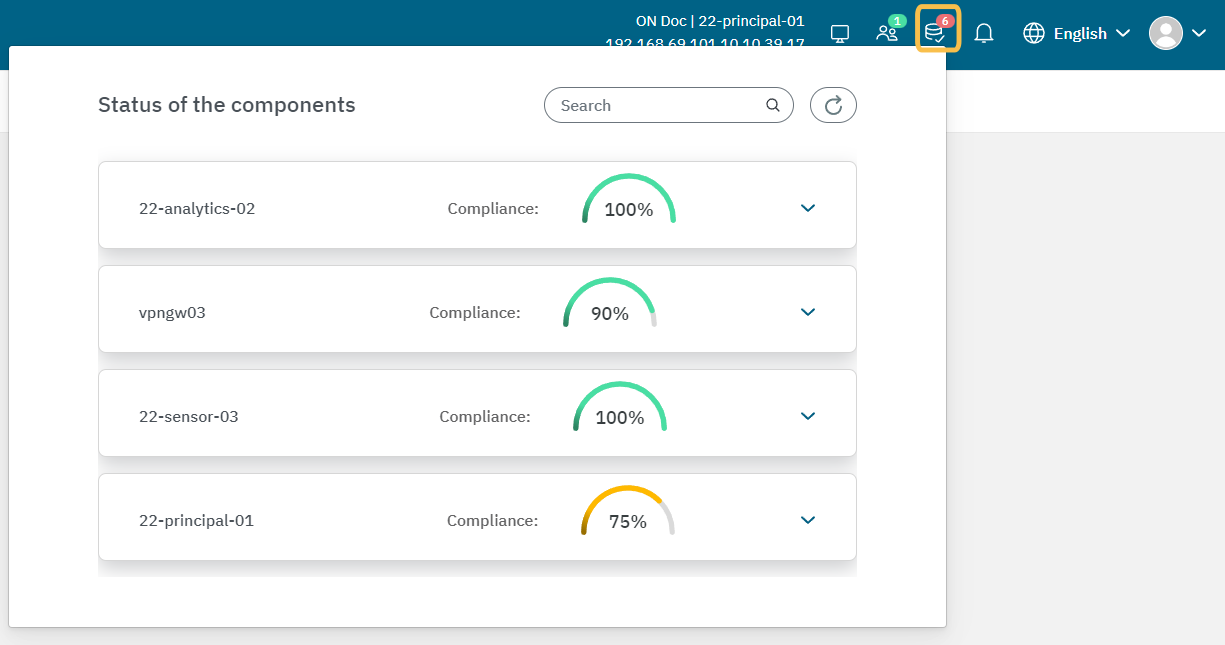
Health checks are automatically executed every minute. In this window, you can see the status of the last health check executed. It displays the compliance percentage of all services:
Services with an “OK” result are shown in green.
Services with a “WARNING” result are shown in yellow.
Services with a “CRITICAL” result are shown in red.
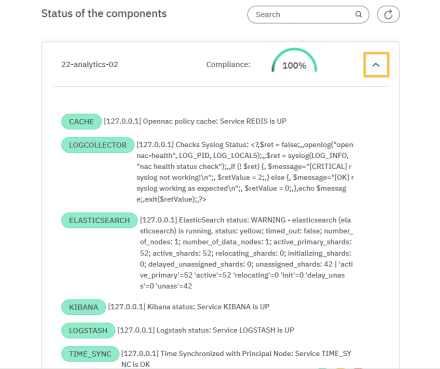
See the details of each OpenNAC infrastructure component, by clicking on their arrow. Note that these checks on the services are the same for both the CLI and the Administration portal.
5.2.5.4. Complete list of service healthchecks
Warning
The main services that can affect the authentication process in case of being in CRITICAL state are those of RADIUS, CERTIFICATE, UDS, BACKEND and NTLM.
AD_DOMAIN_MEMBER: Checks the host’s connection with the Active Directory (AD) to ensure it is maintained correctly.
ADM_USER_PASSWD_EXPIRATION: Checks the expiration dates of the admin user passwords.
BACKEND: Checks the status of the API.
BACKUP: Checks the number of days since the last backup.
CACHE: Checks the status of the Redis service and its memory usage.
CAPTIVE_PORTAL: Checks if the captive portal is updated.
CAPTIVE_PORTAL_THEMES: Checks if the captive portal themes of a Worker machine are synchronized with the ON Principal.
COLLECTD: Checks the status of the COLLECTD process.
DB: Checks the status of the system’s MySQL database.
DBREPLICATION: Checks the replication of the system’s MySQL database.
DHCPHELPERREADER: Checks the status of the DHCP-Helper-Reader process.
DISK_BACKUP: Checks the percentage of disk usage for the /backup directory.
DISK_ROOT: Checks the percentage of disk usage for the root directory (/).
DISK_TMP: Checks the percentage of disk usage for the /tmp directory.
DISK_VAR: Checks the percentage of disk usage for the /var directory.
DISK_VAR_LOG: Checks the percentage of disk usage for the /var/log directory.
DNS: Checks the status of the DNS server.
ELASTIC_INDEX_READ_ONLY: Checks if any of the Elasticsearch indices are in read-only mode.
ELASTICSEARCH: Checks the status of the Elasticsearch service.
FILEBEAT: Checks the status of the FILEBEAT process.
HTTP_CERTIFICATE: Checks if the HTTP certificate has expired.
KIBANA: Checks the status of the KIBANA service.
LDAP: Checks the status of the SLAPD process.
LOGCOLLECTOR: Checks that the Rsyslog service is up and running.
LOGSTASH: Checks the status of the LOGSTASH service.
NTLM: Checks the authentication by performing NTLM authentication against the AD server.
NXLOG: Checks the status of the Nxlog process.
OPENVPN: Checks the status of the OpenVPN service.
PORTAL: Checks HTTP access to the administration portal.
QUEUES: Checks the status of the QUEUES service.
RADIUS: Checks the status of the RADIUS server.
RADIUS_CERTIFICATE: Checks if the RADIUS certificate has expired.
RAM: Checks the percentage of occupied RAM memory.
REMOTEQUEUE: Checks that the REMOTE QUEUES service is up and running.
SHOREWALL: Checks the status of the SHOREWALL service.
SWAP: Checks the percentage of occupied SWAP memory.
SYSTEM_INFO: Checks the system role. It also checks the version of Core and Workers.
SYSTEM_LOAD: Checks the system load occupancy using the load average.
TIME_SYNC: Checks if the time is synchronized with the main node and the “TIME_SYNC” service is active and running.
UDS: Checks that the User Data Sources are active and working.
VPN_NODES: Checks the status of VPN nodes.
WINDBIND: Checks the status of the Windbind service.
WIREGUARD: Checks the status of the Wireguard service.
ZEEK: Checks the status of the ZEEKCTL service.
If you are unsure which script is executing a specific health check, you can check it in the following file:
cat /usr/share/opennac/healthcheck/healthcheck.ini | grep -A2 {{ healthcheck }}
For example, the script for ELASTICSEARCH healthcheck is in /usr/share/opennac/healthcheck/libexec/check_elasticsearch.sh:

5.2.5.5. Heltchchecks by Nodes
The following table shows the different checks performed on each of the nodes.
TESTS |
PRINCIPAL |
WORKER |
PROXY |
ANALYTICS |
AGGREGATOR |
ANALY+AGG |
PORTAL |
SENSOR |
VPNGW |
|---|---|---|---|---|---|---|---|---|---|
AD_DOMAIN_MEMBER |
X |
X |
|||||||
ADM_USER_PASSWD_EXPIRATION |
X |
||||||||
BACKEND |
X |
X |
|||||||
BACKUP |
X |
X |
X |
||||||
CACHE |
X |
X |
X |
X |
X |
X |
X |
||
CAPTIVE_PORTAL |
X |
X |
|||||||
CAPTIVE_PORTAL_THEMES |
X |
X |
|||||||
COLLECTD |
X |
X |
X |
X |
X |
X |
X |
X |
X |
DB |
X |
X |
|||||||
DBREPLICATION |
X |
||||||||
DHCPHELPERREADER |
X |
X |
|||||||
DISK_BACKUP |
X |
X |
X |
X |
|||||
DISK_ROOT |
X |
X |
X |
X |
X |
X |
X |
X |
X |
DISK_TMP |
X |
X |
X |
X |
X |
X |
X |
X |
|
DISK_VAR |
X |
X |
X |
X |
X |
X |
X |
X |
|
DISK_VAR_LOG |
X |
X |
X |
X |
X |
X |
X |
X |
X |
ELASTICSEARCH |
X |
X |
|||||||
ELASTIC_INDEX_READ_ONLY |
X |
X |
|||||||
FILEBEAT |
X |
X |
X |
||||||
HTTP_CERTIFICATE |
X |
X |
X |
||||||
KIBANA |
X |
X |
|||||||
LDAP |
* X |
||||||||
LOGCOLLECTOR |
X |
X |
X |
X |
X |
X |
X |
||
LOGSTASH |
X |
X |
|||||||
NTLM |
X |
X |
|||||||
NXLOG |
* X |
||||||||
OPENVPN |
X |
||||||||
PORTAL |
X |
X |
X |
||||||
QUEUE |
X |
X |
|||||||
RADIUS |
X |
X |
X |
||||||
RADIUS_CERTIFICATE |
X |
X |
X |
||||||
RAM |
* X |
* X |
* X |
* X |
* X |
* X |
* X |
* X |
* X |
REMOTEQUEUE |
* X |
||||||||
SHOREWALL |
X |
||||||||
SWAP |
* X |
* X |
* X |
* X |
* X |
* X |
* X |
* X |
* X |
SYSTEM_INFO |
X |
X |
X |
X |
X |
X |
X |
X |
X |
SYSTEM_LOAD |
X |
X |
X |
X |
X |
X |
X |
X |
X |
TIME_SYNC |
X |
X |
X |
X |
X |
X |
X |
X |
X |
UDS |
X |
X |
|||||||
VPN_NODES |
X |
X |
|||||||
WINBIND |
X |
X |
|||||||
WIREGUARD |
X |
||||||||
ZEEK |
X |
Note
The services marked with an * are commented out by default. You can activate them as needed according to your environment.
5.2.5.6. Healthcheck Troubleshooting
This section provides an overview of the services Healthchecks and the corresponding procedures to address critical or warning statuses, including recommended actions to resolve issues.
5.2.5.6.1. BACKEND
The BACKEND service corresponds to the HTTP service, more specifically to our API that is running on the core servers.
If you find it in a critical state, restart the Apache service and then check the status of the service:
[root@server ~]# systemctl restart httpd

[root@server ~]# systemctl status httpd
  httpd.service - The Apache HTTP Server
   Loaded: loaded (/usr/lib/systemd/system/httpd.service; enabled; vendor preset: disabled)
  Drop-In: /usr/lib/systemd/system/httpd.service.d
           └─php-fpm.conf
   Active: active (running) since Wed 2022-07-27 10:28:55 CEST; 6s ago
     Docs: man:httpd.service(8)
  Process: 3152195 ExecReload=/usr/sbin/httpd $OPTIONS -k graceful (code=exited, status=0/SUCCESS)
 Main PID: 3747417 (httpd)
   Status: "Started, listening on: port 443, port 80"
    Tasks: 278 (limit: 101034)
   Memory: 51.1M
   CGroup: /system.slice/httpd.service
           ├─3747417 /usr/sbin/httpd -DFOREGROUND
           ├─3747419 /usr/sbin/httpd -DFOREGROUND
           ├─3747420 /usr/sbin/httpd -DFOREGROUND
           ├─3747421 /usr/sbin/httpd -DFOREGROUND
           ├─3747422 /usr/sbin/httpd -DFOREGROUND
           └─3747647 /usr/sbin/httpd -DFOREGROUND

Jul 27 10:28:55 server systemd[1]: Starting The Apache HTTP Server...
Jul 27 10:28:55 server httpd[3747417]: AH00558: httpd: Could not reliably determine the server's fully qualified domain name, using 192.168.0.100. Set the 'ServerName' directive globally to suppress this message
Jul 27 10:28:55 server systemd[1]: Started The Apache HTTP Server.
Jul 27 10:28:55 server httpd[3747417]: Server configured, listening on: port 443, port 80
If the status output does not indicate “Active: active”, please contact our support team.
5.2.5.6.2. BACKUP
The BACKUP check verifies if there is at least one recent backup in the in the /backup. If it displays a warning status, run the following backup script:
Note
Run the backup script preferably outside of regular working hours because the database backup process involves locking the tables, which temporarily restricts write operations while the data dump is being carried out.
[root@server ~]# /usr/share/opennac/utils/backup/opennac_backup.sh
Wait at least two minutes after the backup script finishes running and verify if the status of this check is normalized. If not, please contact our support team.
Note
The backup will always fail if the /backup partition is full. If this is the case, there should also be an alert for the DISK_BACKUP check.
5.2.5.6.3. CACHE
The Cache service is what provides openNAC with greater agility in executing policy evaluations, helping to support a greater load of requests within our servers. This healthcheck also verifies the status of the Redis memory usage.
Note
The CACHE healthcheck (on all servers) always queries the principal Core server, therefore, the necessary actions to recover the service are always performed on the principal Core server.
If you find the Cache service in a critical state, it will not have any effect on the service. In the Principal Core server, run the following command to restart the Cache and then check the status of the service:
[root@server ~]# systemctl restart redis

[root@server ~]# systemctl status redis

  redis.service - Redis persistent key-value database
   Loaded: loaded (/usr/lib/systemd/system/redis.service; enabled; vendor preset: disabled)
  Drop-In: /etc/systemd/system/redis.service.d
           └─limit.conf
   Active: active (running) since Wed 2022-07-27 15:18:01 CEST; 6s ago
  Process: 3842130 ExecStop=/usr/libexec/redis-shutdown (code=exited, status=0/SUCCESS)
 Main PID: 3842144 (redis-server)
    Tasks: 4 (limit: 101034)
   Memory: 11.9M
   CGroup: /system.slice/redis.service
           └─3842144 /usr/bin/redis-server 0.0.0.0:6379

Jul 27 15:18:01 server systemd[1]: redis.service: Succeeded.
Jul 27 15:18:01 server systemd[1]: Stopped Redis persistent key-value database.
Jul 27 15:18:01 server systemd[1]: Starting Redis persistent key-value database...
Jul 27 15:18:01 server systemd[1]: Started Redis persistent key-value database.
If the status output does not indicate “Active: active”, please contact our support team.
5.2.5.6.4. COLLECTD
The COLLECTD service is responsible for generating the server status graphs. If this service is in a critical state, the authentication service will not be affected.
To resolve this issue, run the following command to restart the service and then check its status:
[root@server ~]# systemctl restart collectd

[root@server ~]# systemctl status collectd

  collectd.service - Collectd statistics daemon
   Loaded: loaded (/usr/lib/systemd/system/collectd.service; enabled; vendor preset: disabled)
   Active: active (running) since Wed 2022-07-27 16:02:12 CEST; 5s ago
     Docs: man:collectd(1)
           man:collectd.conf(5)
 Main PID: 3856877 (collectd)
    Tasks: 16 (limit: 101034)
   Memory: 8.9M
   CGroup: /system.slice/collectd.service
           ├─3856877 /usr/sbin/collectd
           ├─3856897 /bin/bash /usr/share/opennac/utils/collectd/scripts/redis-collectd.sh
           ├─3856903 /bin/bash /usr/share/opennac/utils/collectd/scripts/redisserver-collectd.sh
           └─3856904 sleep 10.000
If the status output does not indicate “Active: active”, please contact our support team.
5.2.5.6.5. DB
The DB healthcheck corresponds to the database service used by OpenNAC and executed within the Cores.
If you find it in a critical state, the authentication service will not be directly affected. In such a scenario, you can resolve the issue by restarting the MySQL process:
[root@server ~]# systemctl restart mariadb

[root@server ~]# systemctl status mariadb
  mariadb.service - MariaDB 10.3 database server
   Loaded: loaded (/usr/lib/systemd/system/mariadb.service; enabled; vendor preset: disabled)
   Active: active (running) since Fri 2022-06-17 13:14:26 CEST; 1 months 9 days ago
     Docs: man:mysqld(8)
           https://mariadb.com/kb/en/library/systemd/
 Main PID: 7448 (mysqld)
   Status: "Taking your SQL requests now..."
    Tasks: 59 (limit: 101034)
   Memory: 833.1M
   CGroup: /system.slice/mariadb.service
           └─7448 /usr/libexec/mysqld --basedir=/usr
If the status output does not indicate “Active: active”, please contact our support team.
5.2.5.6.6. DBREPLICATION
The DBREPLICATION check is the validation that the worker servers are able to access the database of the principal server.
If replication fails on any node, we can use the db_replication.sh script with the fix flag “-t fix”. See the detailed description of this script execution in the Platform Administration > Scripts section.
Note
We recommend running the script from a worker that has replication running to avoid impacting the main service.
If the service is in a critical state, the authentication service will not be directly affected. The initial analysis procedure involves verifying that the service is OK in the principal core, as indicated by the database healthcheck (DB). Additionally, it involves confirming that the worker can establish connectivity with the MariaDB of the principal core server.
[root@server ~]# ping onprincipal -c 1
PING ldap.mydomain.com (192.168.10.1): 56 data bytes
64 bytes from 192.168.10.1: icmp_seq=0 ttl=127 time=77.863 ms

--- 192.168.10.1 ping statistics ---
1 packets transmitted, 1 packets received, 0.0% packet loss
round-trip min/avg/max/stddev = 77.863/77.863/77.863/0.000 ms

[root@server ~]# telnet onprincipal 3306
Trying 192.168.10.1...
Connected to 192.168.10.1.
Escape character is '^]'.
exit
Connection closed by foreign host.
If the service is running on the principal, but the worker cannot establish a telnet connection, there may be a network access issue. If, even after verifying server access and communication, the problem persists, please contact our support team.
5.2.5.6.7. DHCPHELPERREADER
The dhcp-helper-reader service runs on the cores and/or sensors and its function is to process the DHCP packets collected by the network to extract visibility data from these packets.
If you find it in a critical state, the authentication service will not be affected. To resolve this issue, restart is the dhcp-helper-reader service and check its status:
[root@server ~]# systemctl restart dhcp-helper-reader
[root@server ~]# systemctl status dhcp-helper-reader
  dhcp-helper-reader.service - DHCP Helper Reader
   Loaded: loaded (/etc/systemd/system/dhcp-helper-reader.service; disabled; vendor preset: disabled)
   Active: active (exited) since Tue 2018-07-10 19:18:42 CEST; 10s ago
If the status output does not indicate “Active: active”, please contact our support team.
5.2.5.6.8. DISK_BACKUP
The DISK_BACKUP healthcheck, verifies the percentage of disk usage for the /backup directory.
In case of a warning, check the information about the disk space usage on the system by executing the following command:
[root@server ~]# df -h
Filesystem            Size  Used Avail Use% Mounted on
/dev/mapper/vgSystem-root
                  7.8G  2.8G  4.7G  37% /
tmpfs                 7.8G     0  7.8G   0% /dev/shm
/dev/sda1             488M  148M  315M  32% /boot
/dev/mapper/vgSystem-tmp
                      2.0G   31M  1.8G   2% /tmp
/dev/mapper/vgSystem-var
                       41G  769M   38G   2% /var
/dev/mapper/vgSystem-varLog
                       40G  392M   37G   2% /var/log
/dev/mapper/vgSystem-backup
                      7.8G  836M  6.6G  12% /backup
If you see any filesystem at 100% under the Use% column, please contact our support team to identify what can be cleaned from the filesystem.
5.2.5.6.9. DISK_ROOT
This healthcheck checks the percentage of disk usage for the /root directory.
In case of a warning, check the information about the disk space usage on the system by executing the following command:
[root@server ~]# df -h
Filesystem            Size  Used Avail Use% Mounted on
/dev/mapper/vgSystem-root
                      7.8G  2.8G  4.7G  37% /
tmpfs                 7.8G     0  7.8G   0% /dev/shm
/dev/sda1             488M  148M  315M  32% /boot
/dev/mapper/vgSystem-tmp
                      2.0G   31M  1.8G   2% /tmp
/dev/mapper/vgSystem-var
                       41G  769M   38G   2% /var
/dev/mapper/vgSystem-varLog
                       40G  392M   37G   2% /var/log
/dev/mapper/vgSystem-backup
                      7.8G  836M  6.6G  12% /backup
If you see any filesystem at 100% under the Use% column, please contact our support team to identify what can be cleaned from the filesystem.
5.2.5.6.10. DISK_VAR
This healthcheck checks the percentage of disk usage for the /var directory.
In case of a warning, check the information about the disk space usage on the system by executing the following command:
[root@server ~]# df -h
Filesystem            Size  Used Avail Use% Mounted on
/dev/mapper/vgSystem-root
                      7.8G  2.8G  4.7G  37% /
tmpfs                 7.8G     0  7.8G   0% /dev/shm
/dev/sda1             488M  148M  315M  32% /boot
/dev/mapper/vgSystem-tmp
                      2.0G   31M  1.8G   2% /tmp
/dev/mapper/vgSystem-var
                       41G  769M   38G   2% /var
/dev/mapper/vgSystem-varLog
                       40G  392M   37G   2% /var/log
/dev/mapper/vgSystem-backup
                      7.8G  836M  6.6G  12% /backup
If you see any filesystem at 100% under the Use% column, please contact our support team to identify what can be cleaned from the filesystem.
5.2.5.6.11. DISK_VAR_LOG
This healthcheck checks the percentage of disk usage for the /var/log directory.
In case of a warning, check the information about the disk space usage on the system by executing the following command:
[root@server ~]# df -h
Filesystem            Size  Used Avail Use% Mounted on
/dev/mapper/vgSystem-root
                      7.8G  2.8G  4.7G  37% /
tmpfs                 7.8G     0  7.8G   0% /dev/shm
/dev/sda1             488M  148M  315M  32% /boot
/dev/mapper/vgSystem-tmp
                      2.0G   31M  1.8G   2% /tmp
/dev/mapper/vgSystem-var
                       41G  769M   38G   2% /var
/dev/mapper/vgSystem-varLog
                       40G  392M   37G   2% /var/log
/dev/mapper/vgSystem-backup
                      7.8G  836M  6.6G  12% /backup
If you see any filesystem at 100% under the Use% column, please contact our support team to identify what can be cleaned from the filesystem.
5.2.5.6.12. ELASTIC_INDEX_READ_ONLY
This check will alert you when the usage limit for the /var partition reaches 85% or higher. At the same time, there may be an alert for the DISK_VAR check. As a result, the Elasticsearch service may no longer be able to write data to its indices.
Follow the instructions described in DISK_ROOT, confirm the partition space usage and contact our support team. They will analyze the need for additional disk space based on the desired data retention and perform the necessary steps to restore Elasticsearch service’s ability to write to the indices.
In case the writing is blocked but we still have enough free disk space (df -h) we can run the script read_only.sh (/usr/share/opennac/analytics/scripts).
If you have a heavily busy disk, you should manually run the Elasticsearch Curator in the ON Analytics before enabling writing. It will optimize your Elasticsearch indices:
/usr/share/opennac/analytics/scripts/elasticsearch_purge_index_curator.sh
5.2.5.6.13. ELASTICSEARCH
The ElasticSearch service is the data storage base of the Analytics component of the OpenNAC solution.
If you find it in a critical state, the authentication service will not be affected, but the reports and the visibility service will. To resolve this issue, restart is the elasticsearch service and check its status:
[root@server ~]# systemctl restart elasticsearch
[root@server ~]# systemctl status elasticsearch
  elasticsearch.service - Elasticsearch
   Loaded: loaded (/usr/lib/systemd/system/elasticsearch.service; enabled; vendor preset: disabled)
   Active: active (running) since Tue 2018-07-10 19:22:59 CEST; 4s ago
If the status output does not indicate “Active: active”, please contact our support team.
5.2.5.6.14. FILEBEAT
The Filebeat service is responsible for sending the logs of OpenNAC authentication events to the ON Analytics.
If you find it in a critical state, the authentication service will not be affected. To resolve this issue, restart is the filebeat service and check its status:
[root@server ~]# systemctl restart filebeat

[root@server ~]# systemctl status filebeat

   filebeat.service - Filebeat sends log files to Logstash or directly to Elasticsearch.
   Loaded: loaded (/usr/lib/systemd/system/filebeat.service; enabled; vendor preset: disabled)
   Active: active (running) since Wed 2022-07-27 16:08:52 CEST; 10s ago
     Docs: https://www.elastic.co/products/beats/filebeat
 Main PID: 3858755 (filebeat)
    Tasks: 13 (limit: 101034)
   Memory: 10.6M
   CGroup: /system.slice/filebeat.service
           └─3858755 /usr/share/filebeat/bin/filebeat -e -c /etc/filebeat/filebeat.yml -path.home /usr/share/filebeat -path.config /etc/filebeat -path.data /var/lib/filebeat -path.logs /var/log/filebeat
If the status output does not indicate “Active: active”, please contact our support team.
5.2.5.6.15. HTTP_CERTIFICATE
The HTTP_CERTIFICATE healthcheck verifies the expiration time of the Administration Portal certificates. The check will start alerting 60 days before the certificate expires.
If the certificate finally expires, the Administration Portal will display a message indicating that the site is not trusted because the certificate is invalid. Please contact our support team, since this requires the generation of new certificates for the servers.
Refer to the HTTPD Certificates Configuration section for information on how to install, restart and check the service.
5.2.5.6.16. KIBANA
The Kibana service is the data visualization interface of the ON Analytics component of the OpenNAC solution.
If you find it in a critical state, the authentication service will not be affected, but the reports and the visibility service will. To resolve this issue, restart is the filebeat service and check its status:
[root@server ~]# systemctl restart kibana
[root@server ~]# systemctl status kibana
  kibana.service - Kibana
   Loaded: loaded (/etc/systemd/system/kibana.service; enabled; vendor preset: disabled)
   Active: active (running) since Tue 2018-07-10 19:22:47 CEST; 3s ago
If the status output does not indicate “Active: active”, please contact our support team.
5.2.5.6.17. LOGCOLLECTOR
The LOGCOLLECTOR healthcheck verifies the status of the Rsyslog service.
If you find it in a critical state, the authentication service will not be affected. To resolve this issue, restart is the rsyslog service and check its status:
[root@server ~]# systemctl restart rsyslog

[root@server ~]# systemctl status rsyslog

  rsyslog.service - System Logging Service
   Loaded: loaded (/usr/lib/systemd/system/rsyslog.service; enabled; vendor preset: enabled)
   Active: active (running) since Wed 2022-07-27 15:54:54 CEST; 6s ago
     Docs: man:rsyslogd(8)
           https://www.rsyslog.com/doc/
 Main PID: 3854570 (rsyslogd)
    Tasks: 3 (limit: 101034)
   Memory: 1.6M
   CGroup: /system.slice/rsyslog.service
           └─3854570 /usr/sbin/rsyslogd -n

Jul 27 15:54:54 server systemd[1]: Starting System Logging Service...
Jul 27 15:54:54 server rsyslogd[3854570]: [origin software="rsyslogd" swVersion="8.2102.0-7.el8_6.1" x-pid="3854570" x-info="https://www.rsyslog.com"] start
Jul 27 15:54:54 server systemd[1]: Started System Logging Service.
Jul 27 15:54:54 server rsyslogd[3854570]: imjournal: journal files changed, reloading...  [v8.2102.0-7.el8_6.1 try https://www.rsyslog.com/e/0 ]
If the status output does not indicate “Active: active”, please contact our support team.
5.2.5.6.18. LOGSTASH
The Logstash service is the data aggregator of the OpenNAC solution. If you find it in a critical state, the authentication service will not be affected, but the reports and the visibility service will. To resolve this issue, restart is the Logstash service and check its status:
[root@server ~]# systemctl restart logstash
[root@server ~]# systemctl status logstash
  logstash.service - logstash
   Loaded: loaded (/etc/systemd/system/logstash.service; enabled; vendor preset: disabled)
   Active: active (running) since Tue 2018-07-10 19:21:55 CEST; 28s ago
If the status output does not indicate “Active: active”, please contact our support team.
5.2.5.6.19. NTLM
The NTLM healthcheck is used to ensure that the ON Core can successfully perform NTLM authentications within the domain it has joined.
If you find it in a critical state, the authentication service with the domain user supplicant will be affected. The analysis process is as follows:
[root@server ~]# /usr/bin/ntlm_auth --username=<user> --password=<1234> --domain=
NT_STATUS_OK: Success (0x0)
If the authentication result is not “NT_STATUS_OK”, you should verify with your Active Directory that the authentication credentials are still valid.
5.2.5.6.20. PORTAL
The PORTAL healthcheck corresponds to the HTTP service running on the ON Core servers.
In case you find it in a critical state, restart is the HTTP service and check its status:
[root@server ~]# systemctl restart httpd

[root@server ~]# systemctl status httpd
  httpd.service - The Apache HTTP Server
   Loaded: loaded (/usr/lib/systemd/system/httpd.service; enabled; vendor preset: disabled)
  Drop-In: /usr/lib/systemd/system/httpd.service.d
           └─php-fpm.conf
   Active: active (running) since Wed 2022-07-27 10:28:55 CEST; 6s ago
     Docs: man:httpd.service(8)
  Process: 3152195 ExecReload=/usr/sbin/httpd $OPTIONS -k graceful (code=exited, status=0/SUCCESS)
 Main PID: 3747417 (httpd)
   Status: "Started, listening on: port 443, port 80"
    Tasks: 278 (limit: 101034)
   Memory: 51.1M
   CGroup: /system.slice/httpd.service
           ├─3747417 /usr/sbin/httpd -DFOREGROUND
           ├─3747419 /usr/sbin/httpd -DFOREGROUND
           ├─3747420 /usr/sbin/httpd -DFOREGROUND
           ├─3747421 /usr/sbin/httpd -DFOREGROUND
           ├─3747422 /usr/sbin/httpd -DFOREGROUND
           └─3747647 /usr/sbin/httpd -DFOREGROUND

Jul 27 10:28:55 server systemd[1]: Starting The Apache HTTP Server...
Jul 27 10:28:55 server httpd[3747417]: AH00558: httpd: Could not reliably determine the server's fully qualified domain name, using 192.168.0.100. Set the 'ServerName' directive globally to suppress this message
Jul 27 10:28:55 server systemd[1]: Started The Apache HTTP Server.
Jul 27 10:28:55 server httpd[3747417]: Server configured, listening on: port 443, port 80
If the status output does not indicate “Active: active”, please contact our support team.
5.2.5.6.21. QUEUES
The Queue service is what provides OpenNAC with the use of queues for writing to the database. It relies on the Gearmand queuing system, this service enhances server performance by allowing it to respond to requests without relying on database writes.
If the service is in Critical status, it will not directly affect the authentication service, but it will stop plugins execution and the status of the user devices will not be reflected in the Business Profiles view.
The first step is to look into the Gearmand job service.
Check the Gearmand status by running
gearadmin --status:
[root@server ~]# gearadmin --status
executejob      0       0       40
Column 0 |
Job name |
Column 1 |
Pending jobs |
Column 2 |
Jobs being executed |
Column 3 |
Number of workers who can handle this job |
Check if the number of workers matches with the ones we have defined in the file
/usr/share/opennac/api/application/configs/api.ini:
[production]
resources.log.syslog.filterParams.priority = 7
queue.workers = "40"
kibana.version = "7.2.0"
In our example, it does match since both display 40 workers.
Restart the Gearmand service:
[root@server ~]# systemctl restart gearmand
Check the status of the Gearmand service:
[root@server ~]# systemctl status gearmand
  gearmand.service - Gearmand distributed job system
   Loaded: loaded (/usr/lib/systemd/system/gearmand.service; enabled; vendor preset: disabled)
   Active: active (running) since Mon 2023-09-25 08:27:37 CEST; 3 weeks 1 days ago
  Process: 796 ExecStart=/usr/sbin/gearmand -d --log-file none --syslog $OPTIONS (code=exited, status=0/SUCCESS)
 Main PID: 815 (gearmand)
    Tasks: 7 (limit: 23214)
   Memory: 6.2M
   CGroup: /system.slice/gearmand.service
           └─815 /usr/sbin/gearmand -d --log-file none --syslog
If the information related to ‘Active:’ in the status output is not ‘active,’ please contact our support team.
Restart OpenNAC:
[root@server ~]# systemctl restart opennac
Check the OpenNAC status:
[root@server ~]# systemctl status opennac
  opennac.service - OpenNac
   Loaded: loaded (/etc/systemd/system/opennac.service; enabled; vendor preset: disabled)
   Active: active (running) since Mon 2023-09-25 08:27:39 CEST; 3 weeks 1 days ago
  Process: 1825 ExecStart=/usr/share/opennac/queues/worker/workers.sh start (code=exited, status=0/SUCCESS)
 Main PID: 1867 (php)
    Tasks: 41 (limit: 23214)
   Memory: 68.8M
   CGroup: /system.slice/opennac.service
           ├─   1867 php /usr/share/opennac/queues/worker/worker.php
If the information related to ‘Active:’ in the status output is not ‘active,’ please contact our support team.
5.2.5.6.22. RADIUS
The RADIUS service is the heart of 802.1x authentication and runs on the cores.
If the RADIUS service is in a Critical state, it will impact the services. To resolve this issue, restart the RADIUS service and then check its status by running:
[root@server ~]# systemctl restart radiusd

[root@server ~]# systemctl status radiusd

  radiusd.service - FreeRADIUS high performance RADIUS server.
   Loaded: loaded (/usr/lib/systemd/system/radiusd.service; enabled; vendor preset: disabled)
   Active: active (running) since Wed 2022-07-27 14:40:49 CEST; 2s ago
  Process: 3829227 ExecStart=/usr/sbin/radiusd -d /etc/raddb (code=exited, status=0/SUCCESS)
  Process: 3829223 ExecStartPre=/usr/sbin/radiusd -C (code=exited, status=0/SUCCESS)
  Process: 3829217 ExecStartPre=/bin/sh /etc/raddb/certs/bootstrap (code=exited, status=0/SUCCESS)
  Process: 3829215 ExecStartPre=/bin/chown -R radiusd.radiusd /var/run/radiusd (code=exited, status=0/SUCCESS)
 Main PID: 3829229 (radiusd)
    Tasks: 6 (limit: 101034)
   Memory: 78.1M
   CGroup: /system.slice/radiusd.service
          └─3829229 /usr/sbin/radiusd -d /etc/raddb

Jul 27 14:40:49 server systemd[1]: Starting FreeRADIUS high performance RADIUS server....
Jul 27 14:40:49 server systemd[1]: Started FreeRADIUS high performance RADIUS server..
If in the status output the information related to “Active:” is not “active”, please contact our support team.
5.2.5.6.23. RADIUS_CERTIFICATE
The RADIUS_CERTIFICATE healthcheck verifies the expiration time of the RADIUS certificates. The check will start alerting 60 days before the certificate expires.
If the certificate finally expires, the RADIUS service will be affected. This requires the generation of new certificates for the servers
Please contact our support team, since this requires the generation of new certificates for the servers.
5.2.5.6.24. REMOTEQUEUE
The REMOTEQUEUE healthcheck, verifies that the Sensor can establish connections with the Core server queues, allowing it to submit Visibility Jobs effectively.
If you find it in a critical state, it could have a negative impact on the visibility data. In this context, the validation required is simply confirming that you can establish connectivity with the Core server:
[root@server ~]# ping oncore -c 1
PING ldap.mydomain.com (192.168.10.1): 56 data bytes
64 bytes from 192.168.10.1: icmp_seq=0 ttl=127 time=77.863 ms

--- 192.168.10.1 ping statistics ---
1 packets transmitted, 1 packets received, 0.0% packet loss
round-trip min/avg/max/stddev = 77.863/77.863/77.863/0.000 ms
[root@server ~]# gearadmin -h oncore --status
executejob      0       0       25
If, in the gearadmin output, you do not have the executejob line, please contact our support team.
5.2.5.6.25. SYSTEM_INFO
The SYSTEM_INFO healthcheck verifies the system role, the version of Core and Workers.
Unless some manual intervention is performed with the clear objective of changing the role in the healthcheck configuration, the role should not change as the servers keep their roles fixed.
This Healthcheck is for informational purposes only, not related to the failure of any service, to facilitate the identification of the server role. The status will only change to WARNING or CRITICAL if the healthcheck script does not run.
5.2.5.6.26. SYSTEM_LOAD
The SYSTEM_LOAD healthcheck verifies the system load occupancy using the load average.
In case you find it in a critical state, restart is the HTTP service and check its status:
[root@server ~]# systemctl restart httpd

[root@server ~]# systemctl status httpd
  httpd.service - The Apache HTTP Server
   Loaded: loaded (/usr/lib/systemd/system/httpd.service; enabled; vendor preset: disabled)
  Drop-In: /usr/lib/systemd/system/httpd.service.d
           └─php-fpm.conf
   Active: active (running) since Wed 2022-07-27 10:28:55 CEST; 6s ago
     Docs: man:httpd.service(8)
  Process: 3152195 ExecReload=/usr/sbin/httpd $OPTIONS -k graceful (code=exited, status=0/SUCCESS)
 Main PID: 3747417 (httpd)
   Status: "Started, listening on: port 443, port 80"
    Tasks: 278 (limit: 101034)
   Memory: 51.1M
   CGroup: /system.slice/httpd.service
           ├─3747417 /usr/sbin/httpd -DFOREGROUND
           ├─3747419 /usr/sbin/httpd -DFOREGROUND
           ├─3747420 /usr/sbin/httpd -DFOREGROUND
           ├─3747421 /usr/sbin/httpd -DFOREGROUND
           ├─3747422 /usr/sbin/httpd -DFOREGROUND
           └─3747647 /usr/sbin/httpd -DFOREGROUND

Jul 27 10:28:55 server systemd[1]: Starting The Apache HTTP Server...
Jul 27 10:28:55 server httpd[3747417]: AH00558: httpd: Could not reliably determine the server's fully qualified domain name, using 192.168.0.100. Set the 'ServerName' directive globally to suppress this message
Jul 27 10:28:55 server systemd[1]: Started The Apache HTTP Server.
Jul 27 10:28:55 server httpd[3747417]: Server configured, listening on: port 443, port 80
If the status output does not indicate “Active: active”, please contact our support team.
5.2.5.6.27. TIME_SYNC
The TIME_SYNC healthcheck ensures that all servers have the correct time, and they rely on an NTP server for this.
If you find it in a critical state, you should manually sync the time with the NTP server by using the following commands:
[root@server ~]# systemctl restart chronyd

[root@server ~]# systemctl status chronyd

  chronyd.service - NTP client/server
   Loaded: loaded (/usr/lib/systemd/system/chronyd.service; enabled; vendor preset: enabled)
   Active: active (running) since Wed 2022-07-27 17:00:52 CEST; 14s ago
     Docs: man:chronyd(8)
           man:chrony.conf(5)
  Process: 1895701 ExecStopPost=/usr/libexec/chrony-helper remove-daemon-state (code=exited, status=0/SUCCESS)
  Process: 1895712 ExecStartPost=/usr/libexec/chrony-helper update-daemon (code=exited, status=0/SUCCESS)
  Process: 1895706 ExecStart=/usr/sbin/chronyd $OPTIONS (code=exited, status=0/SUCCESS)
 Main PID: 1895710 (chronyd)
    Tasks: 1 (limit: 101034)
   Memory: 952.0K
   CGroup: /system.slice/chronyd.service
           └─1895710 /usr/sbin/chronyd

[root@server ~]# chronyc makestep
200 OK
Refer to the Troubleshooting section for assistance with resolving issues related to the Chrony service.
If in the status output the information related to “Active:” is not “active”, or if the alert continues after two minutes of running the command, please contact our support team.
5.2.5.6.28. UDS
The User Data Sources are databases integrated with OpenNAC for user authentication. If a database displays a Warning status, the initial checking process involves three steps:
Review UDS
Access the Administration Portal > ON CMDB > User Data Sources and ensure that the User Data Source is correctly configured.
Review communication
If the the User Data Source is correctly configured, the next step is to check that the OpenNAC server can reach the LDAP Host and that it can also reach the LDAP Port:
[root@server ~]# ping ldap.mydomain.com -c 1
PING ldap.mydomain.com (192.168.10.1): 56 data bytes
64 bytes from 192.168.10.1: icmp_seq=0 ttl=127 time=77.863 ms

--- 192.168.10.1 ping statistics ---
1 packets transmitted, 1 packets received, 0.0% packet loss
round-trip min/avg/max/stddev = 77.863/77.863/77.863/0.000 ms

[root@server ~]# telnet 192.168.10.1 389
Trying 192.168.10.1...
Connected to 192.168.10.1.
Escape character is '^]'.
exit
Connection closed by foreign host.
Review user
If the data is correct and the server manages to reach the LDAP Port of the LDAP Host, then the last check would be to validate that the user and password are correct and that the user is not blocked in the LDAP.
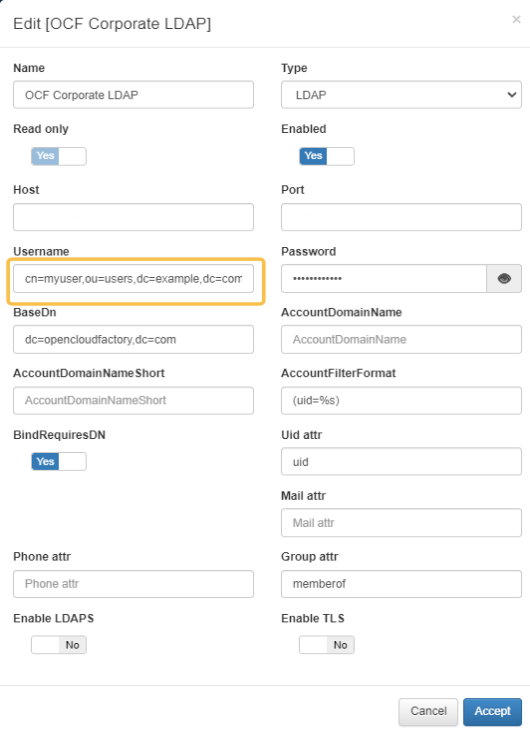
You can use the ldapsearch command to search for information in an LDAP directory type of User Data Sources:
ldapsearch -x -LLL -D "cn=myuser,ou=users,dc=example,dc=com"
-x
It means that you will provide the bind DN (Distinguished Name) and password as plain text
-LLL
It tells ldapsearch to omit certain information and only display the attribute values.
-D
This is the DN for the account that you’re using to authenticate to the LDAP server.
Go to the Administration Portal > ON CMDB > User Data Sources, select the LDAP type of UDS and click on edit to display the account information used in the ldapsearch:
By using the NTLM (NT LAN Manager) protocol, you can verify authentication errors in the Active Directory type of User Data Sources.
Example of wrong username:
[root@server ~]# /usr/share/opennac/healthcheck/libexec/check_ntml.sh -u notauser -p P@ssword
ERROR (notauser): NT_STATUS_NO_SUCH_USER: The specified account does not exist. (0xc0000064)
Example of wrong password:
[root@server ~]# /usr/share/opennac/healthcheck/libexec/check_ntml.sh -u binding -p 123456
ERROR (binding): NT_STATUS_WRONG_PASSWORD: When trying to update a password, this return status indicates that the value provided as the current password is not correct. (0xc000006a)
At the end, if all the data is correct, the OpenNAC server can reach the LDAP Host and the user and password were checked, but the problem persists, please contact our support team.