2.3.3.1. ON Aggregator basic configuration
In this section, we can find the basic configuration for the ON Aggregator component.
The default SSH access for all images username/password is root/opennac.
Warning
Change the default password to a stronger password.
2.3.3.1.1. Network configuration
ON Aggregator OVAs come configured with two network interfaces (eth0 and eth1). We can use the eth0 interface as a management and communication interface between nodes.
We will edit the network configuration of the eth0 interface (address 192.168.56.253/24 is taken as an example):
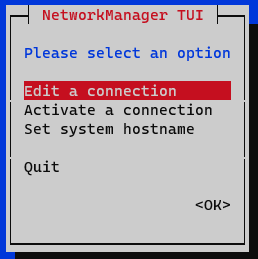
To assign said IP, we execute the graphical network manager:
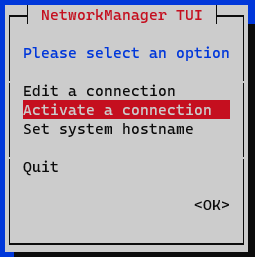
nmtui
In the initial window, we select Edit a connection.
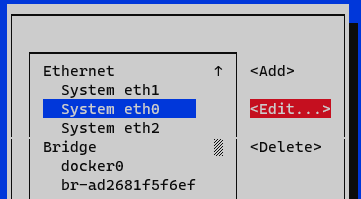
The node interfaces will appear, select the desired interface and press Edit.
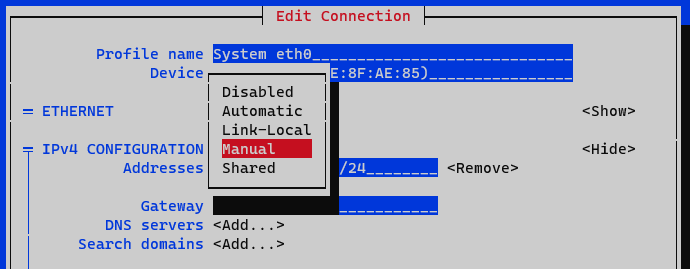
In the IPv4 Configuration section, we select Manual.
We display the IPv4 configuration by selecting the <Show> option
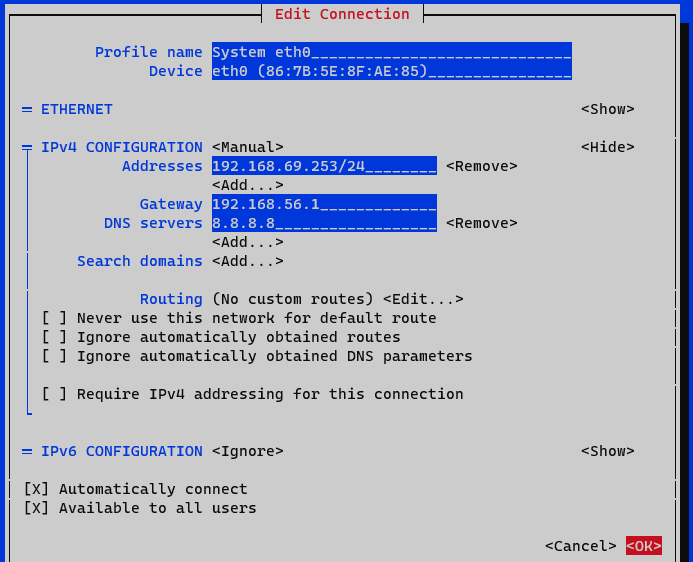
Addresses: We add the IP of the node with the corresponding network mask (<IP>/<MASK>).
Gateway: We add the gateway of the node.
DNS Servers: We add a DNS server (for example, Google).
We mark the option Require IPv4 addressing for this connection.
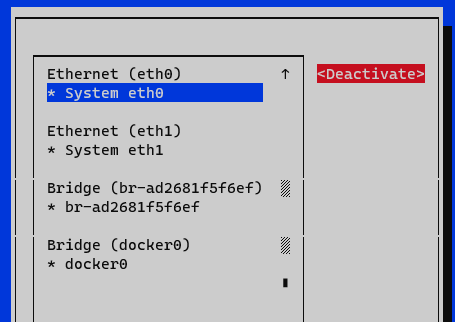
We finish by clicking on <OK> at the bottom. At this point, we must activate and deactivate the interface to apply the changes to the interface that we have edited. In the menu we select the option Activate a connection.
We deactivate and activate the interface and return to the initial menu.
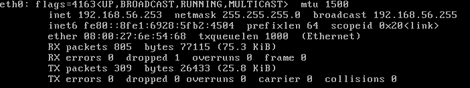
Now we have the node configured, we can verify it with the command ifconfig or ip a:
We must modify the /etc/hosts file and include the appropriate address of ON Aggregator (127.0.0.1 in case there is no infrastructure in cluster mode) identified as onaggregator and onanalytics as well as the other nodes, onprincipal, and onsensor in case of forming part of the module architecture. An example is shown below:
vim /etc/hosts
127.0.0.1       localhost localhost.localdomain localhost4 localhost4.localdomain4
::1             localhost localhost.localdomain localhost6 localhost6.localdomain6
127.0.0.1       onanalytics
127.0.0.1       onaggregator
192.168.56.254      onprincipal
192.168.56.252      onsensor
10.10.10.184        onvpngw
2.3.3.1.2. Change the hostname
To modify the hostname of the node we must use the following command:
hostnamectl set-hostname <hostname>
We recommend using the same name defined in the previous section (/etc/hosts), in this case, onaggregator.
Once the hostname has been modified, it will be necessary to restart to apply the changes.
reboot
To verify the hostname and obtain information about the equipment we can use the hostnamectl command.
2.3.3.1.3. Iptables configuration
It is necessary the configuration of the iptables.
First of all, we need to copy the aggregator iptables template to the iptables file:
yes | cp /usr/share/opennac/aggregator/iptables_aggregator /etc/sysconfig/iptables
To have the aggregator iptables correctly we need to substitute the node variables in of the following files:
vi /etc/sysconfig/iptables
# sample configuration for iptables service
# you can edit this manually or use system-config-firewall
# please do not ask us to add additional ports/services to this default configuration
*filter
:INPUT ACCEPT [0:0]
:FORWARD ACCEPT [0:0]
:OUTPUT ACCEPT [0:0]
-A INPUT -m state --state RELATED,ESTABLISHED -j ACCEPT
-A INPUT -p icmp -j ACCEPT
-A INPUT -i lo -j ACCEPT
# SNMP rule would be enabled only from openNAC Core IPs
#-A INPUT -s <oncoreXX_ip> -p udp -m state --state NEW -m udp --dport 161 -j ACCEPT
# SSH port
-A INPUT -p tcp -m state --state NEW -m tcp --dport 22 -j ACCEPT
# AGGREGATOR ports
## LOGSTASH
#-A INPUT -s <oncoreXX_ip> -p tcp -m state --state NEW -m tcp --dport 5000 -j ACCEPT
#-A INPUT -s <onsensorXX_ip> -p tcp -m state --state NEW -m tcp --dport 5001 -j ACCEPT
-A INPUT -j REJECT --reject-with icmp-host-prohibited
-A FORWARD -j REJECT --reject-with icmp-host-prohibited
COMMIT
Finally, restart the iptables service:
systemctl restart iptables
2.3.3.1.4. NTP Configuration
We must stop the NTP server before modifying its parameters, we must enter a valid NTP server, for example hora.roa.es:
systemctl stop chronyd
If you have your own NTP server, it can be configured.
The /etc/chrony.conf file is modified and the appropriate servers are included:
server <ip_server_ntp>
We can also add an NTP pool with the line:
pool <IP_pool_ntp>
The file is saved and the service is started:
systemctl start chronyd
2.3.3.1.5. Repository configuration and corporate proxy
Before updating the nodes, it is necessary:
The nodes have access to the internet, either directly or through a corporate proxy.
Access credentials to OpenNAC repositories for solution updates.
For this we can use the configUpdates.sh script available on each node.
In ON Aggregator we will find the script in:
/usr/share/opennac/analytics/scripts/configUpdates.sh
Corporate Proxy Authorization:
/usr/share/opennac/analytics/scripts/configUpdates.sh --proxy --add --proxyurl="http://<PROXY_IP>:<PROXY_PORT>"

Repository credentials:
/usr/share/opennac/analytics/scripts/configUpdates.sh --repo --add

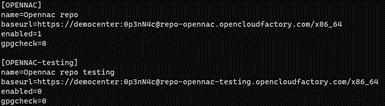
We can verify the correct configuration of the repository in the /etc/yum.repos.d/opennac.repo file:
2.3.3.1.6. Update to latest version
One of the recommended steps to take when the system is newly deployed is to update it to the latest version available.
To update the ON Aggregator machine, go to the ON Aggregator Update Section. Once the update is finished, we must continue at from same point.
2.3.3.1.7. Healthcheck configuration
Healthcheck is the system monitoring module. It has service controls that ensure that all necessary system services are running properly.
On a fresh installation of ON Aggregator, the first step is to check if the package is installed:
rpm -qa | grep opennac-healthcheck
If the healthcheck package is not installed, we need to install it:
dnf install opennac-healthcheck -y
After installing it, we need to configure it:
cd /usr/share/opennac/healthcheck/
cp -rfv healthcheck.ini.aggregator healthcheck.ini
2.3.3.1.8. Services Configuration
To start the ON Aggregator services, we need to activate logstash service and redis, use the following commands:
systemctl start logstash
systemctl start redis
In case we have any issues that may arise related to Logstash data processing or other issues, we go to the /var/log/logstash/logstash-plain.log file
Communication between Logstash and Kibana with Elasticsearch is done using TCP port 9200.
There is a cron task defined in /etc/cron.d/opennac-purge, which checks disk space. In the event that the disk occupancy is greater than 90%, the data is purged, from oldest to newest. This mechanism is a contingency mechanism. Controlling the proper purging must be done through the Curator.
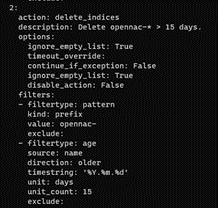
There is another cron task defined in /etc/cron.d/opennac-curator, that checks the number of days of stored information categorized by indexes. If you want to modify it, you have to go to /etc/elastCurator/action.yaml and modify the unit_count of each of the indexes:
For example, in the opennac-* index the information is deleted when it has been stored for 15 days by default:
2.3.3.1.9. Unnecessary Services
Since the ON Aggregator OVA contains the ON Sensor node services, it is necessary to disable and uninstall them from the system to improve performance.
Disable services:
systemctl stop dhcp-helper-reader
systemctl stop zeek
systemctl stop pf_ring
systemctl stop filebeat
systemctl disable dhcp-helper-reader
systemctl disable zeek
systemctl disable pf_ring
systemctl disable filebeat
Delete services:
dnf remove zeek filebeat opennac-dhcp-helper-reader pfring
When asked if you really want to delete the services, indicate yes by entering the letter Y.
2.3.3.1.10. Collectd configuration
Collectd is used to send the trending information to the ON Principal. To configure Collectd it is necessary to edit the following file:
vim /etc/collectd.d/network.conf
Inside the file we should have something like:
# openNAC collectd file
#
# This file *WON'T* be automatically upgraded with default configuration,
# due to is only configured in deployment stage

LoadPlugin "network"

## When this server is a Core Principal or
## collect all data from other nodes
## Default port: 25826
#<Plugin "network">
#        <Listen "{{ principal_IP }}">
#                SecurityLevel "Encrypt"
#                AuthFile "/etc/collectd.d/auth_file"
#        </Listen>
#</Plugin>

## When this server send info to another
## server (ex. a Core Principal or similar)
## Default port: 25826
<Plugin "network">
    <Server "onprincipal">
            SecurityLevel "Encrypt"
            Username "opennac"
            Password "changeMeAsSoonAsPossible"
    </Server>
</Plugin>
To send the collectd messages with this device, we need to go to:
vi /etc/collectd.conf
We need to add the servers hostname in the hostname parameter.
#Hostname    "localhost"
Hostname    "onaggregator-XX"
Finally, it is necessary to restart the collectd service.
systemctl restart collectd
2.3.3.1.11. Send polevals to ON Core proxy
To prevent overloading the ON Core principal with polevals to the API, we can send them through the ON Core Proxy to distribute the load among the various ON Core Workers that we have.
Before configuring this setup, ensure you have already configured the haproxy service.
Polevals are send from the following file:
/etc/logstash/conf.d/999_output.conf
Replace the IP address of the oncore with the IP address of the onproxy in the /etc/hosts file.
Finally, restart the Logstash service to apply this configuration:
systemctl restart logstash
Note
onproxy: needs to be defined in /etc/hosts
2.3.3.1.12. Logstash variables
The following variables in /etc/default/opennac need to be configured to have a customized use of logstash service:
# Opennac API Key necessary to send polevals to the ON Core.
OPENNAC_API_KEY=9119e06c-5f73-11ed-8e12-30392d707269
# For Palo Alto logs, it is necessary to add the PA Network Device IP in the following variable
OPENNAC_NETDEV_IP="10.10.39.18"
# IP where we have the REDIS running to manage the petitions to OpenNAC database.
OPENNAC_REDIS_HOST="127.0.0.1"
#This parameter is used to enable device discovery functionality through ARP Broadcast packets.
#WARNING, activating this feature in routed environments can cause discovery errors, see the documentation before activating it.
ARP_REQ_DISCOVERY="false"
#This parameter is only used on packet updates. The format for multiple hosts is '"onanalytics:9200","onanalytics2:9200","etc"'
OPENNAC_ES_HOSTS='"onanalytics:9200"'
#This parameter is used to enable kibana data anonymization that will be injected in identities index-pattern.
OPENNAC_ELK_ANONYMIZATION="false"
#This parameter is used to enable the logstash KERBEROS polevals.
LOGSTASH_OUTPUT_KERBEROS="true"
#This parameter is used to enable the logstash MACDISCOVER polevals.
LOGSTASH_OUTPUT_MACDISCOVER="false"
#This parameter is used to enable the logstash PA polevals.
LOGSTASH_OUTPUT_PA="true"
#This parameter is used to enable the logstash TM polevals.
LOGSTASH_OUTPUT_TM="true"
#This parameter enables IPv6 for bro logs
BRO_IPV6="false"
#This paramater is used to avoid sending all notice arp, conn and dns logs to reduce the number of logs.
ALL_LOGS="false"
# This parameter allows discover new devices in access vlans,
# when ARP packets are not received due to network configuration.
# WARNING, activating this feature in routed environments can cause discovery errors, see the documentation before activating it.
DISCOVER_MACADDRESS_IN_ACCESS_VLANS="false"
# This parameter allows parse Syslog events,
# related on switch trunk ports, using 'external_syslog' pipeline.
SYSLOG_PARSE_SWITCH_TRUNK_PORT="false"
# This parameter indicates trunk ports to be analyzed, when option is enabled
SYSLOG_SWITCH_TRUNK_PORT_LIST="[1,48]"
# This parameter indicates command to be executed when trunk ports option is enabled.
# Additionaly, the Gearman message will be added at the end of command line in JSON format.
SYSLOG_SWITCH_TRUNK_PORT_COMMAND="/usr/share/opennac/aggregator/scripts/switch_trunk_port_cmd.sh"
2.3.3.1.12.1. DISCOVER_MAC_ADDRESS_IN_ACCESS_VLANS
When we have a infrastructure with access VLAN traffic captured, in “connections” file from Zeek (bro-conn), there is a line for each connection where we can find the source MAC Address, the source IP address and the source VLAN.
If the VLAN information is not received in Zeek connections log, we need to edit the following file:
/opt/zeek/share/zeek/site/local.zeek
We need to add the following lines:
# Uncomment the following line to enable logging of connection VLANs. Enabling
# this adds two VLAN fields to the conn.log file.
@load policy/protocols/conn/vlan-logging
Finally, zeek need to be restarted:
systemctl restart zeek
If all ARP packets would be received, we could discover all devices in these access VLANs, but in some cases, some of these ARP packets are missing, so we want parse connections file to discover all devices.
Using this information, we have to discard all non access VLANs and all network devices MAC Address used in NAT processes, so we could maintain the VLANs and MAC Address to exclude in Redis keys to retrieve.
The blacklisted VLANs and MAC Address need to be injected manually to Redis with the following format:
discover_mac_excluded_mac_<MAC>
discover_mac_excluded_vlan_<VLAN>