4.1.4. Configuration
To follow this configuration process, all nodes required for this use case (ON Core and ON Analytics, and optionally ON Sensor and ON Agent) must have been properly deployed, following the node deployment and basic configuration section.
The main purpose of this section is:
Perform the correct configuration of all necessary nodes for the Visibility module.
Configure the different services used by the system.
Understand through examples, the necessary configuration for network devices.
Note
Since the Visibility module can make use of some functionalities of network devices from different manufacturers, it is necessary that you have the necessary knowledge to configure these devices.
This section will show configuration examples for specific models. It is up to the users to extrapolate these configurations to the network devices they have available.
Below are the steps for specific configuring the nodes for the Visibility use case to become operational.
4.1.4.1. ON Analytics Configuration
After deploying the ON Analytics node and doing the initial configuration, it is necessary to do the following configurations for the proper functioning of the Visibility module.
4.1.4.1.1. API Key configuration
To allow ON Analytics (starting from ON Sensor information) to send information to ON Core, it is necessary to have an API key to send calls to the ON Core API.
We must generate this key on the ON Core Web Administration Portal and add it to the ON Analytics machine.
In ON Core:
Click on Add new and fill the Enable API key only for source IP field with the ON Analytics IP.
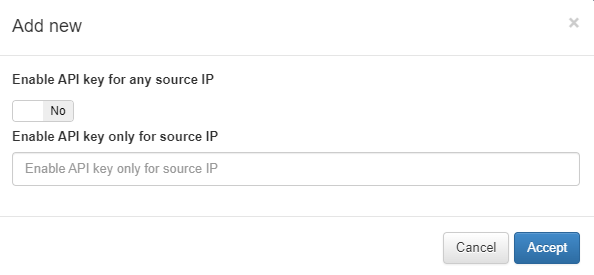
This generated API key will be the one used by ON Analytics.
In On Analytics:
Modify the /etc/default/opennac file.
The OPENNAC_API_KEY field with the generated API Key.
The field OPENNAC_NETDEV_IP with the Aggregator IP address. If you do not have a separated Aggregator node, this IP should be the ON Analytics since this one is also working in Aggregator mode.
4.1.4.1.2. (Optional) Configure NetFlow, SFlow or/and IPFix analysis
Since release 7544 of version 1.2.0-5, system allows analysis and device Discovery through NetFlow (Cisco), SFlow or IPFix optional.
Note
To enable this functionality, the minimum hardware recommended is (64 GB RAM, 16 cores, 2NIC’s) in ON Analytics.
4.1.4.1.2.1. Second interface configuration
SSH or access to the ON Analytics CLI and log in using root user (default access: root / opennac).
Configure the second interface where flows will be collected. This interface can be eth1 and it is necessary to configure a local IP Address.
To configure such an IP Address, execute the graphic Network Manager:
nmtui
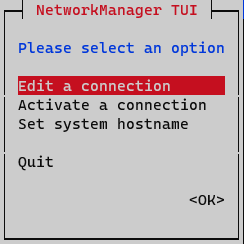
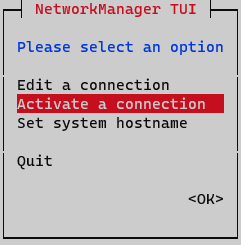
On the initial window, select Edit a connection
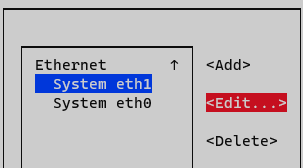
Select the interface and press Edit
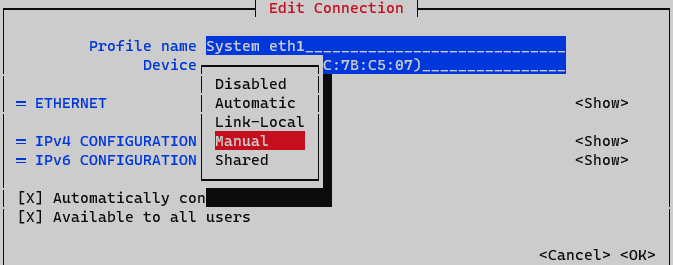
On IPv4 Configuration select Manual. Display IPv4 configuration selecting option <Show>
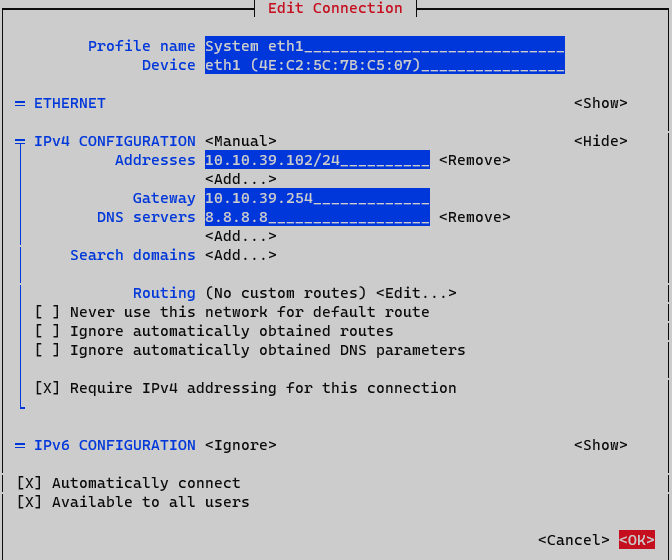
Addresses: Add node IP address with netmask (<IP>/<MASK>)
Gateway: Add default gateway
DNS Servers: Add a DNS server (ex. Google)
Set option Require IPv4 addressing for this connection. Finalize by clicking <OK> at the bottom.
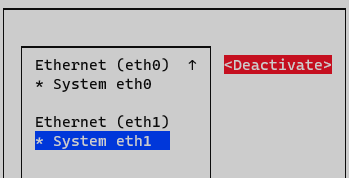
At this point, you need to activate and deactivate the interface to apply changes. On Network Manager menu, select option Activate a connection.
Deactivate and active interface and go back to initial menu.
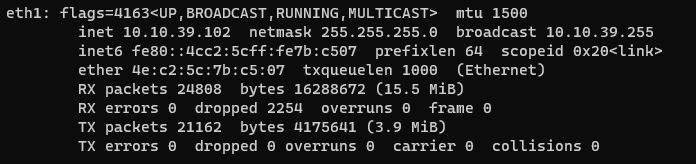
Interface is now configured and can be verified by typing the following command in CLI “ifconfig” o “ip a”
ifconfig
4.1.4.1.2.2. NetFlow, SFlow and/or IPFix analysis configuration
First Logstash JVM memory size must be changed. It is necessary to have at least 4GB for logstash, 6GB would be the best size. Edit the file /etc/logstash/jvm.options and change the Xms<size>g and the Xmx<size>g:
-Xms4g
-Xmx4g
The next step is to enable the Flow pipeline. Edit /etc/logstash/pipelines.yml and uncomment the following code lines:
#- pipeline.id: elastiflow
#  path.config: "/etc/logstash/elastiflow/conf.d/*.conf"
Add the following rules to iptables /etc/sysconfig/iptables (SFlow UDP port 6343, IPFix UDP port 4739 and NetFlow UDP port 2055):
-A INPUT -p udp --dport 6343 -j ACCEPT
-A INPUT -p udp --dport 4739 -j ACCEPT
-A INPUT -p udp --dport 2055 -j ACCEPT
This rules can be added after rule “-A INPUT -i lo -j ACCEPT”. Once the new rules are added, restart iptables service to apply changes:
systemctl restart iptables
Verify that JVM size for Elasticsearch is configured correctly and defined as 50% of system RAM capacity. To check total system RAM run:
dmidecode -t 16
Edit the file /etc/elasticsearch/jvm.options and change the Xms<size>g and the Xmx<size>g:
-Xms32g
-Xmx32g
When modifying Elasticsearch JVM properties, restart the service:
systemctl restart elasticsearch
Restart service Logstash (restarting can take several minutes as there are many objects to load):
systemctl restart logstash
Do the additional configuration on the network device (explained below in this same page), by activating NetFlow (Cisco), SFlow, or IPFix features to send packets to the ON Analytics server.
4.1.4.1.2.3. Logstash Pipeline validation
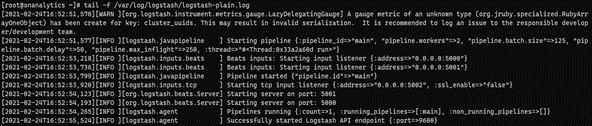
Verify that logstash service is running pipeline filters correctly issuing the following command:
tail -f /var/log/logstash/logstash-plain.log
This command will show the Logstash pipeline status:
4.1.4.1.3. ARP Request Discovery
The ARP Request Discovery functionality enables the discovery of devices connected to the network through ARP Request packets. The workflow is as follows:
The ON Sensor node sniffs network traffic, analyzes it, and generates logs from this information.
The logs containing the sniffed traffic are then transmitted to the ON Aggregator (or ON Analytics in smaller architectures).
The ON Aggregator processes the received information, specifically focusing on ARP traffic.
If ARP Request Discovery is active, the ON Aggregator notifies the ON Core with the MAC source-IP source relation obtained from the ARP Request.
This notification is processed in the ON Core as a Discovery event of type IPMac.
In environments with gateways, routers have the ability to alter the source of ARP Request packets as they exit the broadcast domain. This could lead to inconsistencies and inaccuracies in the data analyzed by the ON Sensor node.
Note
It is crucial for the ON Sensor to capture traffic on a non-routed network and have access to the original MAC address of the source ARP Request packet.
Only proceed with configuring ARP Request Discovery if your network meets the requirements.
To activate the functionality, modify a file in the ON Analytics node.
1. Open the /etc/default/opennac file.
2. Modify the variable ARP_REQUEST-DISCOVERY. By default, this value is set to false. To activate the functionality you must set it to true:
[root@analytics01 ~]# cat /etc/default/opennac
    # Opennac API Key necessary to send polevals to the ON Core.
OPENNAC_API_KEY=9119e06c-5f73-11ed-8e12-30392d707269
# For Palo Alto logs, it is necessary to add the PA Network Device IP in the following variable
OPENNAC_NETDEV_IP="10.10.39.18"
# IP where we have the REDIS running to manage the petitions to OpenNAC database.
OPENNAC_REDIS_HOST="127.0.0.1"
#This parameter is used to enable device discovery functionality through ARP Broadcast packets.
#WARNING, activating this feature in routed environments can cause discovery errors, see the documentation before activating it.
ARP_REQ_DISCOVERY="false"
#This parameter is only used on packet updates. The format for multiple hosts is '"onanalytics:9200","onanalytics2:9200","etc"'
OPENNAC_ES_HOSTS='"onanalytics:9200"'
#This parameter is used to enable kibana data anonymization that will be injected in identities index-pattern.
OPENNAC_ELK_ANONYMIZATION="false"
#This parameter is used to enable the logstash KERBEROS polevals.
LOGSTASH_OUTPUT_KERBEROS="true"
#This parameter is used to enable the logstash MACDISCOVER polevals.
LOGSTASH_OUTPUT_MACDISCOVER="false"
#This parameter is used to enable the logstash PA polevals.
LOGSTASH_OUTPUT_PA="true"
#This parameter is used to enable the logstash TM polevals.
LOGSTASH_OUTPUT_TM="true"
#This parameter enables IPv6 for bro logs
BRO_IPV6="false"
#This paramater is used to avoid sending all notice arp, conn and dns logs to reduce the number of logs.
ALL_LOGS="false"
# This parameter allows discover new devices in access vlans,
# when ARP packets are not received due to network configuration.
# WARNING, activating this feature in routed environments can cause discovery errors, see the documentation before activating it.
DISCOVER_MACADDRESS_IN_ACCESS_VLANS="false"
3. After modifying and saving the changes to the file, restart the Logstash service to apply the updates:
[root@onanalytics ~]# systemctl restart logstash
The service might take a few minutes to restart, so it is important not to interrupt this process.
4.1.4.2. ON Sensor Configuration
ON Sensor intends to decode protocols and offer advanced visibility of the network. This information and events are sent to ON Analytics or ON Aggregator according to the architecture designed.
Processes or main services on which the system is based are:
DHCP Helper Reader to discover devices using DHCP packets
PF_RING to capture network packets
Zeek (BRO) to analyze traffic
Filebeat to send data to a host (ON Analytics or ON Aggregator)
4.1.4.2.1. DHCP-Helper-Reader configuration
DHCP-Helper-Reader service can be executed on ON Core acting as a DHCP Relay, receiving, and redirecting DHCP requests. In case this method is not possible due to environmental limitations, DHCP-Helper-Reader services can be configured on the ON Sensor server.
The main difference between configuring DHCP Helper Reader on ON Core or on ON Sensor is that ON Sensor will act in a passive role and will process requests captured over the SPAN port.
Note
By default, the DHCP-Helper-Reader runs on the eth1 interface, in case the SPAN interface changes, you need to modify the /etc/sysconfig/dhcp-helper-reader file.
Depending on the server where dhcp-helper-reader is running, you need to configure some parameters by commenting or uncommenting them, as explained in the /etc/sysconfig/dhcp-helper-reader file.
Note that the last commented lines are mostly informative, and you must read them carefully to determine whether you need to uncomment them or edit other files.
# Command line options here
# If running on a core, the default option configured will listen port 67 on all interfaces
# and connect to redis on master node and gearmand on localhost.
# "-s onprincipal"
OPTIONS="-s onprincipal"

# If running on a sensor, configure as below:
#OPTIONS="-r <interfaz> -s onprincipal -q <ip_oncore>"

##############################################
# If you need to run with DHCPD service:
#To redirect DHCP messages from IP Helper to "dhcp-helper-reader" process:
#
#* Add iptables redirect:
#iptables -A PREROUTING -p udp -m udp --dport 67 -j REDIRECT --to-ports 1067
#
#* Uncomment below:
#OPTIONS="-l 1067"
#
#* Restart "dhcp-helper-reader" process:
#service dhcp-helper-reader restart
###############################################
The parameters are:
-s : Redis server where read and write DHCP information is processed. By default, this is configured on ON Core with onprincipal role.
If it is running in ON Sensor:
-r : SPAN port interface where DHCP packets will be received. It is possible to configure several interfaces.
-q : Queue server where DHCP requests are redirected. By default, this is configured on ON Core with oncore role.
Restart the dhcp-helper-reader to apply changes:
systemctl restart dhcp-helper-reader
4.1.4.2.1.1. GRE or ERSPAN packet capturing
For the DHCP-Helper-Reader to capture GRE or ERSPAN packets, you need to apply a custom filter, as shown in the example provided below:
(proto gre and (ether[92:2]=67 or ether[92:2]=68)) or port 67 or (vlan and port 67) or (vlan and port 67)
The “ether” field (92) depends on the kind of packet traveling through the network. the position of the filter parameters can not be interchanged.
To determine the correct position in each situation or environment, you can use tcpdump to capture traffic in a PCAP file, where the required position will be displayed. Execute the following command:
tcpdump -i ens18 -w gre.pcap 'proto gre'
Note
“ens18” is the network card where we receive the GRE traffic.
The PCAP file in our example is called
gre.pcap.
After capturing a DHCP packet, pass the file to the dhcp-helper-reader to be able to see the debug information needed to apply the proper filter. Execute the following steps:
Stop the service:
systemctl stop dhcp-helper-reader
Now, start the service in debug mode, parsing only the information previously captured in the file:
dhcp-helper-reader -d -n -f gre.pcap
The output of this command will be something similar to the following example:
Pcap filter compiled: ""
Pcap filter installed
---------------------
New offset detected [100] [?], incrementing offset
PACKET FOUND, PORT SRC: 0068 DST: 0067, FOUND AT POS:92,94, DHCP PACKET FOUND AT OFFSET:100
sec 1705507314:usec 972672 (len 387, headerlen 100, dhcp len 287,hops 0, transaction id 0x0005b)
INIT EXTRACT_INFO
ALLOCATE GEARMAN CLIENT
POST INIT
HEADER op[1] htype[1] hlen[6] hops[1] xid[0x5b000000]
PRE WHILE buffer_limit[147] offset[4]
DHCP Msg Type 3
...
Where the “PACKET FOUND” line indicates the position, and in this case, source port is located at position 92.
During the execution of the command, you may encounter alerts similar to the example below. This message appears for each packet captured that is not DHCP type.
root@onsensor sbin]# dhcp-helper-reader -d -n -f gre.pcap
Pcap filter compiled: ""
Pcap filter installed
---------------------
COULD NOT FIND DHCP MAGIC COOKIE last offset[134], packet not readable
UDP HEADER [0xeb220010]
PROTO HEADER [0x009a1f78]
You should wait until the entire content of gre.pcap is analyzed. If “PACKET FOUND” doesn’t display anything, it means that there are no DHCP packets in the gre.pcap file, and you should capture the gre.pcap file again.
Now you can modify the filter you want to use and apply it. First, run it by hand to check that everything is correct, with the command:
dhcp-helper-reader -d -n -r ens18 -c "(proto gre and (ether[92:2]=67 or ether[92:2]=68)) or port 67 or (vlan and port 67) or (vlan and port 67)" -s onprincipal -q oncore
Note
“ens18” is the network card where we receive the GRE traffic.
The output of this command will be something similar to the previous debug, where DHCP packets were parsed.
Finally, you can set these options to work by default on service start in the
/etc/sysconfig/dhcp-helper-readerfile. Execute a command following this example:
OPTIONS='-s onprincipal -q oncore -r ens18 -c "(proto gre and (ether[92:2]=67 or ether[92:2]=68)) or port 67 or (vlan and port 67) or (vlan and port 67)"'
Note
Note that the initial “double quotes” were replaced by ‘single quotes’ to avoid potential conflicts, given that double quotes are already used in the -c option with the customized filter.
4.1.4.2.2. Zeek configuration
First, connect to ON Sensor via SSH.
Zeek service has some plugins that allow improve visibility on the network. The most common plugins used and recommended are:
Vlan-logging: Allows to identify analyzed traffic VLAN on On Sensor.
Arp traffic: Allows to analyze ARP packets, to use it on discovering new devices.
To enable these plugins, edit the /opt/zeek/share/zeek/site/local.zeek file removing all “#” for each plugin:
# Uncomment the following line to enable logging of connection VLANs. Enabling
# this adds two VLAN fields to the conn.log file.
#@load policy/protocols/conn/vlan-logging

# Load policy for ARP inspector
#@load scripts/arp_main
Restart Zeek service to apply changes:
systemctl restart zeek
4.1.4.3. Network Device Configuration
According to the discovery method decided, configuration on network devices can be needed, this configuration will apply mainly on switches.
Configuration can include several elements or protocols depending on how the Visibility module is deployed. This can include Flows (NetFlow, SFlow), SPAN ports (SPAN, RSPAN, or ERSPAN), or SNMP Traps among others.
As an example, here are some simple configurations based on a Cisco Catalyst running IOS:
4.1.4.3.1. SNMP Traps configuration
In this section we present a basic SNMP configuration for a Cisco Catalyst Switch. Configurations may change depending on the model and version you are configuring.
Configure the SNMP iptables:
vi /etc/sysconfig/iptables
To enable the SNMP trap ports it is necessary to open the UDP ports 161 and 162:
-A INPUT -p udp -m state --state NEW -m udp --dport 161 -j ACCEPT
-A INPUT -p udp -m state --state NEW -m udp --dport 162 -j ACCEPT
First, define a host where SNMP Traps will be sent and a community. To accomplish this, type the following command (configure terminal):
snmp-server host <Host_IP> <community_string>
In this case <Host_IP> is IP address for ON Core service and <community_string> as “public”, for example.
To enable SNMP Traps, type the following command (configure terminal):
snmp-server enable traps <SNMP_Trap_type>
Note
If a specific trap is not defined, all SNMP Traps will enable.
Not all SNMP Traps collect relevant information for Discovery. Some SNMP Traps that collect visibility information are the mac-notification events. This could be:
mac-notification [change | move | threshold]
It is necessary to add to ON Core the following configuration about SNMP communities:
vi /etc/snmp/snmptrapd.conf
SNMP v2
On the authCommunity line, it is necessary to add all the RO community defined on the network device.
authCommunity log,execute,net public
Note
We can add multiple communities replying the line multiple times.
SNMP v3
We have to add the follwing configuration:
authUser log,execute,net <snmp-v3-user> auth
createUser -e <engfineID> <snmp-v3-user> <authentication-protocol> <authentication-password> <privacy-protocol> <privacy-password>
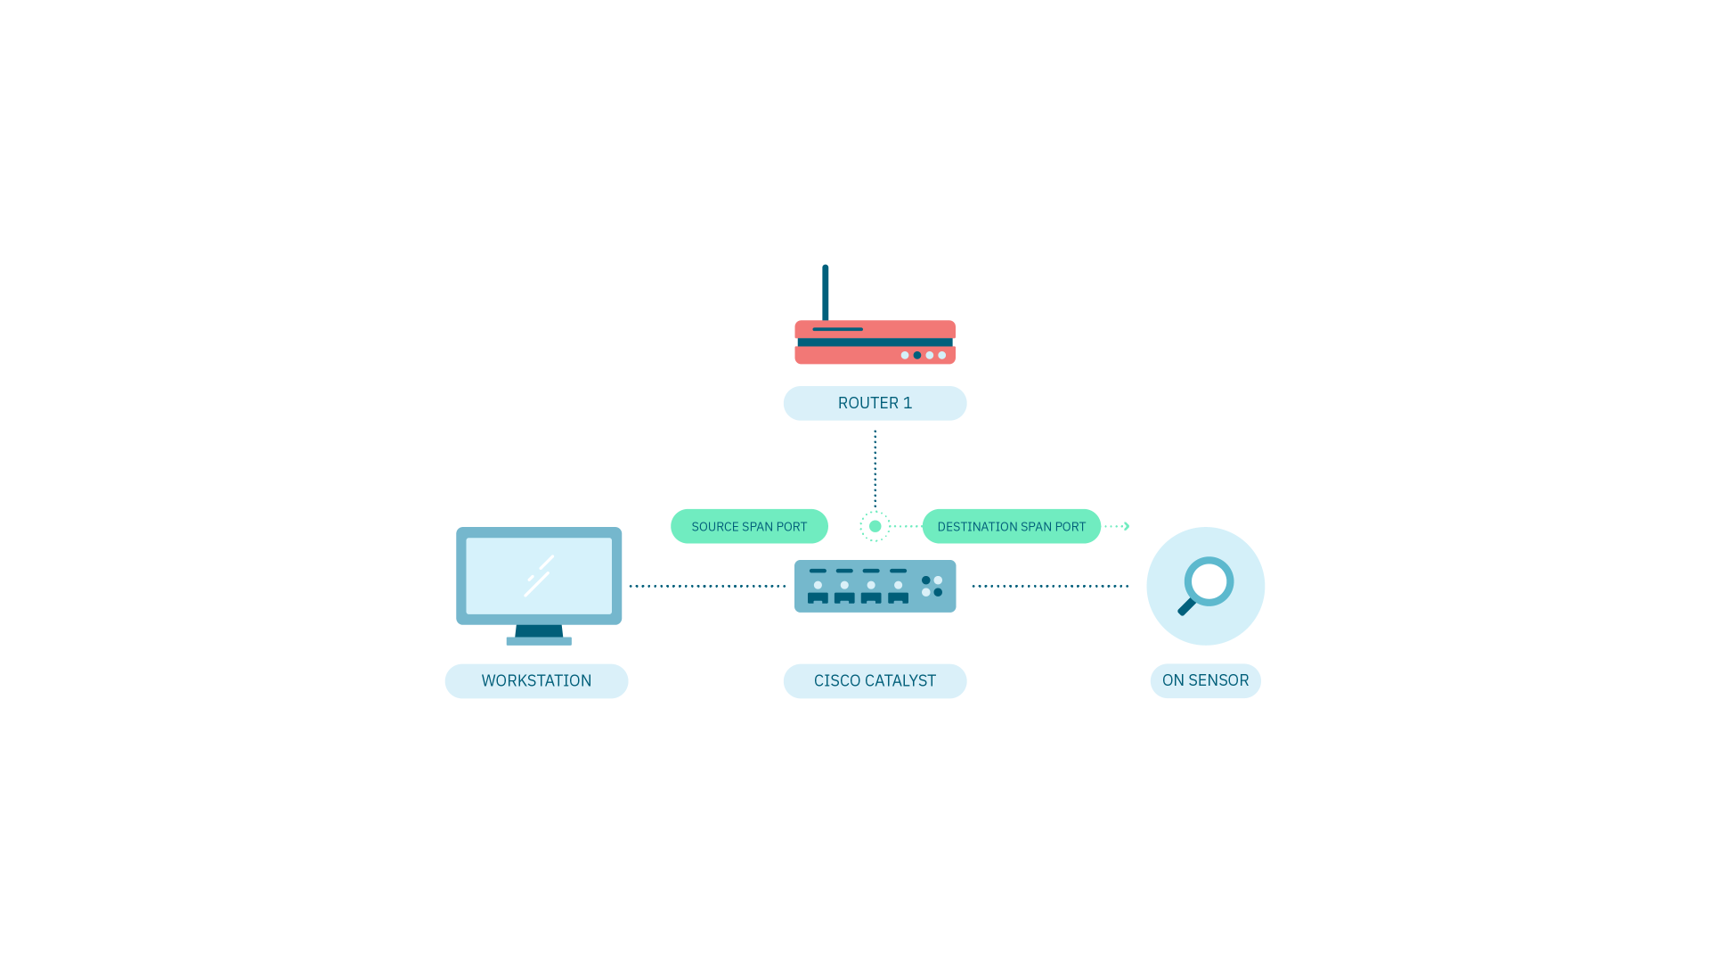
4.1.4.3.2. SPAN Port configuration
In this section we show a basic SPAN Port configuration for a Cisco Catalyst switch. Configuration may change depending on the model and version.
For this example, where SPAN port is configured on interface Fe0/1 (source) and mirrored to interface Fe 0/24 (destination) where On Sensor will be connected sniffing traffic
SSH to the switch and access to configuration mode (configure terminal) to define the Span Port interfaces.
First define the source SPAN Port, where the target traffic interface to mirror is:
monitor session 1 source interface fastethernet 0/1
Finally define the destination SPAN Port, where the mirror interface is and ON Sensor is connected:
monitor session 1 destination interface fastethernet 0/24
To show the SPAN Port configuration, the following commands can be used:
show monitor session 1
and
show monitor session 1 detail
4.1.4.3.3. Netflow configuration
In this section, we take a look at a basic NetFlow configuration for a Cisco Catalyst switch. Configuration may change depending on the model and version.
Note
NetFlow is a Cisco property protocol. Therefore, it only exists on Cisco devices, other vendors can use other flows such as SFlow or IPFix.
First configure NetFlow Export, Where and How flows are being sent:
ip flow-export destination <Collector_Host_IP> 2055
ip flow-export source <interface>
ip flow-export version 9
ip flow-cache timeout active 1
ip flow-cache timeout inactive 15
snmp-server ifindex persist
For this case <Collector_Host_IP> is IP Address for ON Analytics server and <interface> is where switch is sending all flows, in this case is interface Fa 0/22.
Enable NetFlow in each Layer 3 interface to monitor:
interface <interface>
ip flow ingress -> Monitor incoming flows
ip flow egress -> Monitor outgoing flows
Note
On previous IOS versions 12.0(22)S or 12.2(15)T the equivalent command for “ip flow ingress” is “ip route-cache Flow”
To validate NetFlow configuration issue the following commands:
show ip cache flow
show ip flow export
show ip flow interface
show ip flow export template