4.1.8. Troubleshooting
In order to troubleshoot the Visibility Use Case, we have considered the following sections. Carefully review the topics to see if they can solve your problem.
4.1.8.1. Dashboard does not show data
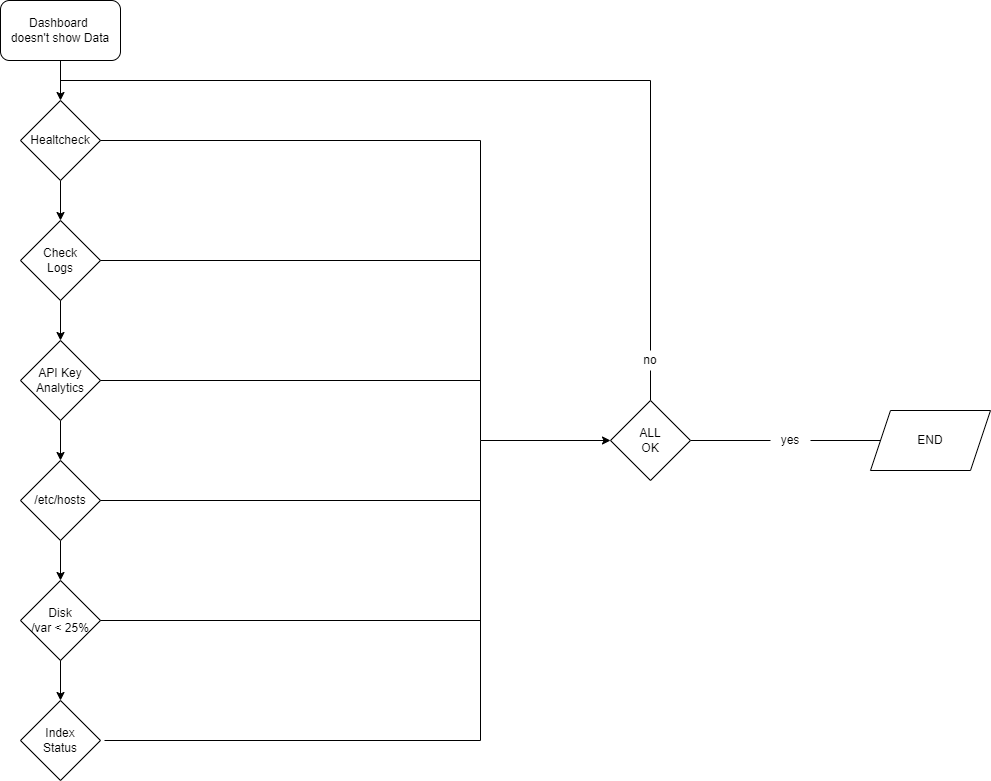
When a dashboard does not show the data, it means that the ON Analytics component is somehow not working as expected. We have to follow a simple flow that will be detailed by the steps below to discover our issue :
4.1.8.1.1. Healthcheck
The first thing to do is to check the ON Analytics healthcheck. SSH onto the machine and execute
php /usr/share/opennac/healthcheck/healthcheck.php
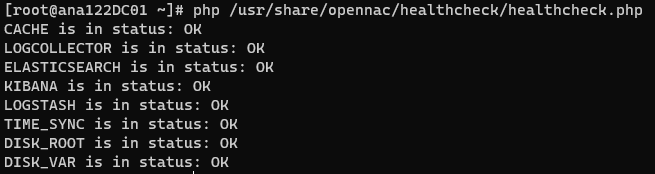
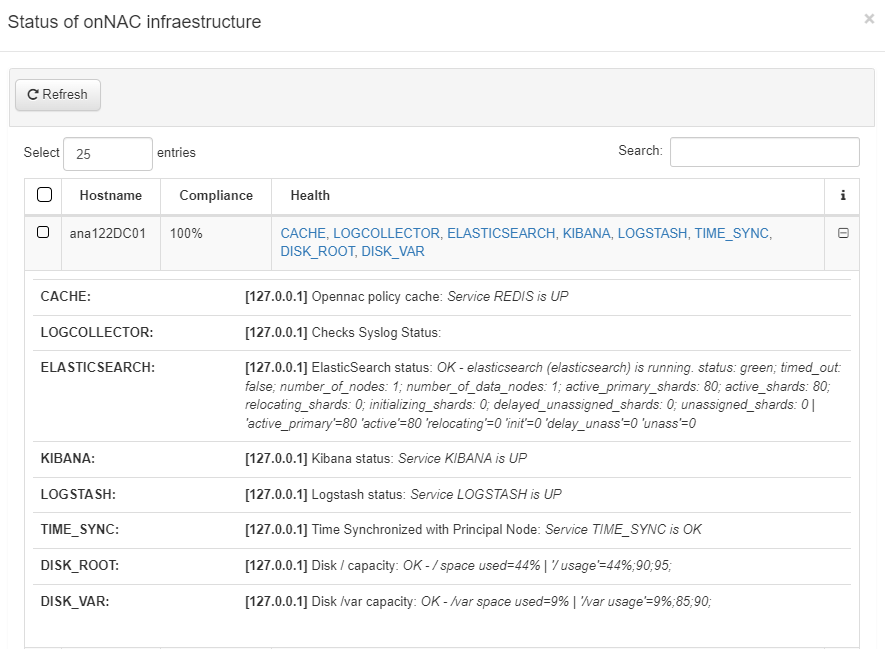
Make sure everything shows the “OK” state. Remember that you can also check the healthcheck from the OpenNAC Web Administration Portal (looking at the ON Analytics healthcheck):
If you do not see any errors here and/or the problem persists, you can go to the next step.
4.1.8.1.2. Check the logs
There are three important services on the ON Analytics: Logstash, Elasticsearch, and Kibana. To check their behavior we can see each one’s logs.
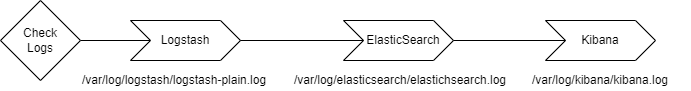
Logstash: check the log file in the path /var/log/logstash/logstash-plain.log at ON Analytics
tail -f /var/log/logstash/logstash-plain.log
Elasticsearch: check the log file in the path /var/log/elasticsearch/elasticsearch.log at ON Analytics
tail -f /var/log/elasticsearch/elasticsearch.log
Kibana: check the log file in the path /var/log/kibana/kibana.log at ON Analytics
tail -f /var/log/kibana/kibana.log
If you do not see any errors here and/or the problem persists, you can go to the next step.
4.1.8.1.3. Check the API Key
The API key configured in the OpenNAC Web Administration portal on ON CMDB -> Security -> API Key must contain the ON Analytics IP and this one must be configured on the ON Analytics server as well.
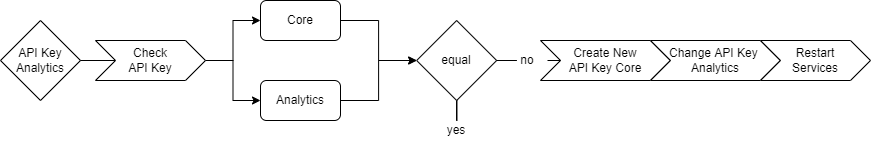
Go to ON CMDB -> Security -> API Key section and check if the “IP” is the ON Analytics IP address, and the generated key is the API key to be used.
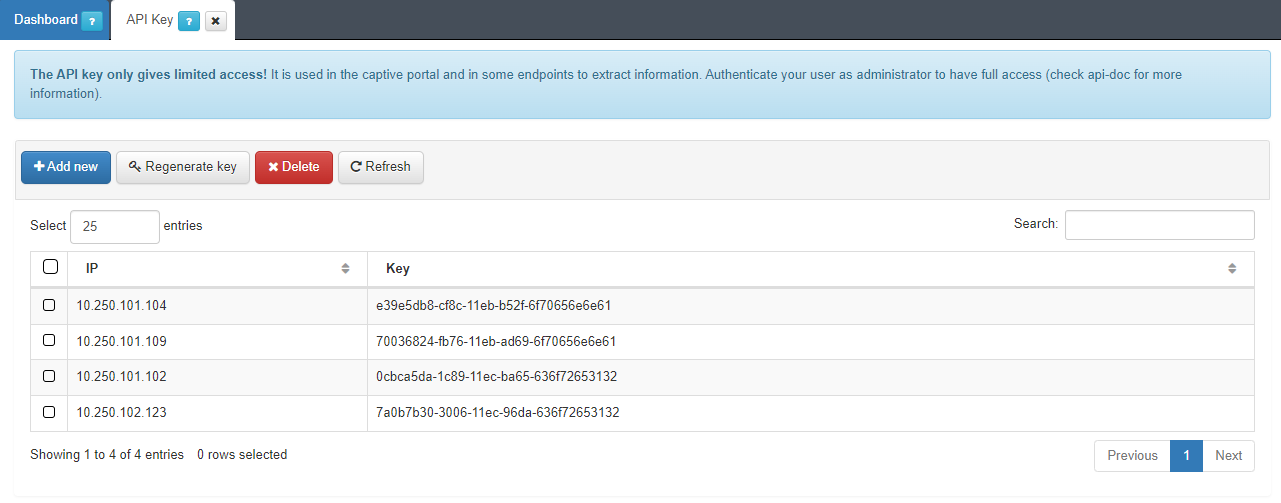
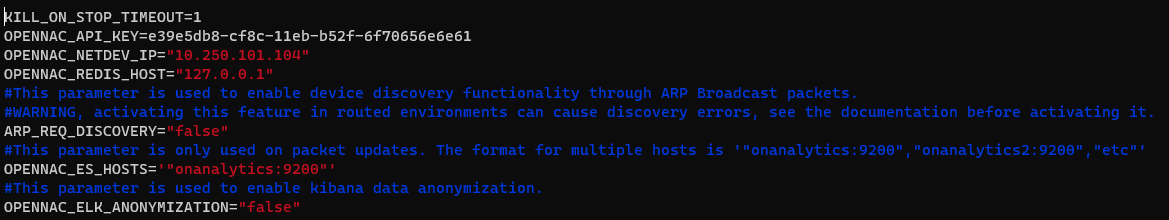
In this example, the ON Analytics IP is the 10.250.101.104, so now accessing this machine and looking into the /etc/default/opennac file, we must see the same API key on the “OPENNAC_API_KEY” field:
If you need to create a new API Key or modify any field, make sure to restart the services:
systemctl restart logstash
systemctl restart elasticsearch
If you do not see any errors here and/or the problem persists, you can go to the next step.
4.1.8.1.4. Check the /etc/hosts of the ON Analytics
On the ON Analytics server, the /etc/hosts must be correctly configured.
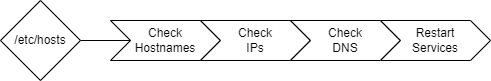
Check if the hostnames of ON Analytics, On Sensor, On Aggregator, On Core and On Principal exists.
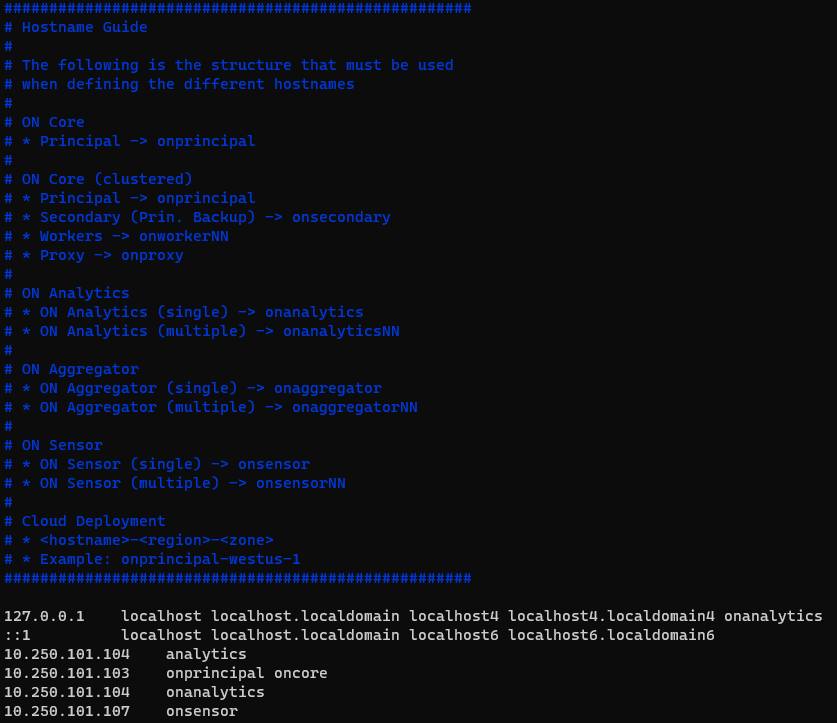
Check if the IP assigned to every hostname is correct, and check if the interface can correctly resolve requests.
Check that a DNS nslookup to any host returns the ip corresponding to the domain.
Restart the services
systemctl restart logstash
systemctl restart elasticsearch
If you do not see any errors here and/or the problem persists, you can go to the next step.
4.1.8.1.5. Check the ON Analytics /var disk capacity
The capacity of the /var disk on the ON Analytics must remain with more than 25% free space.
To check this percentage, ssh onto the ON Analytics console and run:
df -h
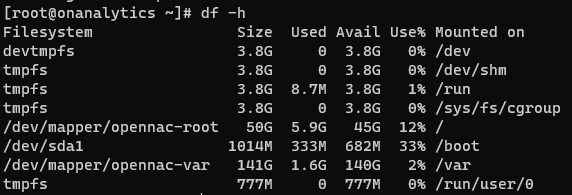
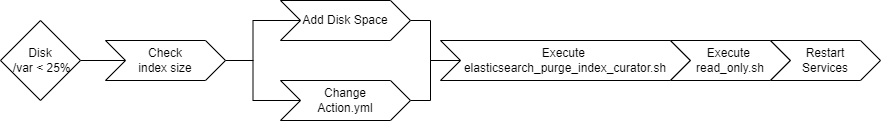
If the percentage in use is >75%, follow the next steps:
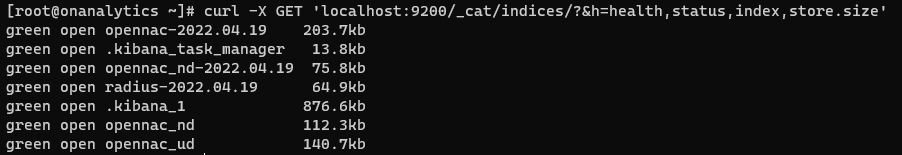
Check the index size
curl -X GET 'localhost:9200/_cat/indices/?&h=health,status,index,store.size'
Add disk space (optional): you can make the disk size bigger.
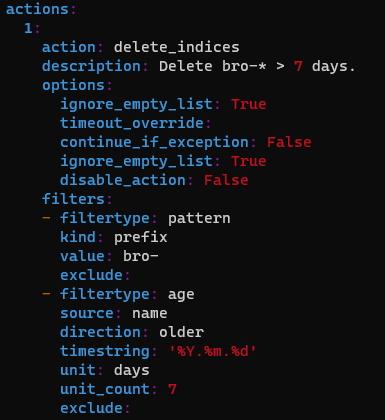
Change the /etc/elastCurator/action.yaml file. You can change the days you want to save the index.
Execute clear index in base to the previously modified action.yaml
/usr/share/opennac/analytics/scripts/elasticsearch_purge_index_curator.sh
Execute the read_only.sh script
/usr/share/opennac/analytics/scripts/read_only.sh
Restart the services
systemctl restart logstash
systemctl restart elasticsearch
If you do not see any errors here and/or the problem persists, you can go to the next step.
4.1.8.1.6. Check ON Analytics Index Status
The last step to follow in order to solve the Dashboard not showing data issue, is to check the indexes status.
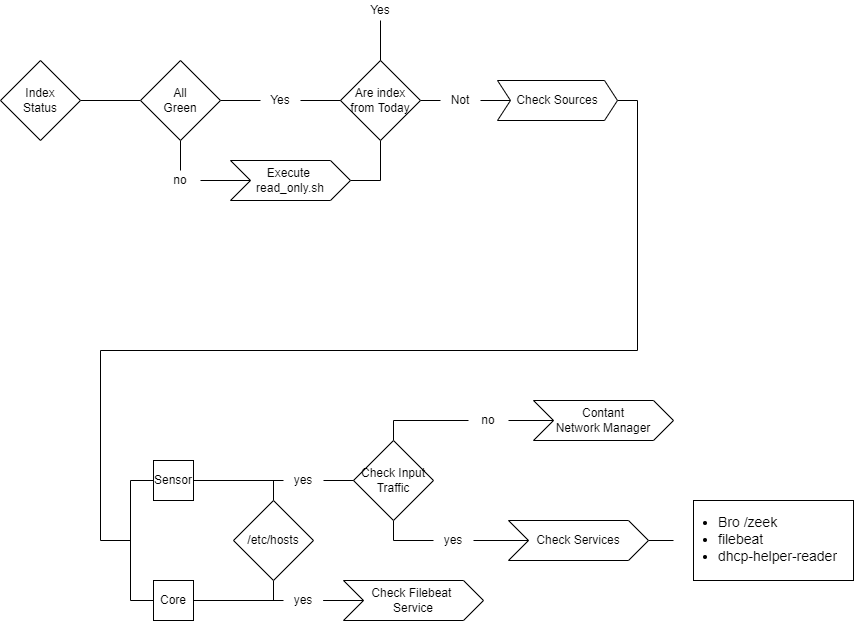
Make sure all indexes status are green
curl -X GET 'localhost:9200/_cat/indices/?&h=health,status,index,store.size'
If they are not green, execute the read_only.sh script
/usr/share/opennac/analytics/scripts/read_only.sh
Check if the indexes have been created today. If they have, everything should work correctly (skip all following steps)
curl -X GET 'localhost:9200/_cat/indices/?&h=health,status,index,store.size'
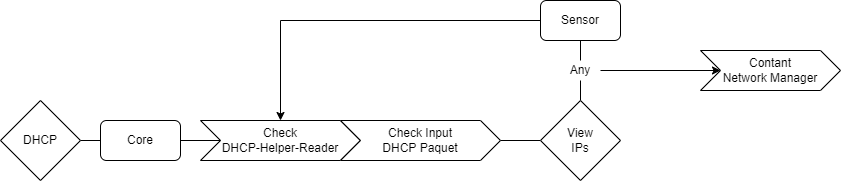
Check the sources on the /etc/hosts
Check the onanalytics entry has the correct IP on the ON Core and ON Sensor machines.
Check input traffic with a tcpdump on the ON Sensor
tcpdump -i <interface>
If you do not have input traffic, contact the network manager, the problem must be external.
If you do have input traffic, check the sensor services: zeek, filebeat and dhcp-helper-reader:
systemctl status zeek
systemctl status filebeat
systemctl status dhcp-helper-reader
On the ON Core machine, check the filebeat status.
systemctl status filebeat
4.1.8.2. Business Profile entry with IP 0.0.0.0
Other common problem is to find an entry with the IP 0.0.0.0 on a Business Profile. Follow the steps below to discover the issue:
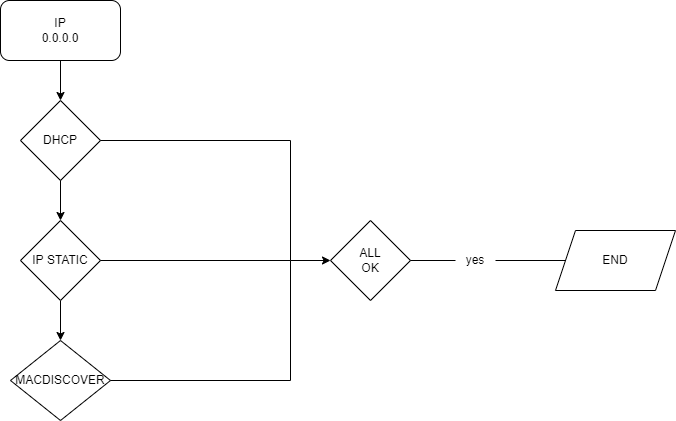
4.1.8.2.1. DHCP
On the ON Core machine, check the DHCP behavior:
Check the service status
systemctl status dhcp-helper-reader
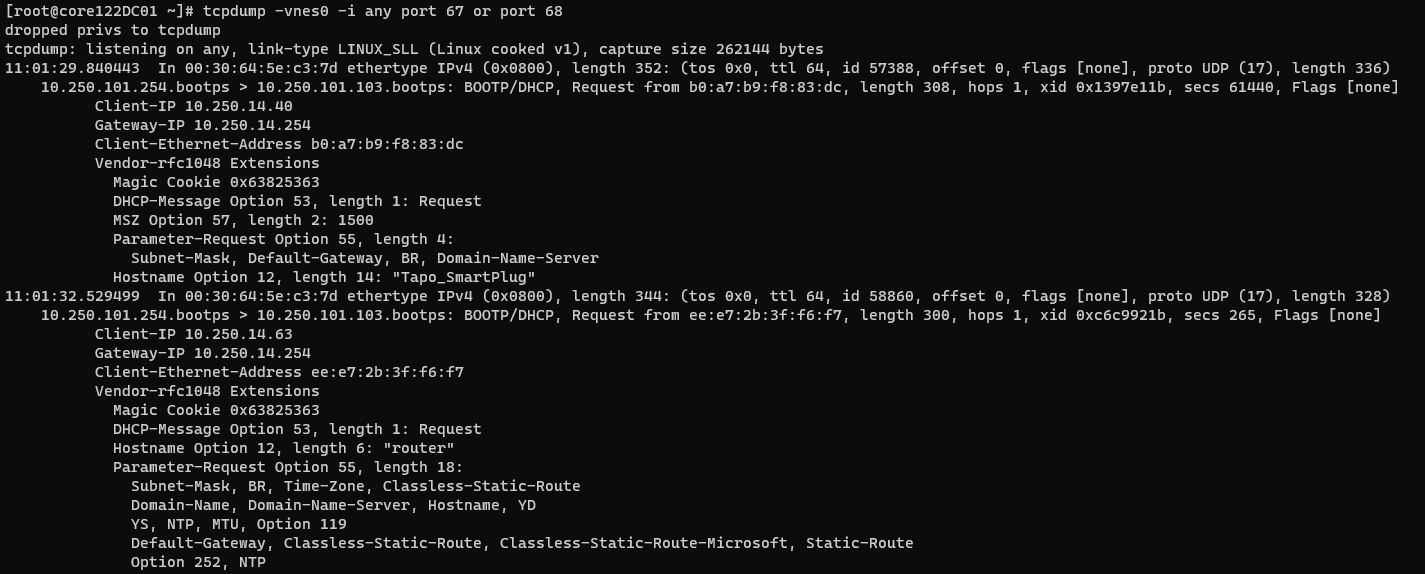
Check the DHCP input packets
tcpdump -vnes0 -i <interface> port 67 or port 68
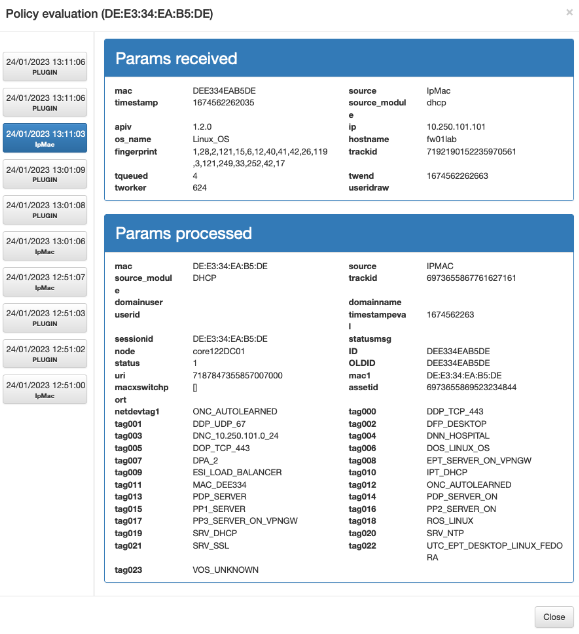
View the IPs: ipMac with source dhcp. Go to the policy evaluation on the OpenNAC Enterprise Web Administration Portal go to ON NAC -> Business Profile, select the Business Profile with the issue, click on the eye icon of the event and select IpMac until you see “dhcp” as source module
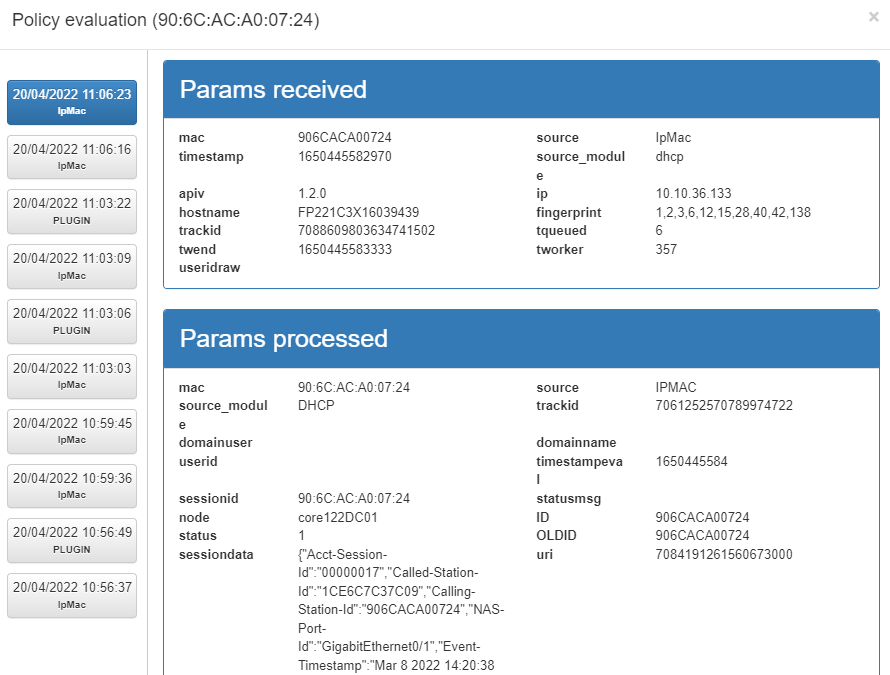
Repeat the same process on the ON Sensor machine
If the problem is not solved, you can check the DHCP Helper Reader advanced troubleshooting.
If you do not see any errors here and/or the problem persists, contact your network manager, the problem must be external.
4.1.8.2.2. IP Static
On the ON Sensor and ON Analytics machines, follow the flow shown below:
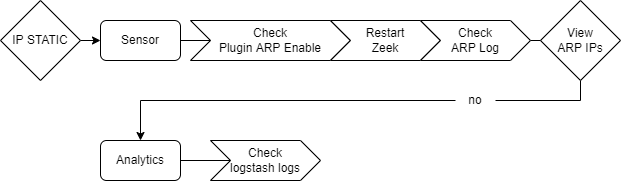
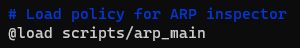
Check that the ARP Plugin is enabled. On the ON Sensor machine go to /opt/zeek/share/zeek/site/local.zeek and make sure the line “@load scripts/arp_main” is uncommented.
Restart the zeek service
systemctl restart zeek
Check the ARP log file on ON Sensor
tail -f /opt/zeek/logs/current/arp.log
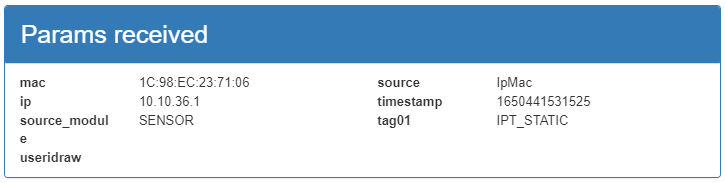
In ON NAC > Business Profiles in the event window we can see the IpMac event with the tag IPT_STATIC.
Check logstash logs on the ON Analytics machine:
tail -f /var/log/logstash/logstash-plain.log
If you do not see any errors here and/or the problem persists, you can go to the next step.
4.1.8.2.3. MACDISCOVER
On the ON Core, check the network configuration:
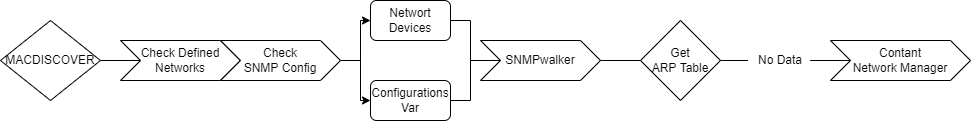
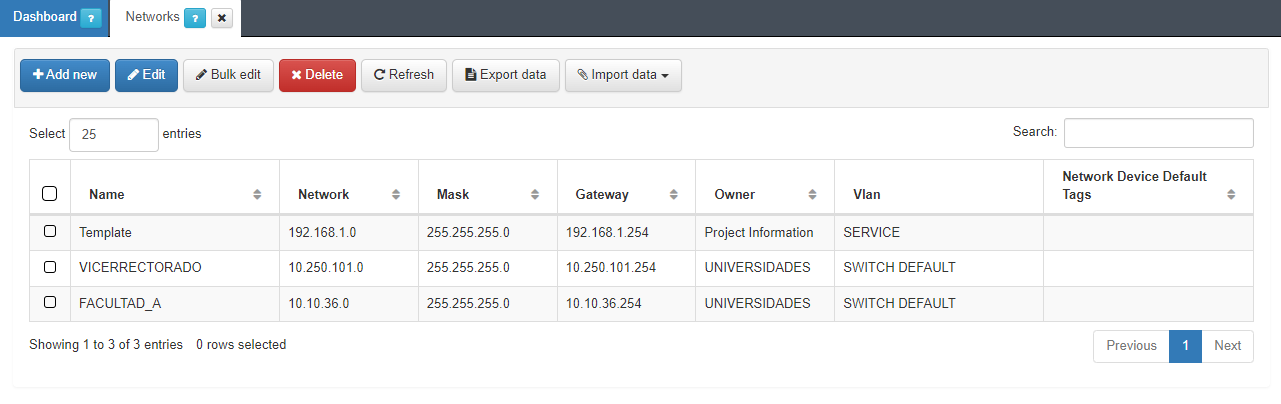
Go to ON CMDB -> Networks to check the defiled networks. You and add a new one or edit an existing one.
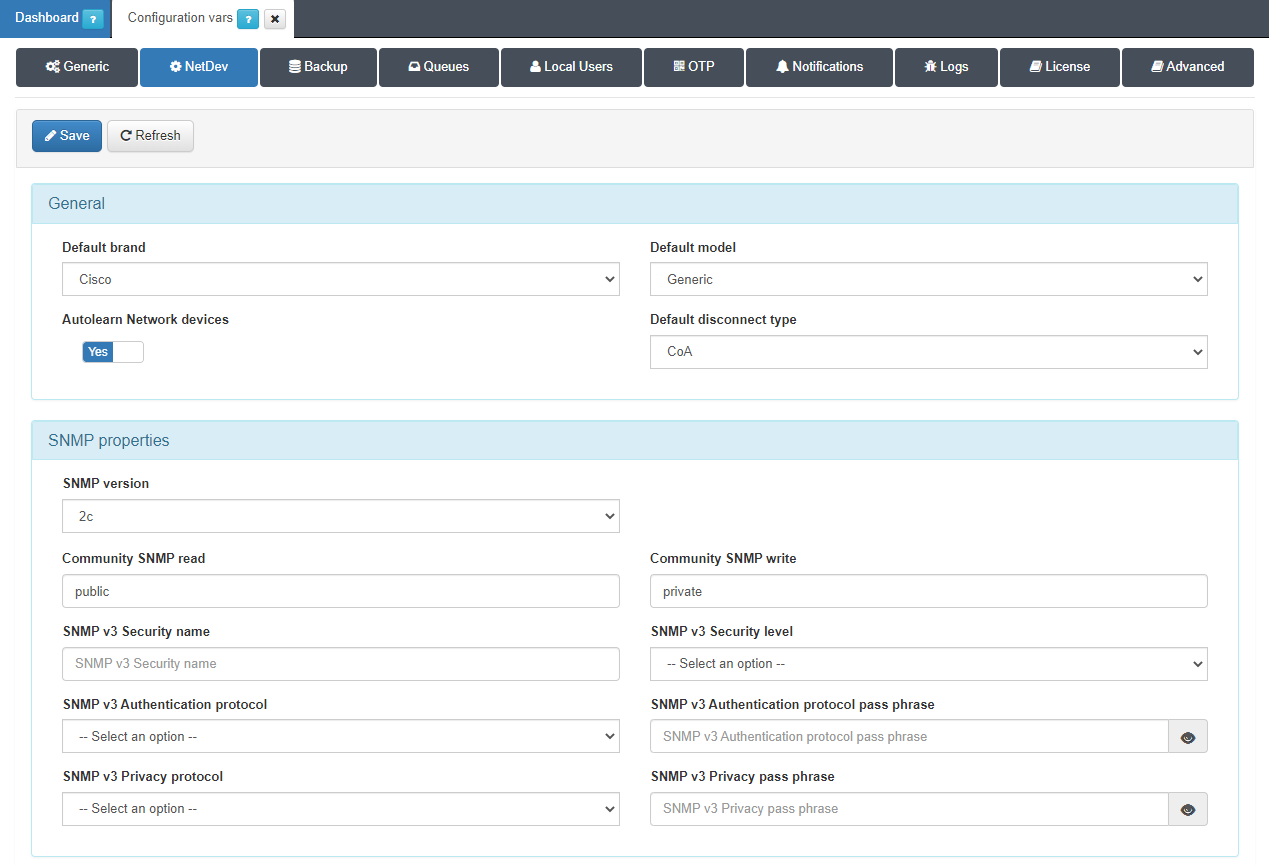
Check the SNMP configuration on Configuration -> Configuration vars -> NetDev
Query the network with SNMPWalker
snmpwalk -v2c -c cal2kmar <ipNetToMediaPhysAddress>
With the “head” filter we get the ARP table
snmpwalk -v2c -c cal2kmar <ipNetToMediaPhysAddress> | head
If the problem persists, contact your network manager, the problem must be external.
4.1.8.3. DHCP Helper Reader Advanced Troubleshooting
This protocol can discover a device or get complementary information about a previously discovered one. To check the behavior of the DHCP Helper Reader, requests and forwarded responses, refer to the following diagram. The main components that take part in the flow are:
DHCP Helper Reader Service (ON Core/ON Sensor)
ON Principal - Redis, Gearman, Minions (former workers), and OpenNAC Enterprise API
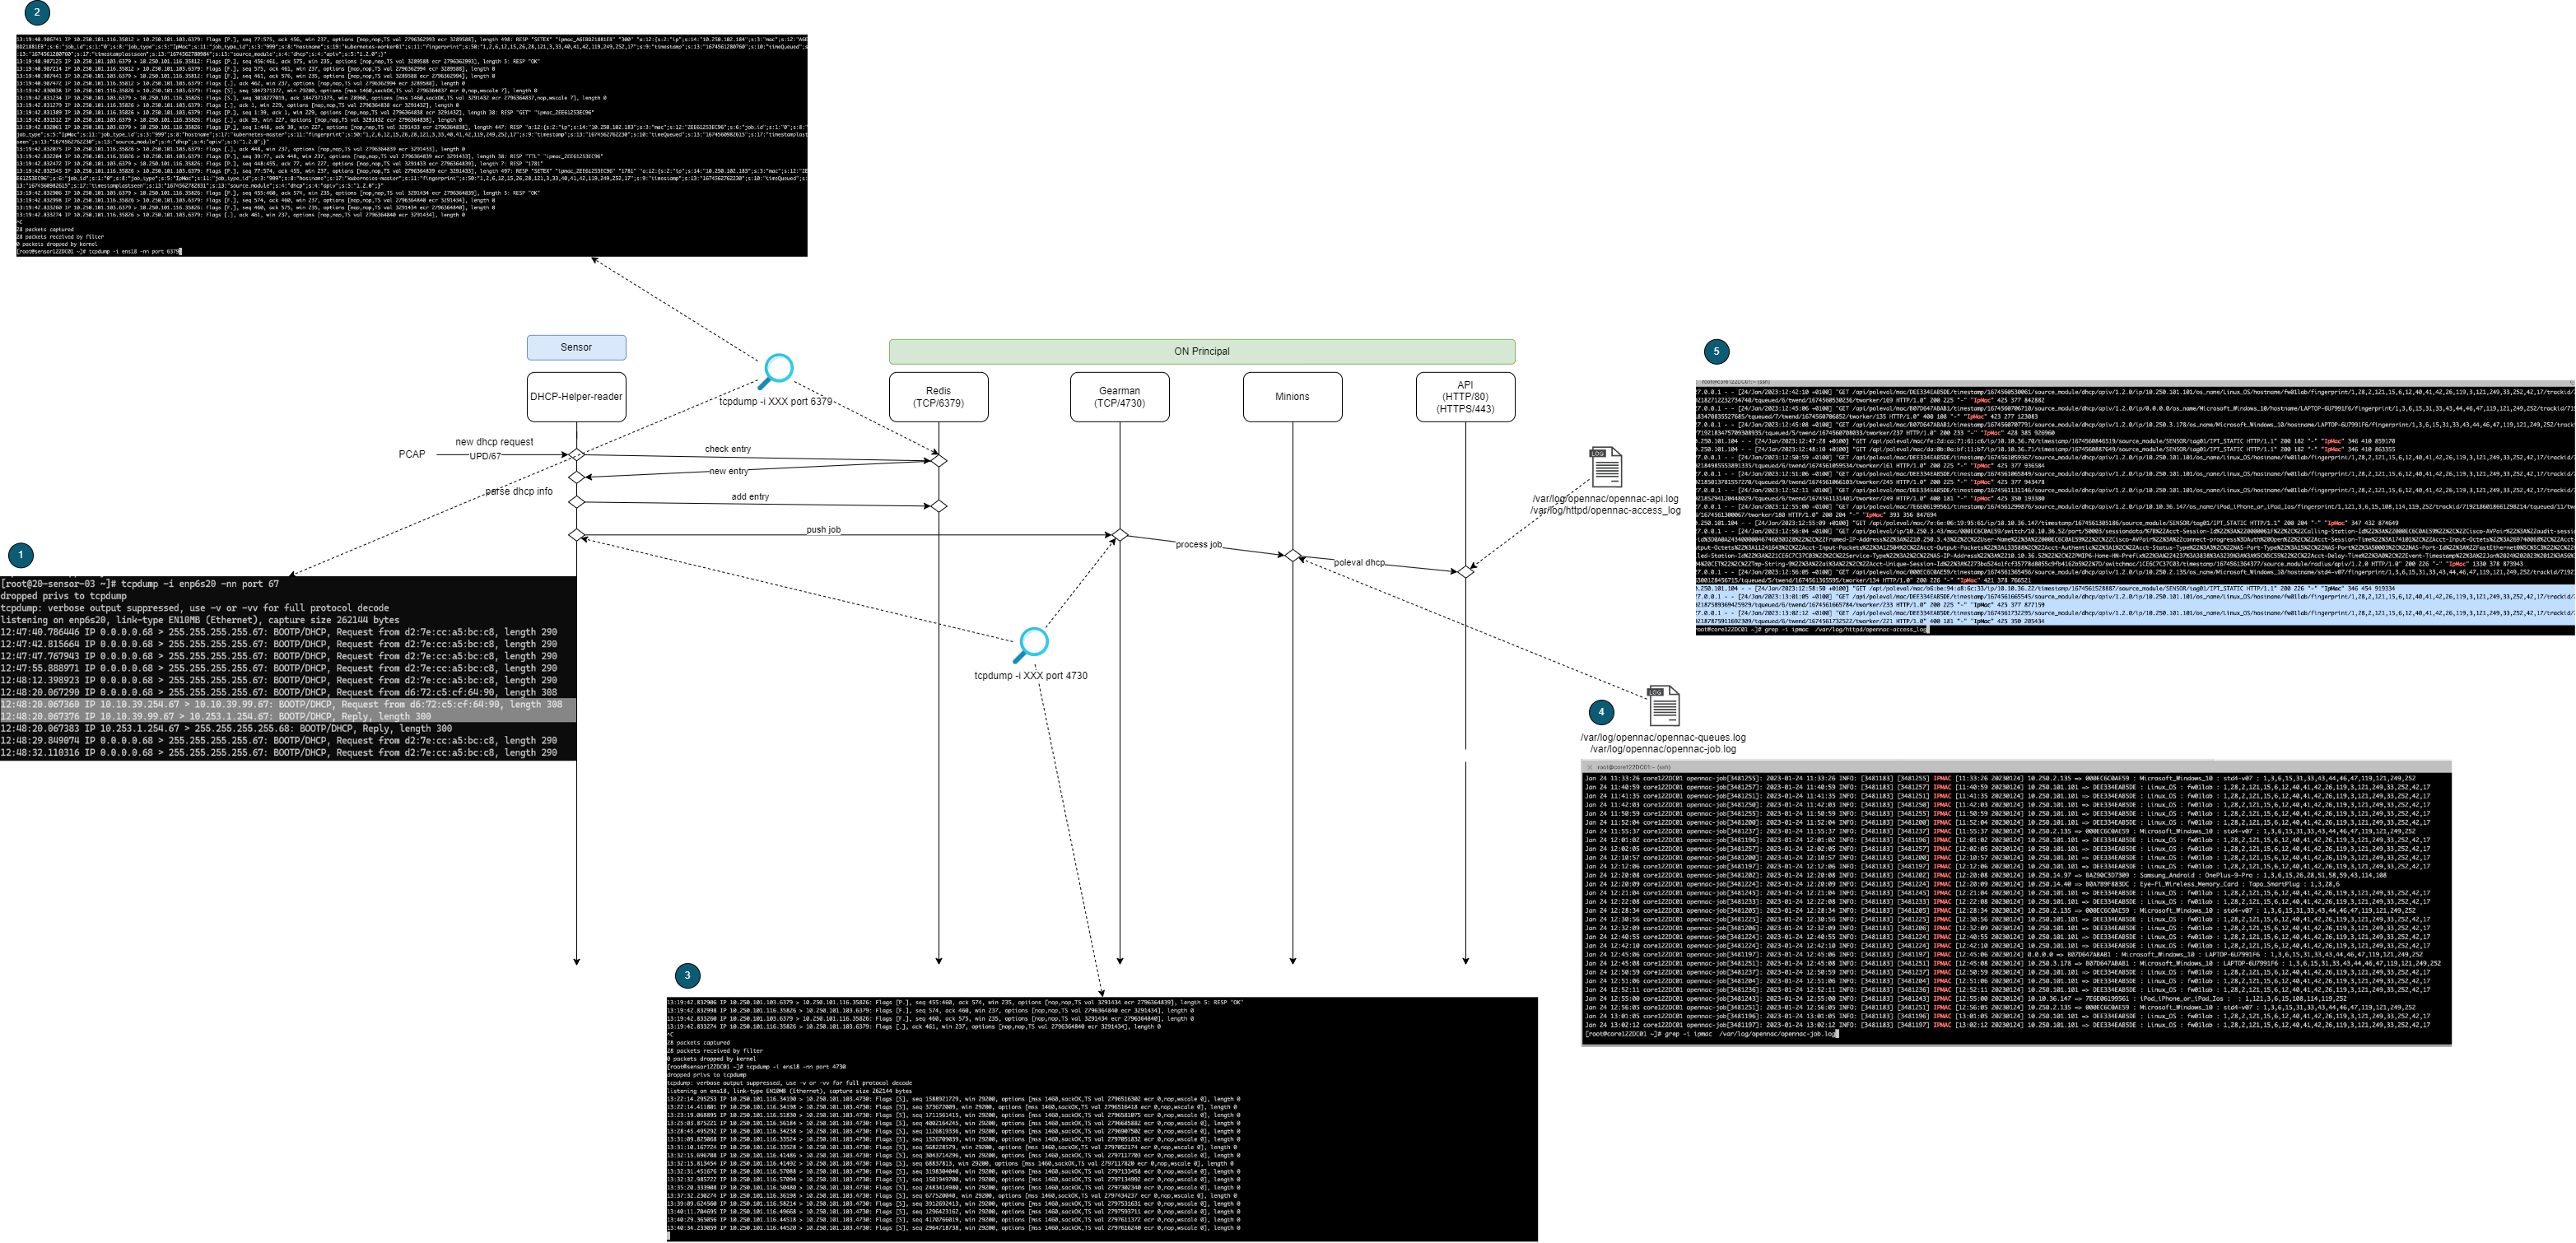
When traffic is received in ON Sensor, it detects the DHCP request (On Core can also receive requests).
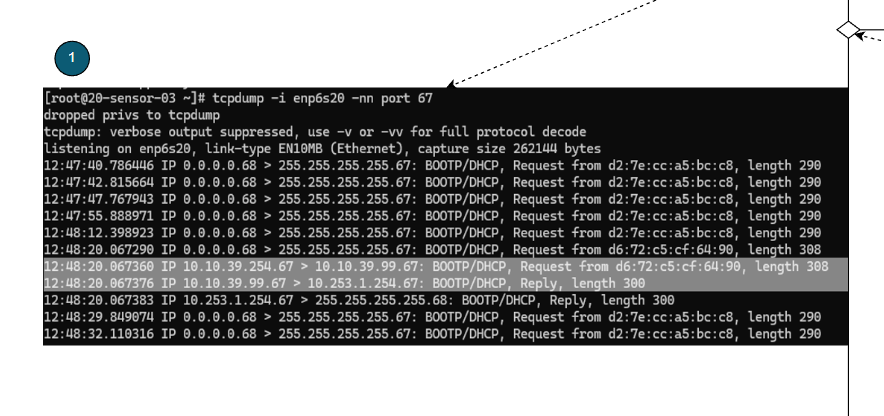
To check that the DHCP Helper Reader is receiving the requests, we execute the following command indicating the interface where the traffic is being received:
tcpdump -i <INTERFACE> -nn port 67
The DHCP Helper Reader checks against Redis, whether the device has been already discovered or not. If not, DHCP registers the new entry on Redis.
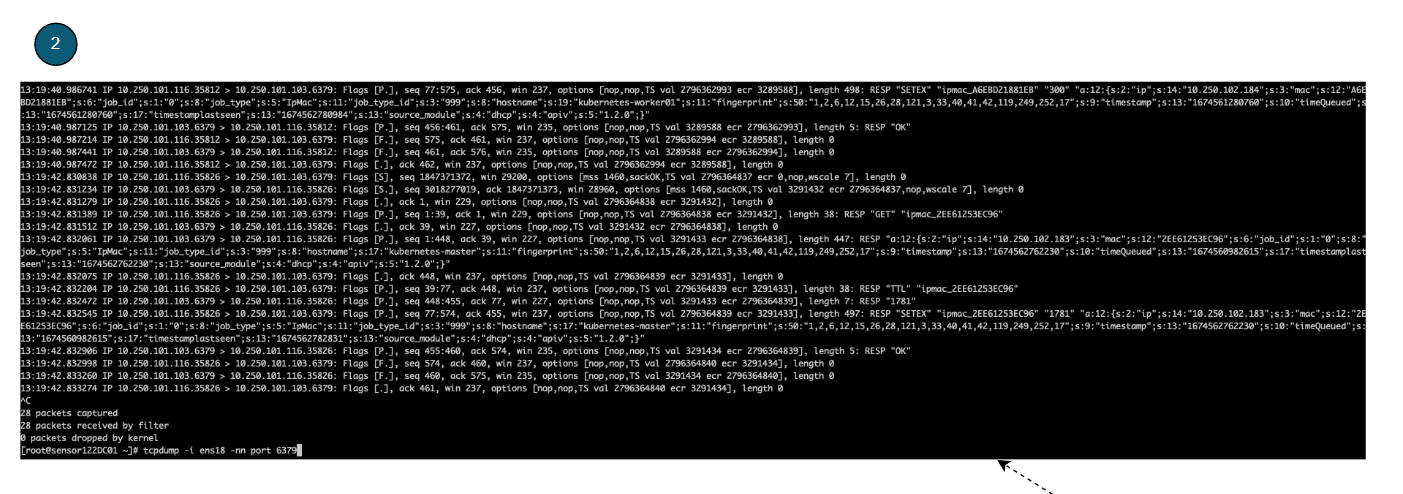
To check that the traffic is being received by Redis, execute the following command:
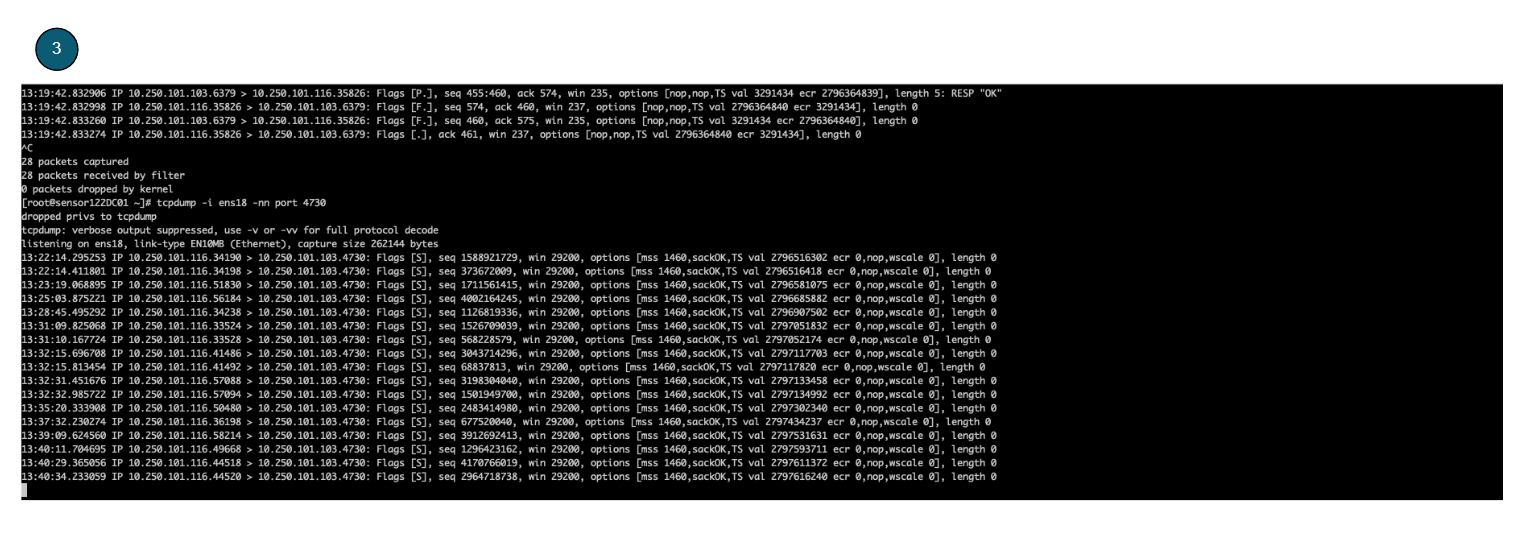
tcpdump -i <INTERFACE> -nn port 6379
Once the DHCP Helper Reader has parsed the device information, it pushes the job against Gearmand.
To check that Gearmand is receiving jobs from DHCP Helper Reader, execute the following command:
tcpdump -i <INTERFACE> -nn port 4730
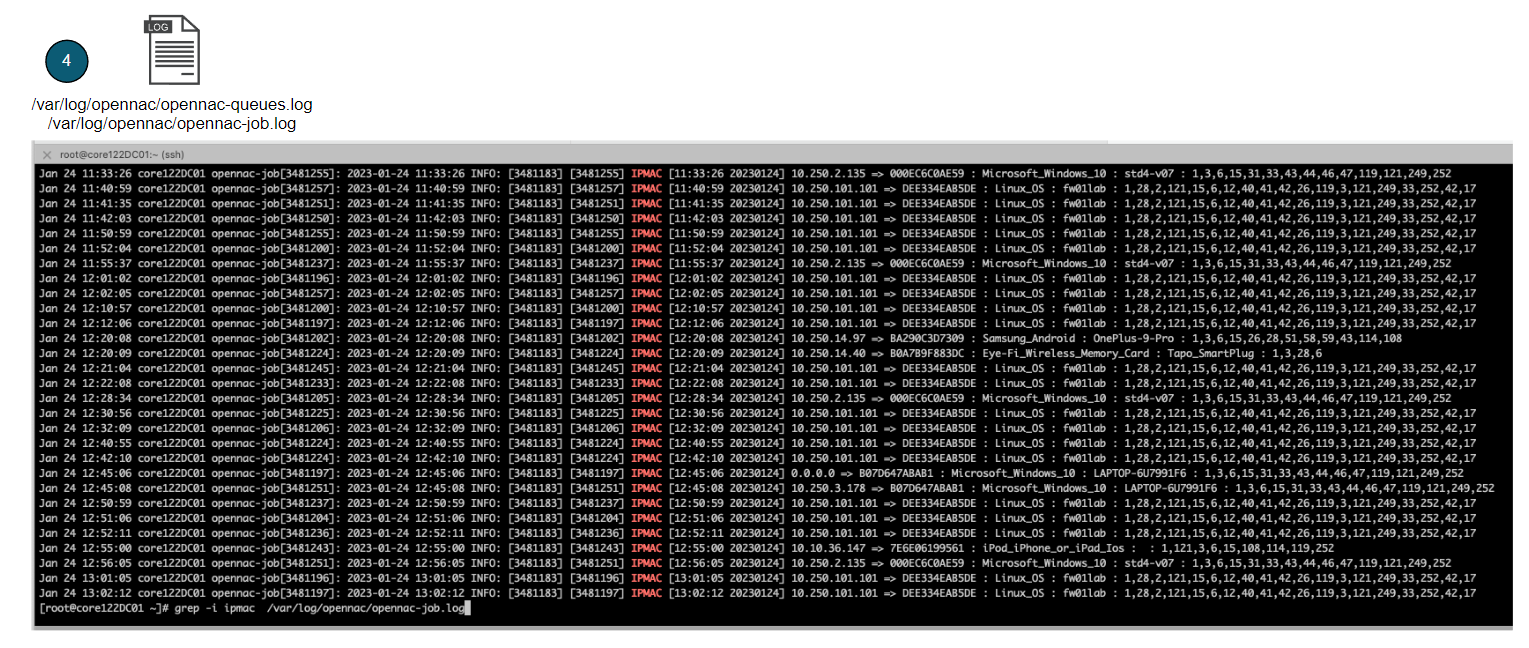
Gearmand will then assign the job to a minion.
To check that the minion has received the job, we can look the following log in ON Principal:
grep -i ipmac /var/log/opennac/opennac-job.log
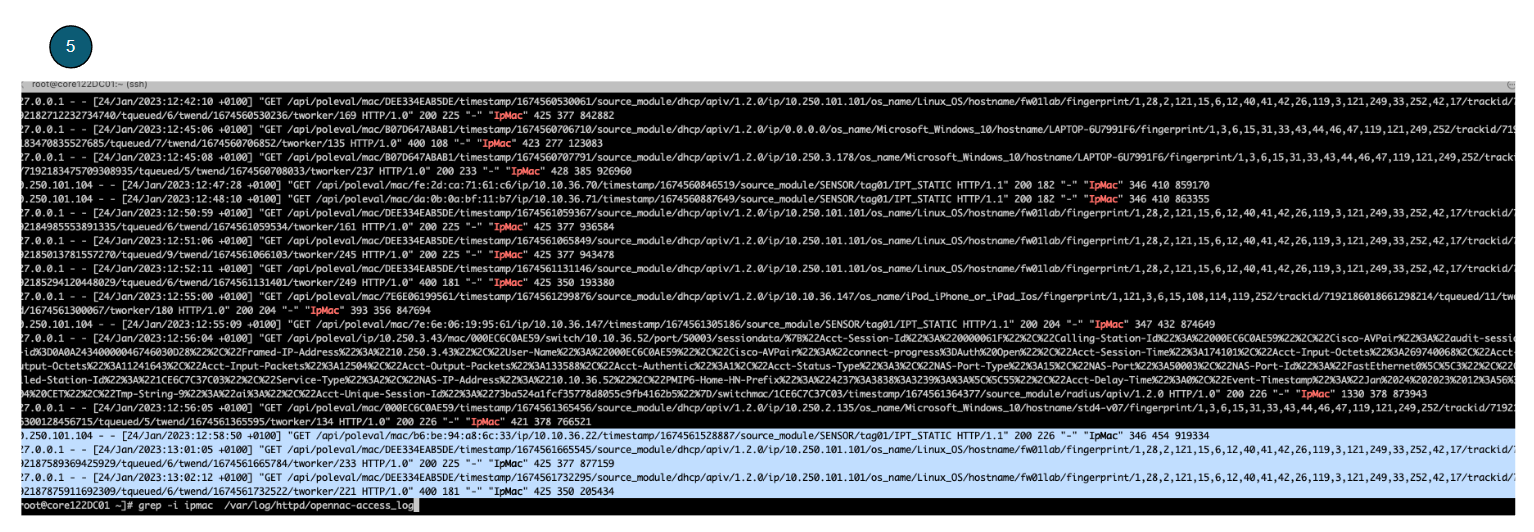
The assigned minion will receive the information and push it to the OpenNAC Enterprise API.
To check if the API is receiving the poleval, we can look the following log in ON Principal:
/var/log/httpd/opennac-access_log
Based on the information received, the OpenNAC Enterprise API will add the newly collected information to the new device.
We can see that these events have occurred in Business profile. The following image shows the expected results: