4.1.3. Architecture
In this section, we will talk about the Visibility basic architecture: the components, the simplified architecture, and the recommended sizing.
4.1.3.1. Components
The deployment of the visibility module only requires the installation of two components:
ON Core: Performs centralized management of the solution, the capture of discovery events, profiling of discovered assets, and implementation of business logic.
ON Analytics: Meant for management and visualization of the collected information, dashboards generation, and reports visualization.
Optionally, you can deploy two additional components:
ON Sensor: Allows us to know the behavior of the network flows. It will help us to enrich the profiling and information on discovered assets.
ON Agent: Provides visibility of end-user devices by sending a complete Hardware / Software inventory of the devices where it is installed.
4.1.3.1.1. ON Core
ON Core provides the centralized management console of the solution, where the visibility policy engine for discovery resides. This device runs the logic that processes and validates asset profiling based on multiple conditions and characteristics, and also runs plugins to enrich profiling in an active or passive way.
It is a mandatory component of the solution and includes critical components such as:
Policy Engine: It is the solution’s brain; all modules are implemented using this component.
CMDB: It is the storage of the solution where all the configuration, assets and its features are saved.
Administration Portal: It is the control panel for the solution.
Note
It is a critical component in the solution. The implementation of one or more nodes will depend on the requirements of the deployment, and the final architecture design to provide high availability.
With this component offline, we would lose the ability to perform the discovery and profiling of assets in our network.
4.1.3.1.2. ON Analytics
ON Analytics is based on the ELK Stack. It receives the platform logs, structures, metadata and builds the datalake to show dashboards and reports in real time, allowing specific searches.
It is a mandatory component of the solution that includes non-critical components such as:
Aggregator: An enrichment of all the information generated by any component of OpenNAC Enterprise.
Search Engine: Based on an elastic search engine that allows you to easily search the information generated and collected by the OpenNAC Enterprise components.
Dashboards and reports: The solution includes a set of dashboards and reports based on common technical information gathered. You can create and generate your own custom dashboards.
Note
ON Analytics is a non-critical component for the solution, therefore, it does NOT require high availability. The implementation of one or more nodes will depend on the requirements of the deployment, and the final architecture design. If this component is outlined, the main functionality of OpenNac Enterprise modules would continue working, with the exception that during the outlined period we would no longer have the ability to process and display the information of the solution.
In deployments where a large amount of data is generated, it may be necessary to deploy multiple Analytics nodes to load balancing the storage. Analytics has two types of roles, typically within the same node, a role with aggregation functions (Aggregator) that receives information through Filebeat and process logs with Logstash, the other role (Analytics) with data management functions performed by ElasticSearch and visualization through Kibana.
4.1.3.1.3. ON Sensor (optional)
ON Sensor is based on IDS technology, it processes the traffic generated in the network. Performs deep analysis of network protocols that are being used by ingesting the traffic through a port-mirror (SPAN, RSPAN or ERSPAN).
It is an optional component (depending on the sources explained in the Introduction) that provides:
Advanced Visibility and Network Behavior Monitoring. Provides metadata of network traffic that is captured by copying the traffic through the port mirror configured on the network device. The sensor has the ability to decode multiple standard protocols and applications, providing information from layer 2 to layer 7.
Note
ON Sensor is is a non-critical component for the solution, therefore, it does NOT require high availability. If this component is outlined, the main functionality of OpenNAC Enterprise modules would continue working, with the exception that during the outlined period we would no longer have the ability to have advanced visibility, analysis and monitoring of network behavior.
4.1.3.1.4. ON Agent (optional)
The ON Agent is a software that is installed in endpoint devices and servers for the monitoring and the hardware/software inventory of the device.
It is optional (depending on the sources explained in the Introduction) for the functioning of the Visibility module.
It allows you to manage and perform a detailed analysis of the device inventory (for example, OS patches, health and security features, deployed applications, etc.).
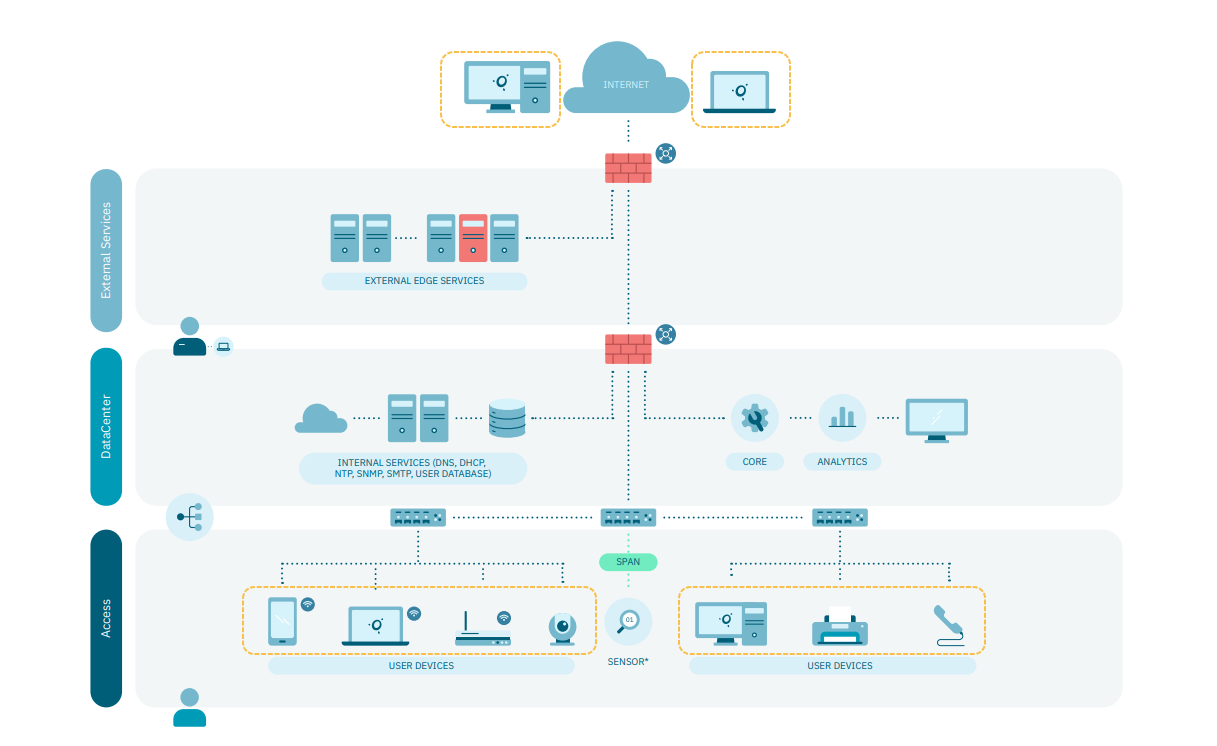
4.1.3.2. Standard Architecture
A Standard Architecture requires the components described above and depends on the network architecture available to the customer, as well as the number of assets on the network. The following diagram architecture shows the suggested components location.
Note
Deployment in high availability will depend on the customer’s requirements. If a HA deployment is required, it will be necessary to add additional components (two or more ON Core).
When connecting a device, it will be discovered by the Visibility methods (NetworkDevice, Agent or through ON Sensor). Once the device is discovered, it will execute (if configured) plugins that will allow us to obtain information regarding the discovered device and will apply profiling policies. As a result, a tag will be added to devices where the type is specified and also to their corresponding Business profile.
The Visibility process consists of two main phases:
Discovery: The process to discover devices connected to a network, which identifies an IP Address or MAC Address never connected before in the environment.
Profiling: When a new device is detected it is necessary to determine what kind of device it is (DESKTOP, MOBILE, PRINTER, etc). Once the device has been profiled according to profiling rules, a tag is added EPT_<DEVICE_TYPE>
4.1.3.3. Standard Sizing
Based on the standard architecture, the standard sizing of the solution for the Visibility module to support up to 25.000 discovered assets will be:
4.1.3.3.1. Sizing
Concurrent user growth is achieved by adding more nodes in a redundance scheme through a RADIUS proxy or load balancer.
Component |
Number |
CPU |
Memory |
Disc/Type |
Network Int. |
|---|---|---|---|---|---|
ON Core |
1 |
8 Cores |
16 GB |
160 GB/SSD |
2 NIC** |
ON Analytics 1 Gb |
1 |
8 Cores |
16 GB |
300 GB/SSD |
2 NIC** |
ON Analytics 10 Gb |
1 |
16 Cores |
32 GB |
300 GB/SSD |
2 NIC** |
ON Sensor 1 Gb (Optional) |
1 |
8 Cores |
16 GB |
100 GB/SSD |
|
ON Sensor 10 Gb (Optional) |
1 |
20 Cores |
128 GB |
100 GB/SSD |
|
ON Agent (Optional) |
N |
Note
** The 2 network interfaces are mainly for service and management (internal communication between the different nodes)
*** In some cases, it is recommended to have at least 2 NICs for an active-passive port span.