3.1.12.3.2. CMDB Metrics
The CMDB metrics dashboard display various metrics and insights related to Network Devices and Enpoint Devices and their tags.
We can see the following views on this dashboard, starting from the header:
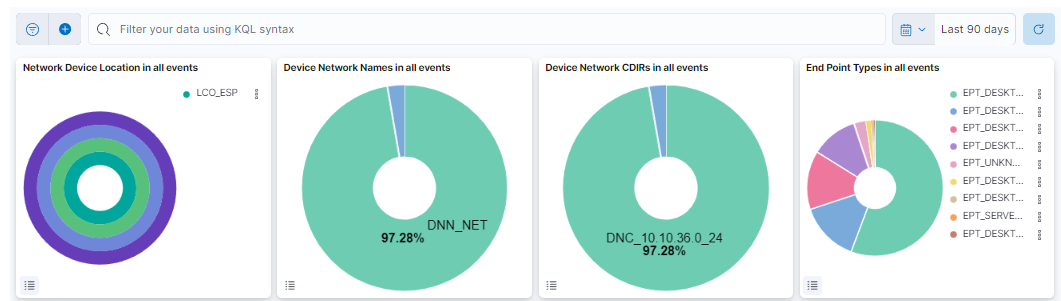
This header composed of four dashboards allows filtering by Network Device Location, Device Network Name, Device Network CDIRs, Endpoint Types. It will always look for the temporary index that is regenerated every day. In this toolbar, filter your data using KQL syntax.
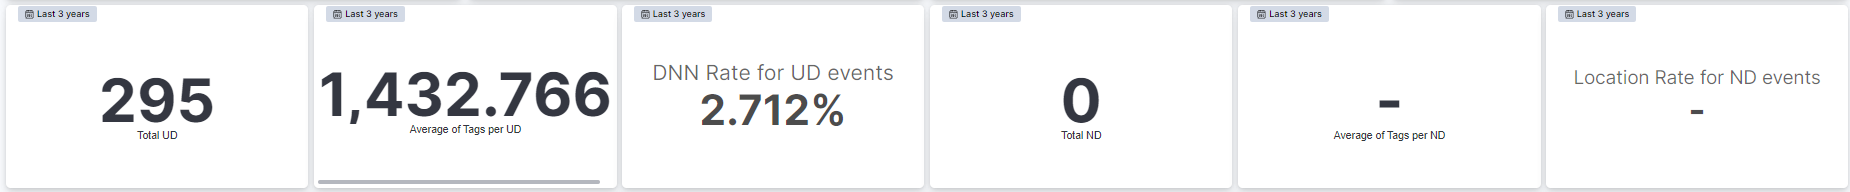
Total UD: Displays the count of total User Devices.
Average of Tags per UD: Displays the average count of tags per User Device.
DNN Rate for UD events: Displays the rate of predicting events related to User Devices.
Total ND: Displays the count of total Network Devices.
Average of Tags per ND: Displays the average count of tags per Network Device.
Location rate for ND events: Displays the rate of predicting events related to Network Devices.
Note
By default, these modules display data by the last 3 years time range.
To change the time range, click on the time displayed and a configuration window will pop-up.
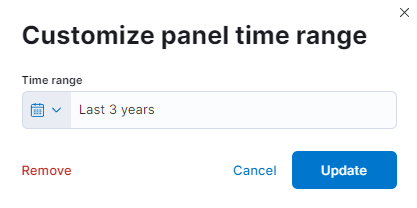
Choose the time range that better suit your needs and click on Update to save your preferences.
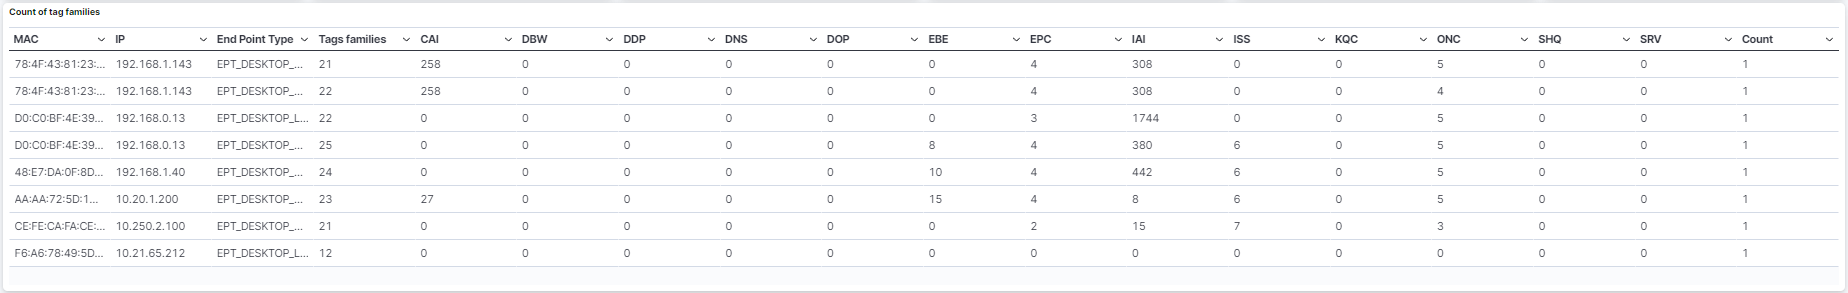
Count of tag families: Table that features the tags associated to a specific device and its count of tag families. See the Tags Table section for detailed information about the tags displayed in this view.
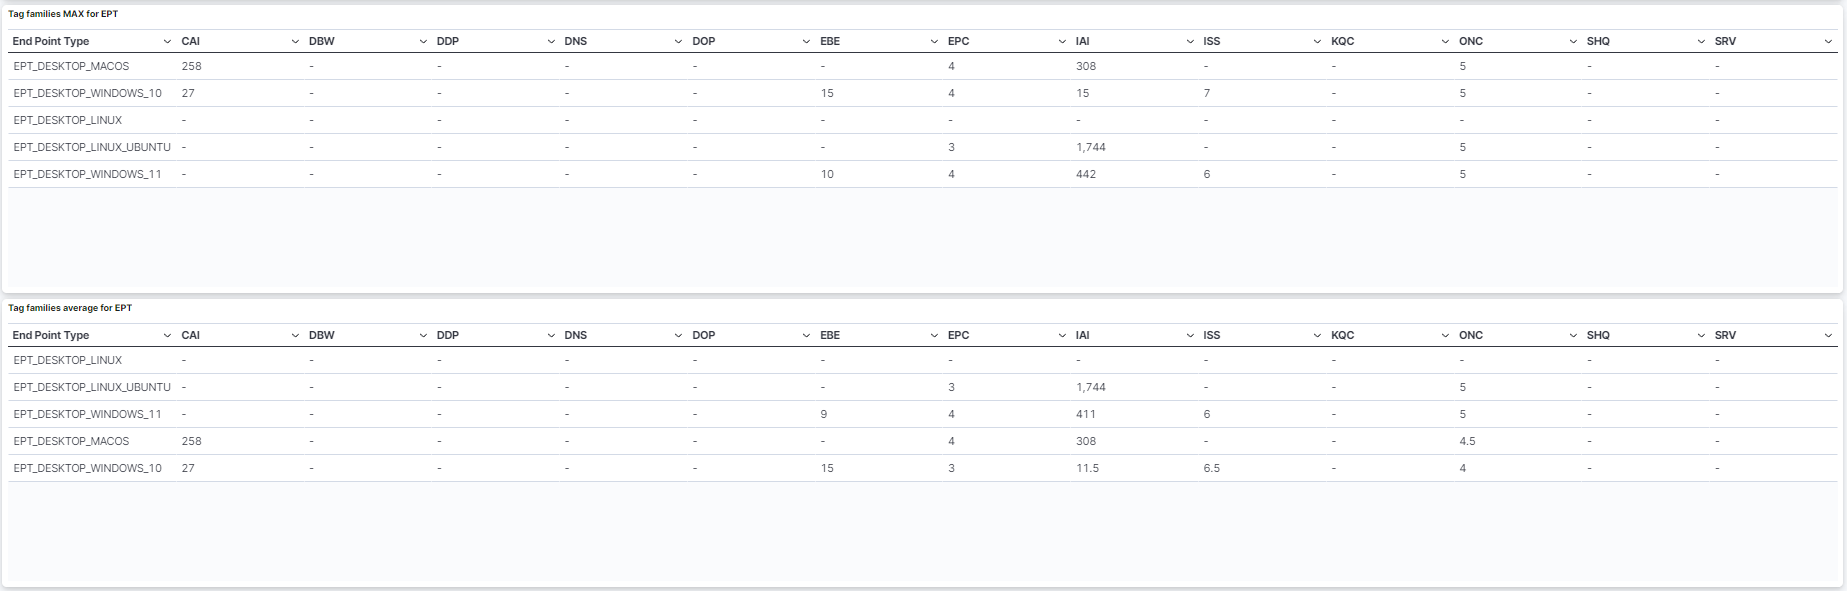
Tag families MAX for EPT: Table that features the MAX tag families associated to an Endpoint Type.
Tag families average for EPT: Table that features the average tag families associated to an Endpoint Type.