3.1.12.2. Discover
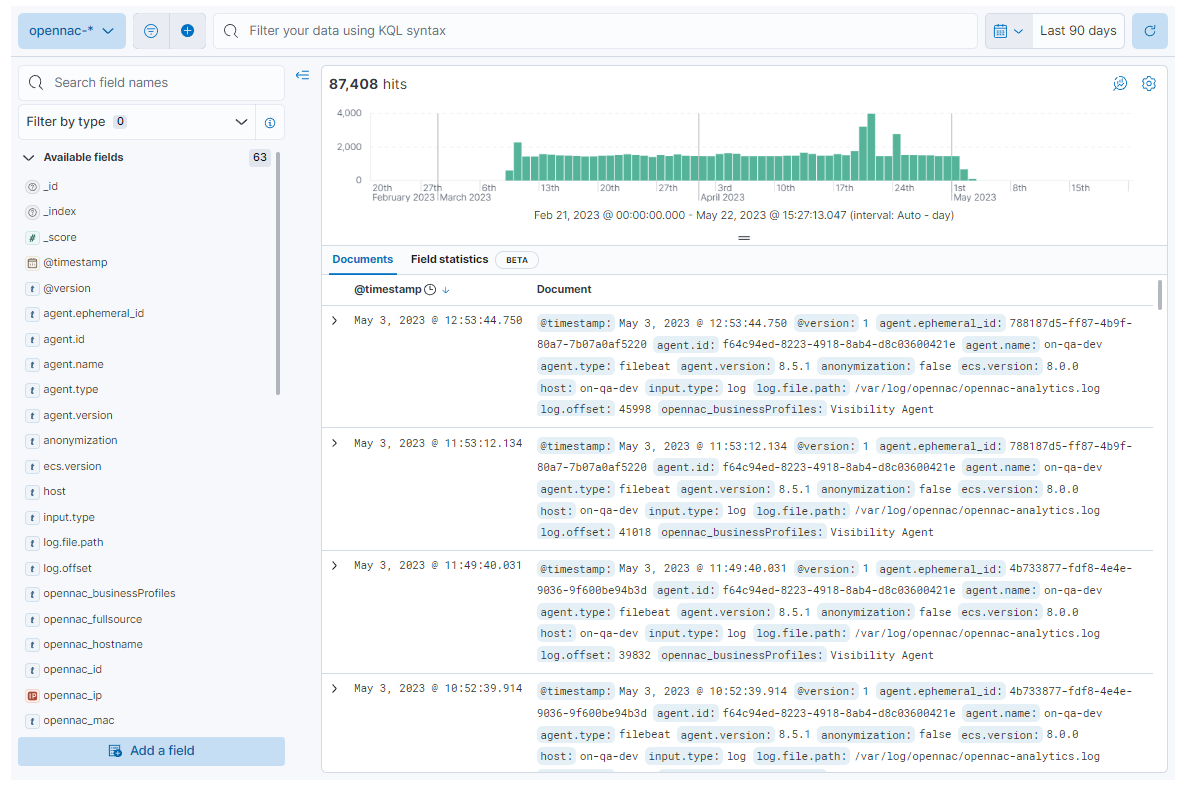
The Discover section features a search engine with the following interface:
3.1.12.2.1. Discover Toolbar
Let’s explore the Discover dashboard toolbar from left to right.

Index
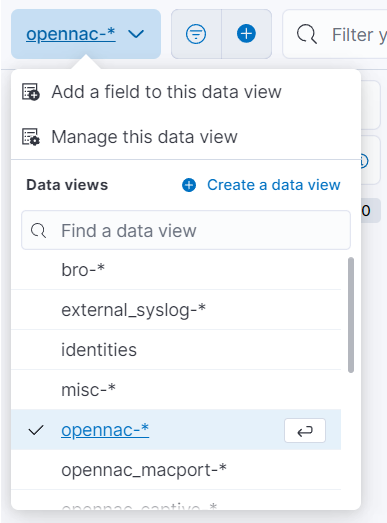
The first element of the toolbar is an index selector. The selected index serves as the source for the search results. Simply select another index option in the selector to change the index displayed in the dashboard.
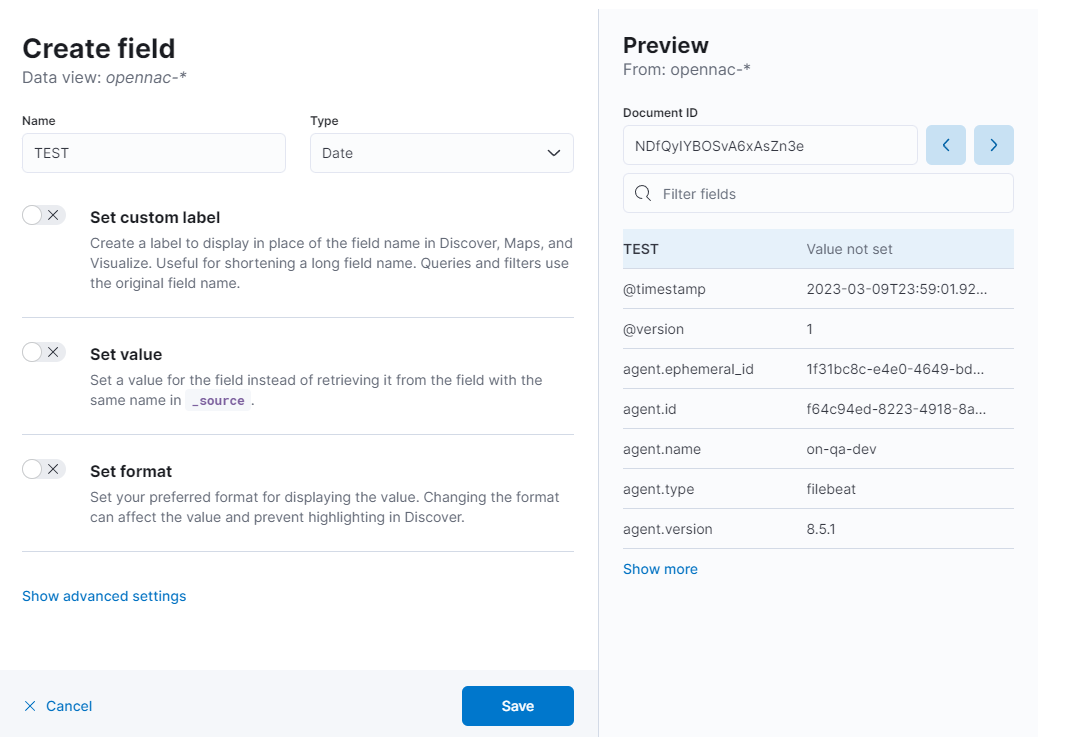
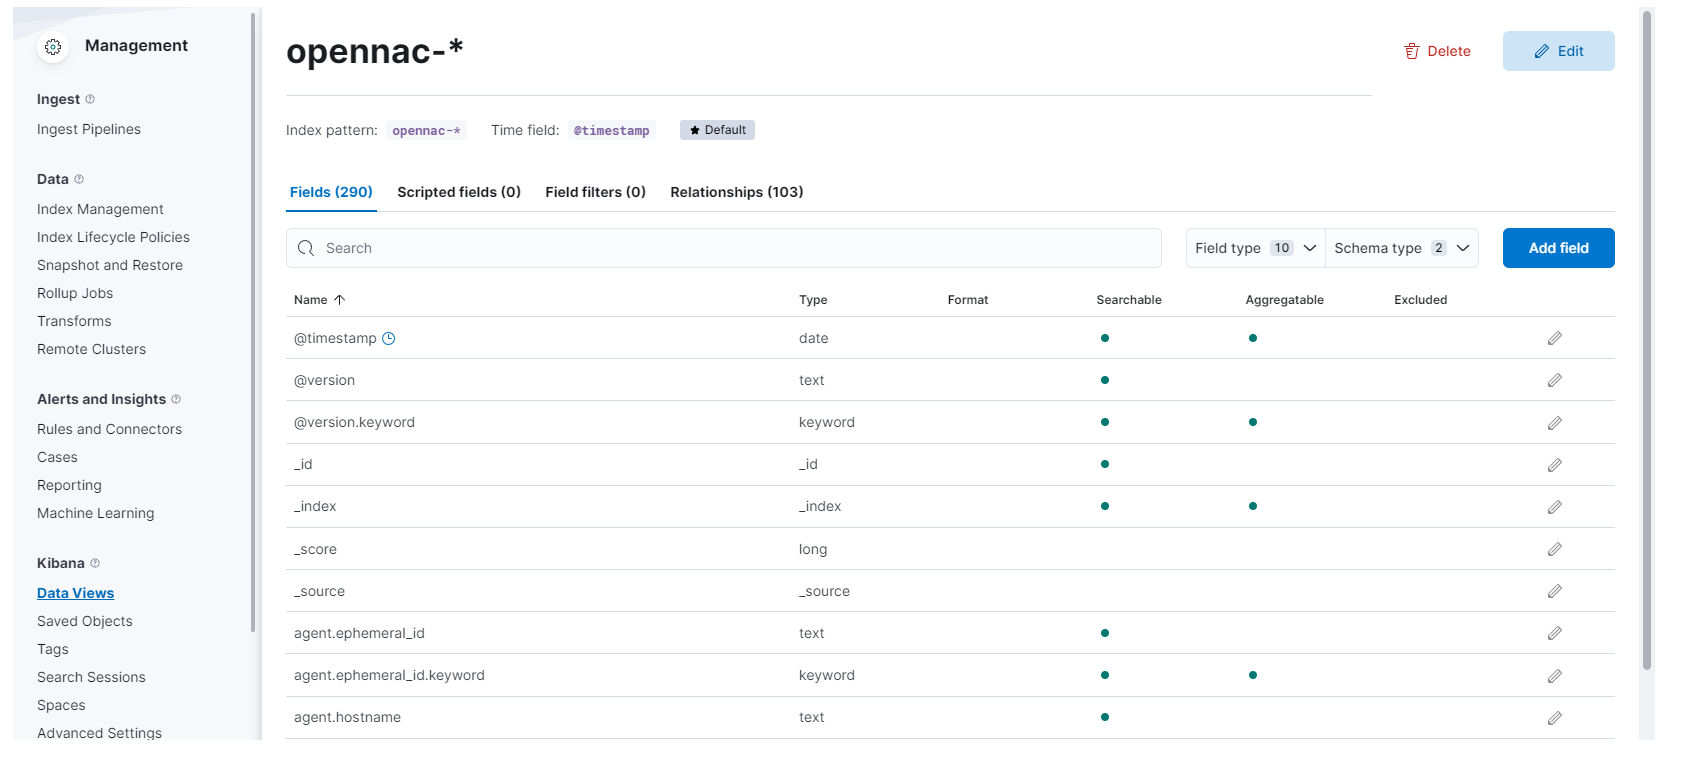
Additionally, there is a list of fields available within the selected index. By selecting Add a field to this data view, it will open the following configuration window where you can create fields to this data view:
You can also Manage this data view:
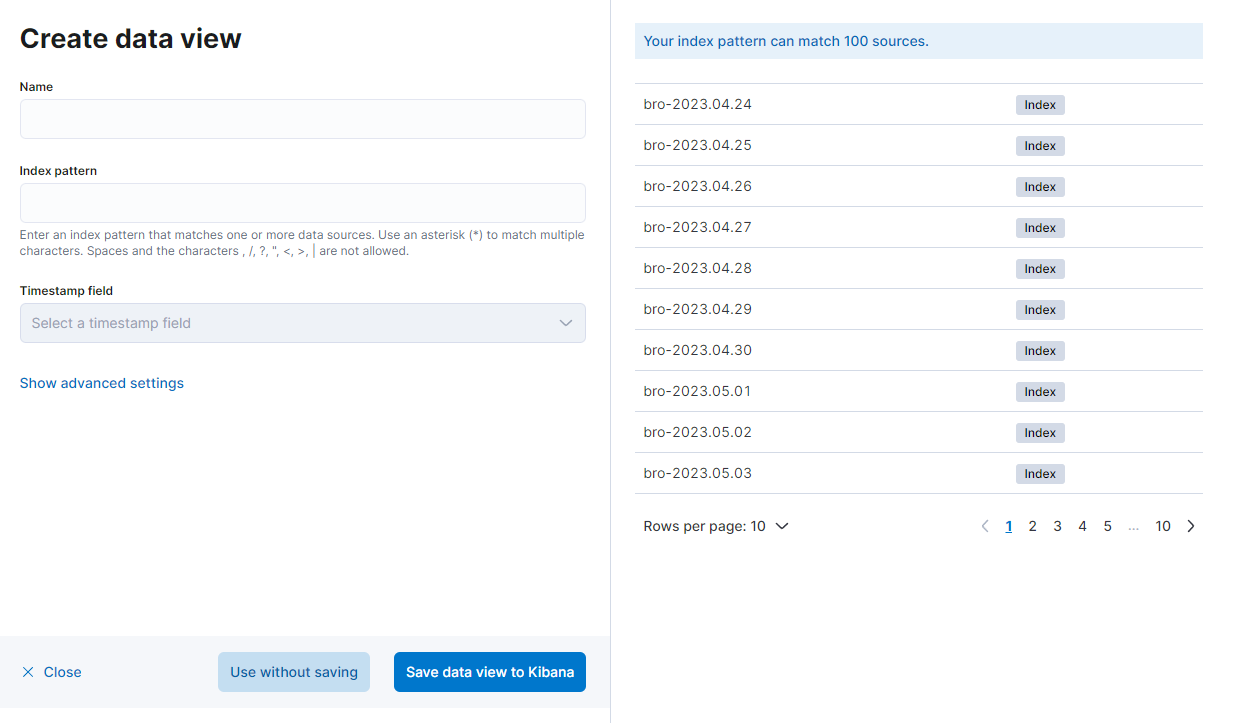
The Create a data view option, displays the following configuration window:
Saved query menu
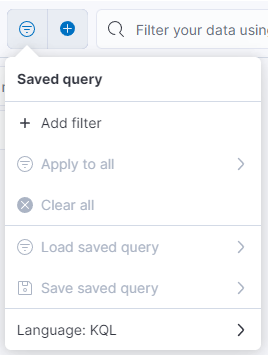
The second option of the toolbar is the saved query menu. From there you can save your search so you can use it later.
Add filter
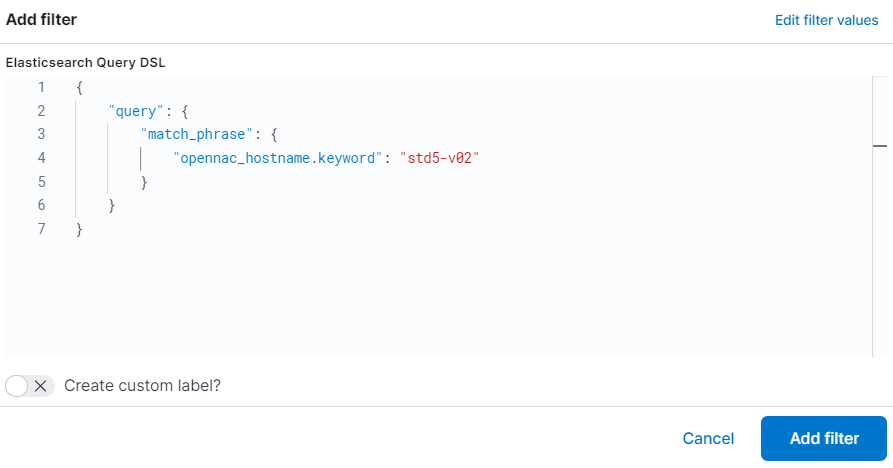
The Add filter button allows you to add a filter with the following format, selecting the field and the condition desired for the filter.
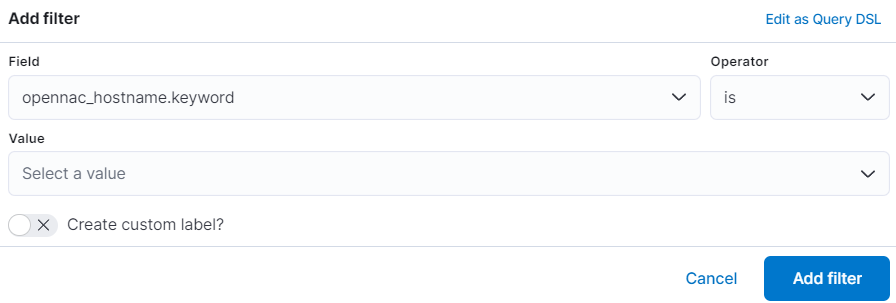
By selecting Edit as Query DSL you can also add a filter as a Query DSL, as shown in the following image.
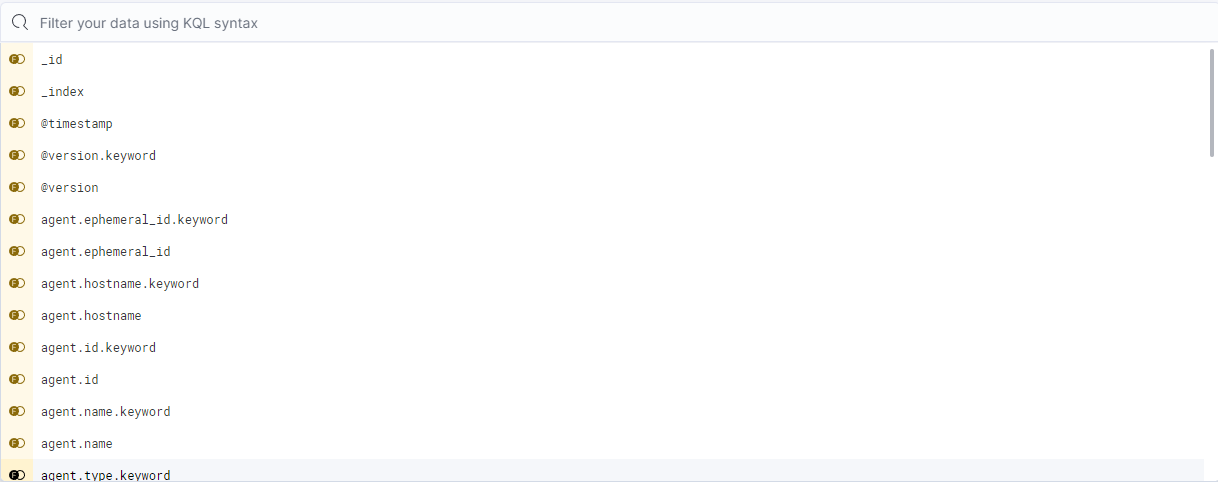
Filter your data using KQL syntax
To search for specific information and create complex queries, you can utilize the Kibana Query Language (KQL). As you type, KQL will provide suggestions for the fields you can search and the operators you can use to build a structured query. This helps you find the data you need more effectively.
For more information about KQL syntax, visit its documentation on https://www.elastic.co/guide/en/kibana/8.7/kuery-query.html.
Lucene query syntax is also available to Kibana users who opt out of the KQL. For more information about the Lucene query syntax, visit its documentation on https://www.elastic.co/guide/en/kibana/8.7/lucene-query.html.
Time frame
You can select the hits you want to see from a specific time frame. The default time frame is Last 15 minutes.
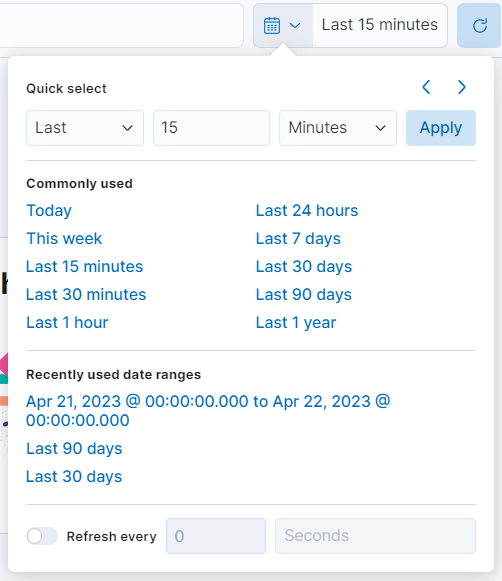
The last button of the toolbar located at the right end corner, refreshes the query.
3.1.12.2.2. Search Input
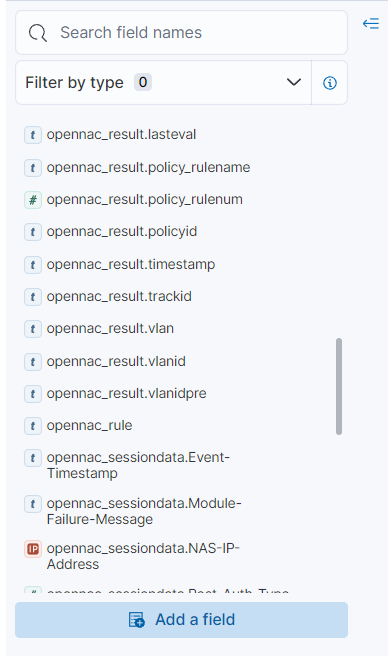
On the Search field names input, you can search by field and additionally, filter by type.
By clicking on the information icon of the Filter by type field, it will display the Filter type help:

3.1.12.2.3. Dashboard display
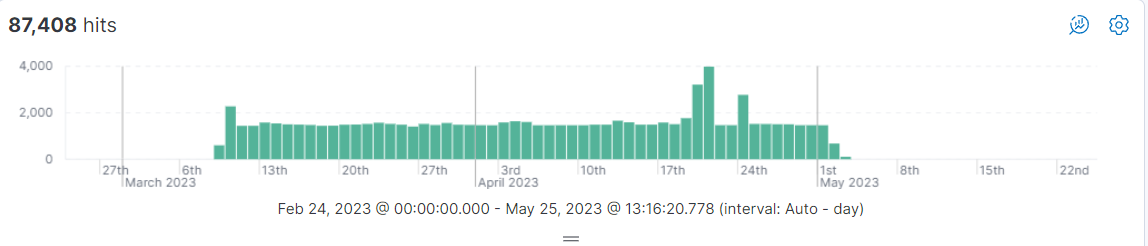
The first dashboard module shows the hits in a timeline graphic. The data is displayed according to the time frame defined in the toolbar.
The second module displays the list of hits matched with all the filters we have applied, from the index selected.
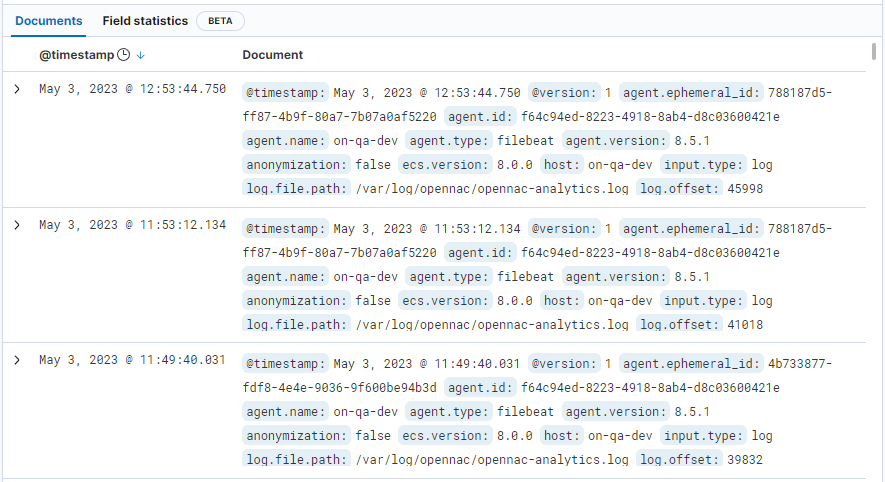
Opening these hits, displays all the fields it contains and theirs values.
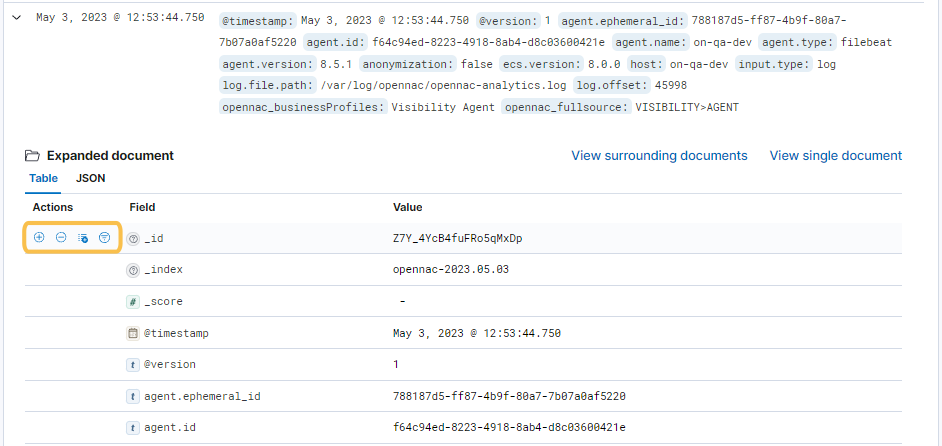
Note that there are some shortcuts that we can apply to a specific hit:
Filter for value: A filter is created including this field and this value.
Filter out value: A filter is created excluding this field and this value.
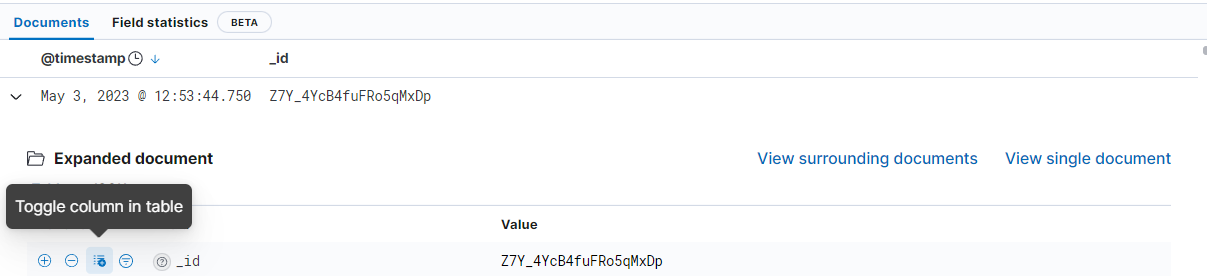
Toggle column in table: A new column is created for this field.
Filter for field present: A filter is created for hits containing this field.
See an example of the Toggle column in table shortcut in the following image: