3.1.12.1. Stack monitoring
The Stack Monitoring feature allows users to monitor the health, performance, and usage of their Elasticsearch cluster, as well as other components of the Elastic Stack.
Upon first-opening this section, you will see the following view:
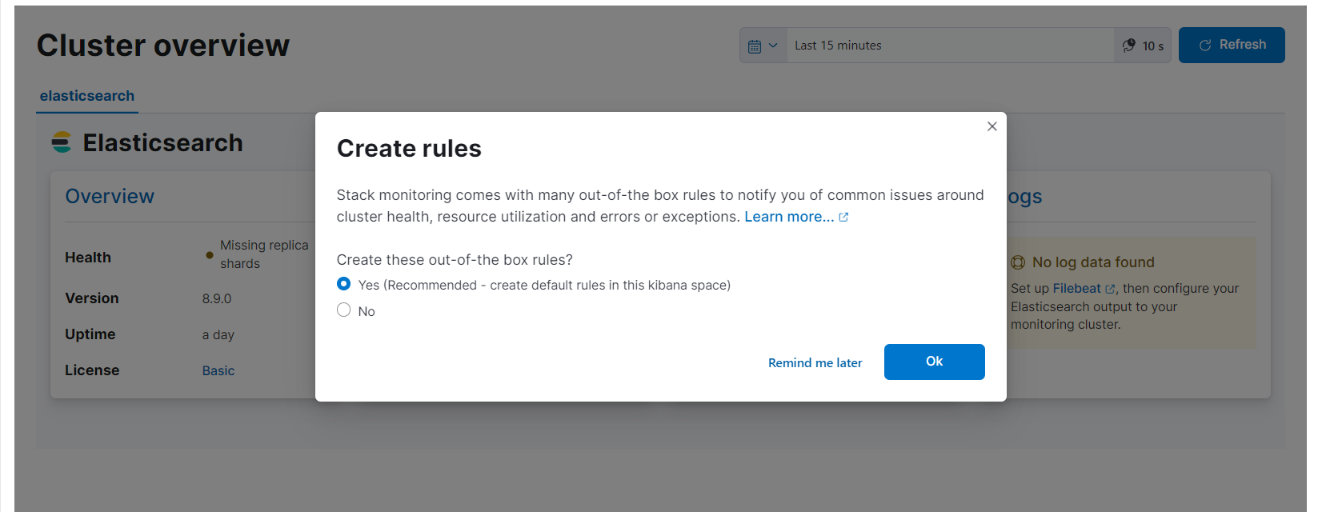
The “Learn more” link displayed in the first view will lead you to the Kibana alerts documentation . The This window suggests using out-of-the-box rules, click on “OK” to accept them proceed to the main view:
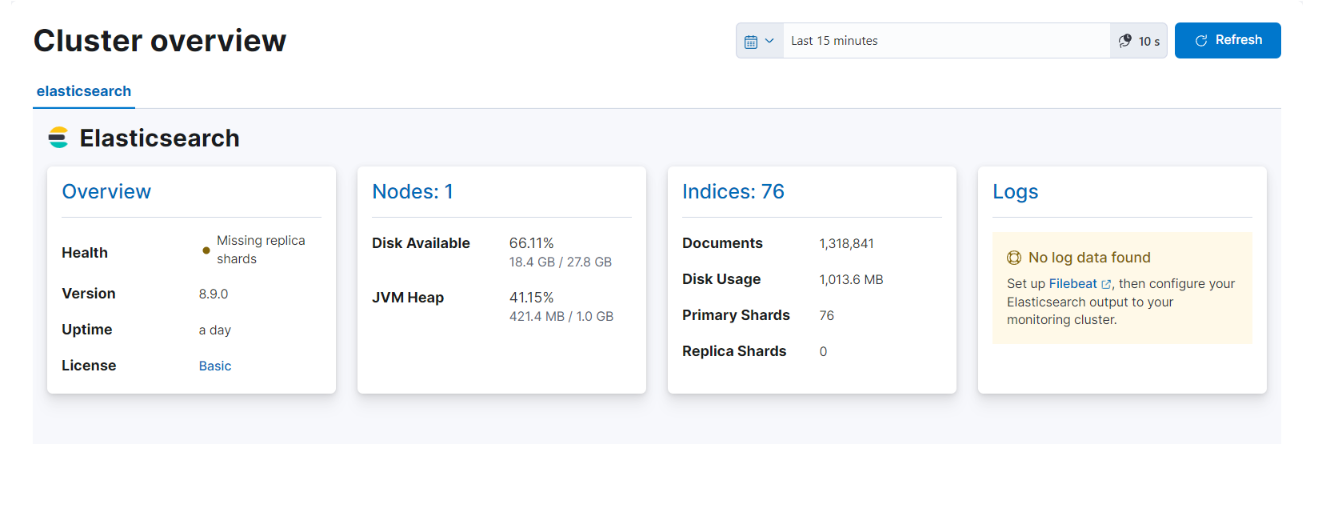
The main view features 3 sections:
Elasticsearch
Kibana
Logstash
All views display a common header:

3.1.12.1.1. Elasticsearch
The Elasticsearch section features four subsections: Overview, Nodes, Indices, and Logs.
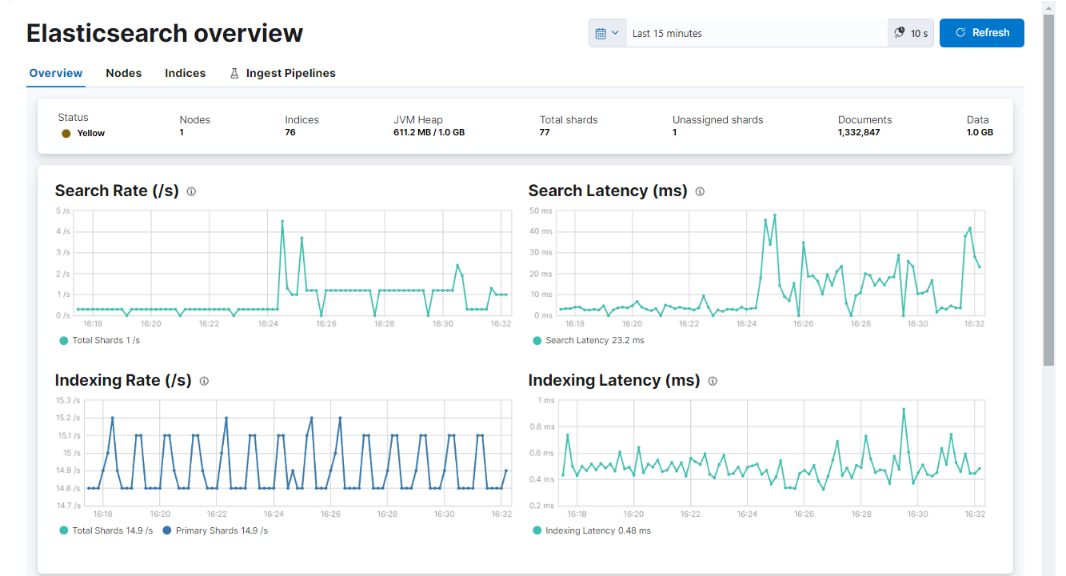
3.1.12.1.1.1. Overview
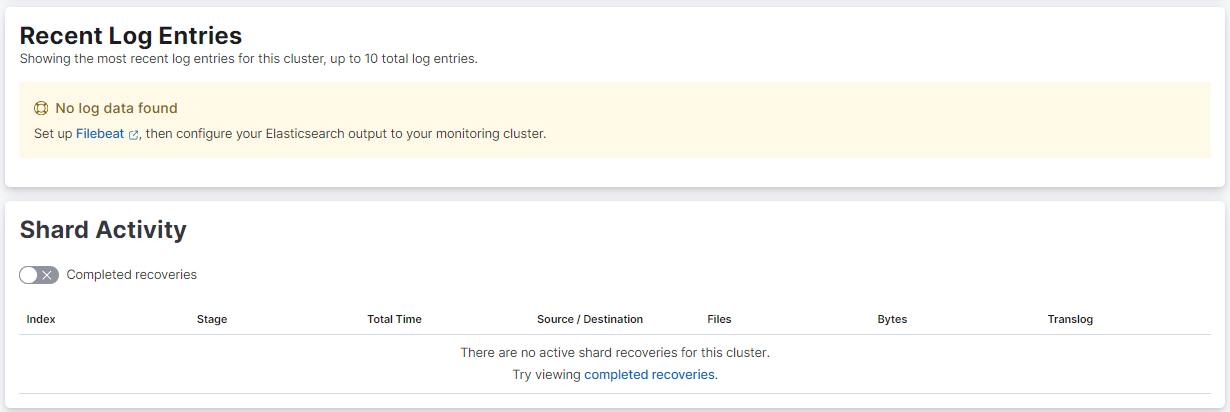
This view features graphical information displayed in a timeline regarding Search Rate, Sear Latency, Indexing Rate, Indexing Latency, Recent Log Entries and Shard Activity.
The same view displays the recent log entries and cluster shard activity:
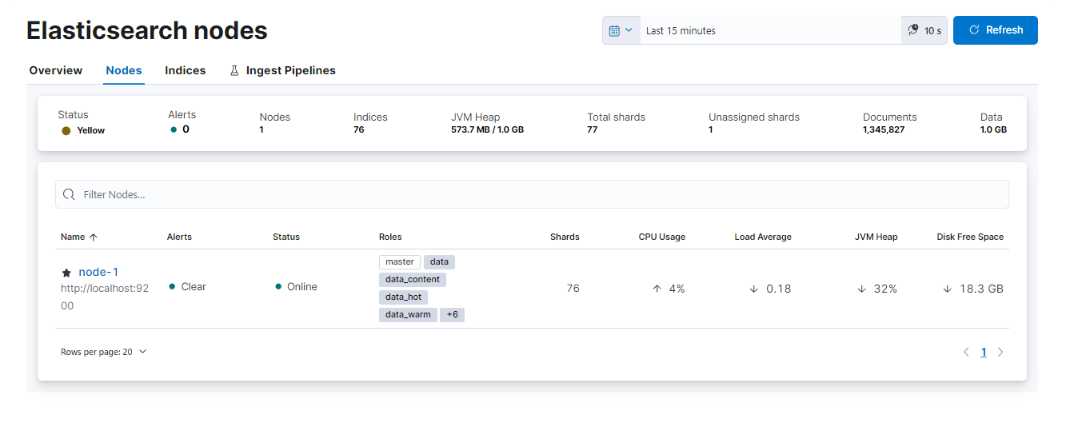
3.1.12.1.1.2. Nodes
This views features a table regarding Node name, Alerts, Node Status, Roles, Shards, CPU Usage, Load Average, JVM Heap, and Disk Free Space.
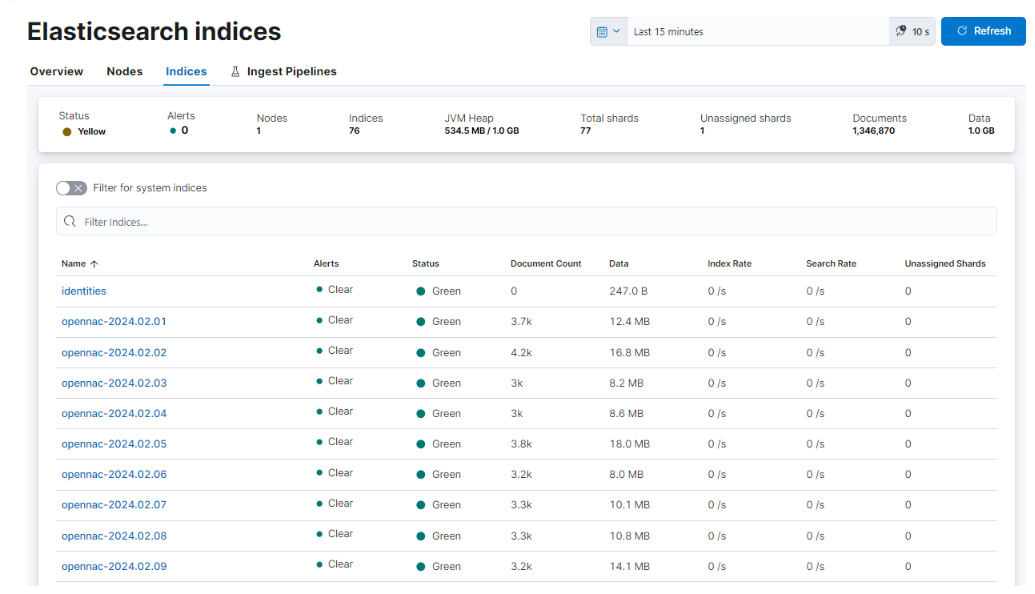
3.1.12.1.1.3. Indices
This views features a table regarding Index name, Alerts, Index Status, Document Count, Data, Index Rate, Search Rate, and Unassigned Shards.
3.1.12.1.1.4. Ingest pipelines
These metrics require installing the Elasticsearch integration.
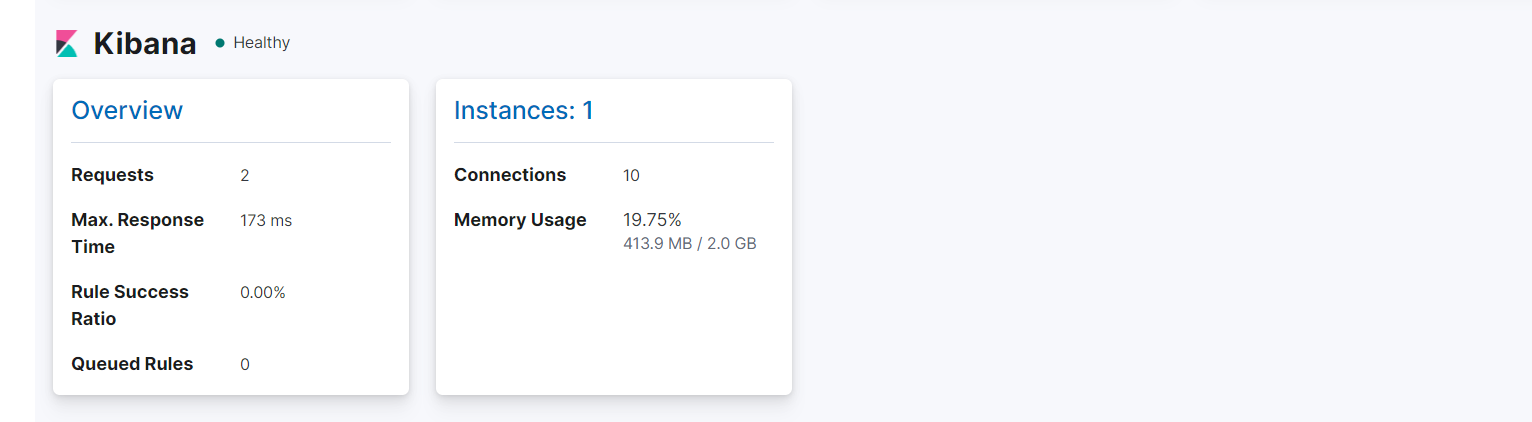
3.1.12.1.2. Kibana
The Kibana section features two subsections: Overview and Instances.
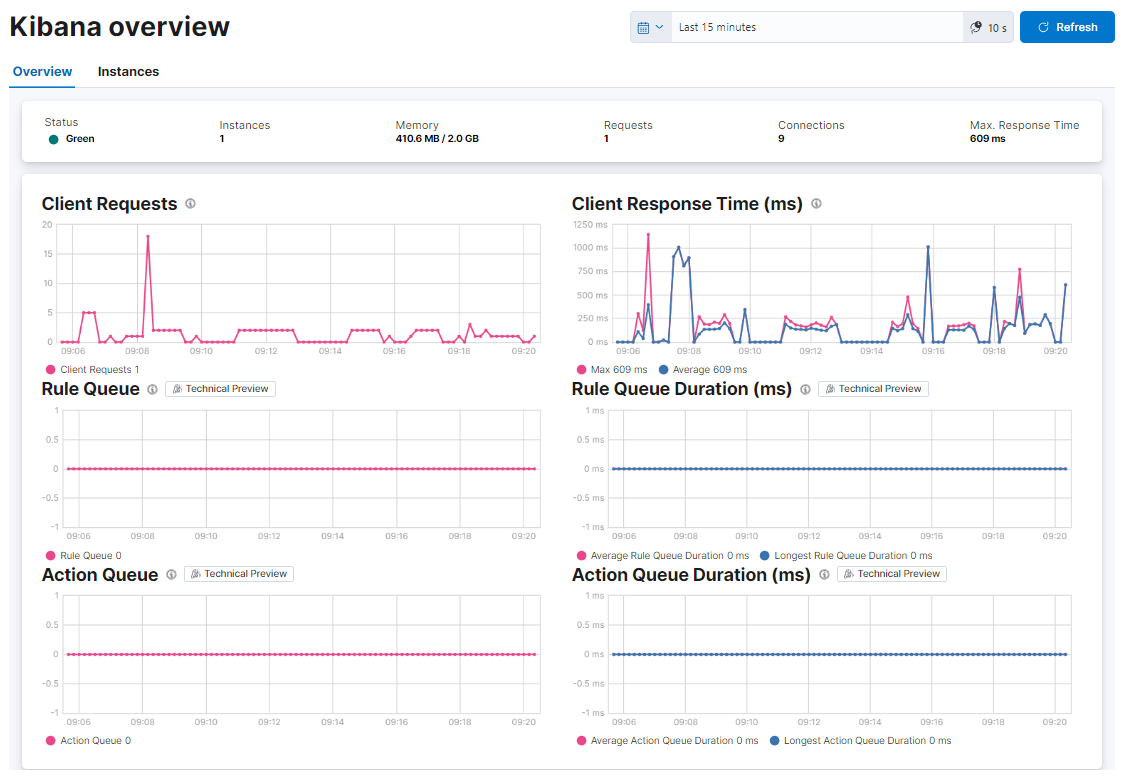
3.1.12.1.2.1. Overview
This view features graphical information displayed in a timeline regarding Client Requests, Client Response Time, Rule Queue, Rule Queue Duration, Action Queue, and Action Queue Duration.
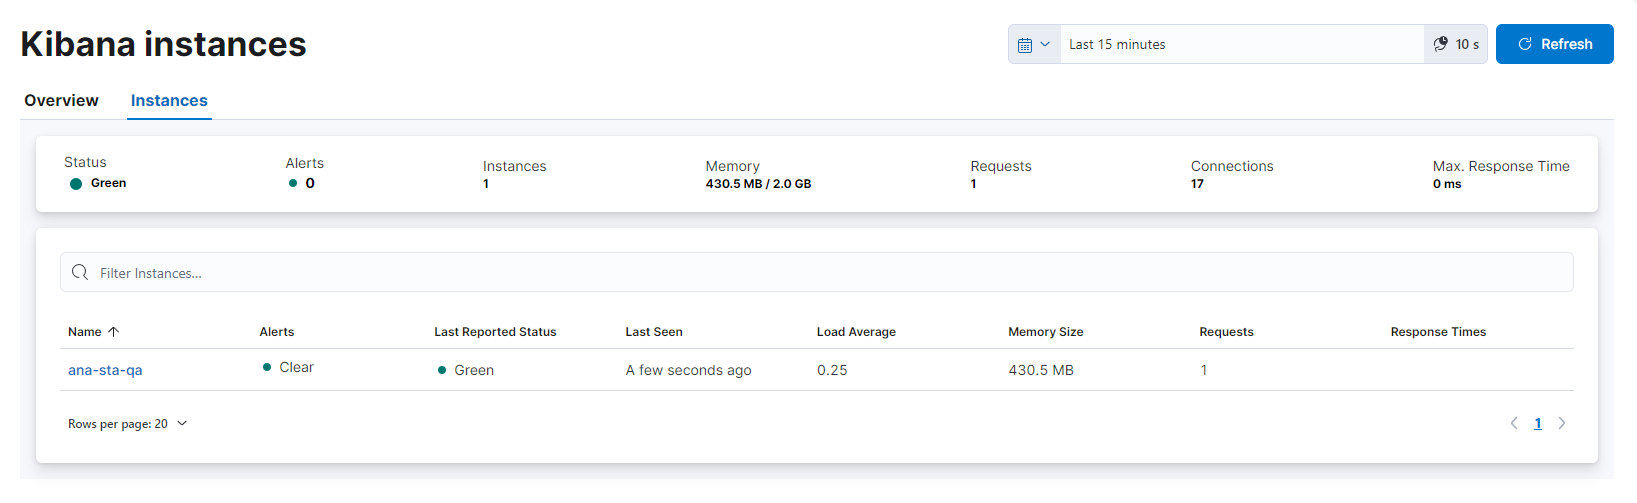
3.1.12.1.2.2. Kibana Instances
This view features a table displaying information relate to the Kibana Instances: Alerts, Lasts Reported Status, Last Seen, Load Average, Memory Size, Requests, Response Times.
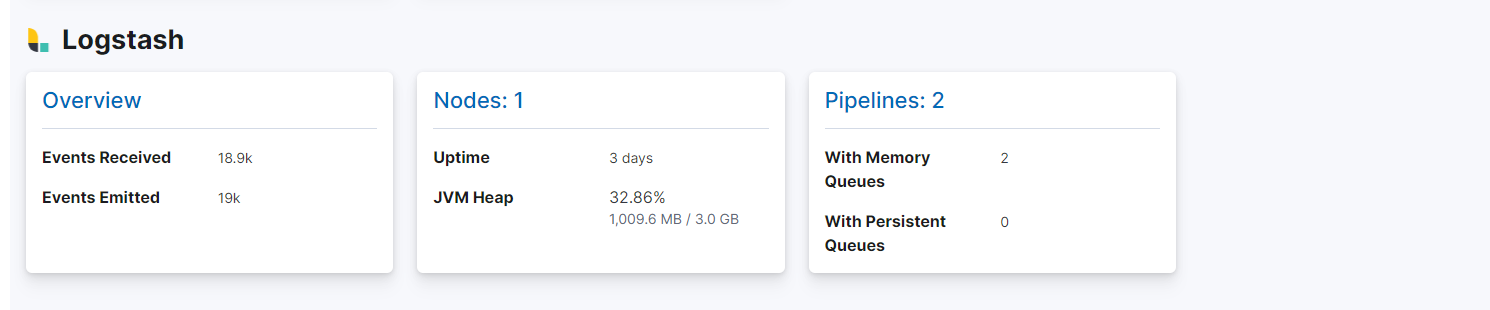
3.1.12.1.3. Logstash
The Logstash section features three subsections: Overview, Logstash Nodes, and Pipelines.
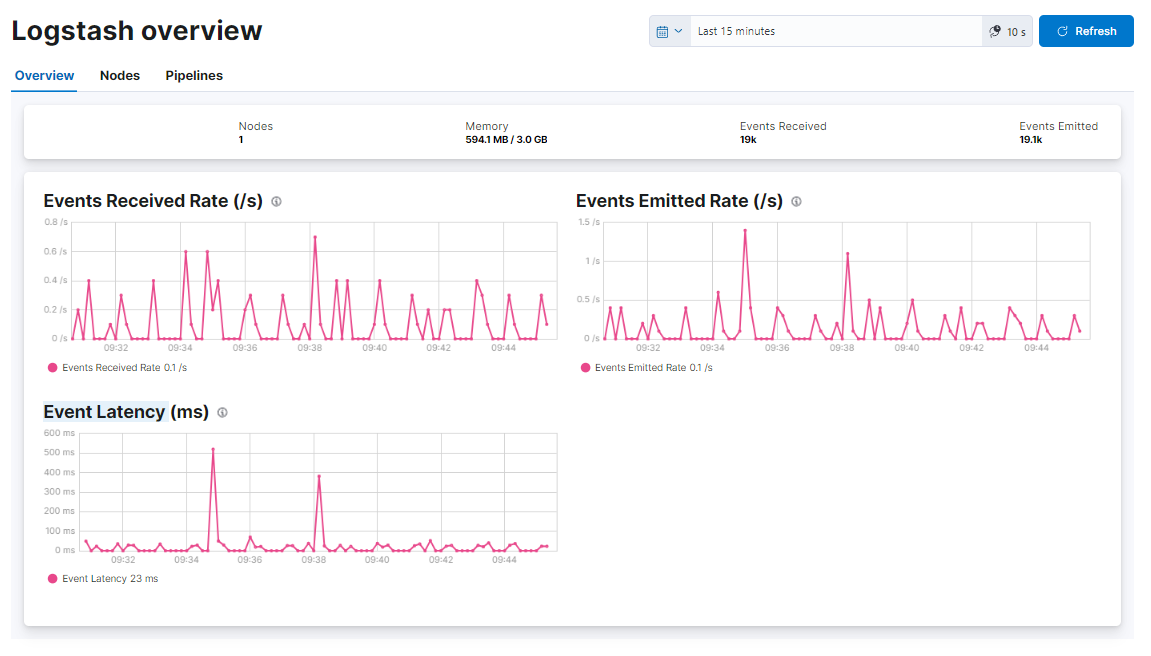
3.1.12.1.3.1. Overview
This view features graphical information displayed in a timeline regarding Events Received Rate, Events Emitted Rate, and Event Latency.
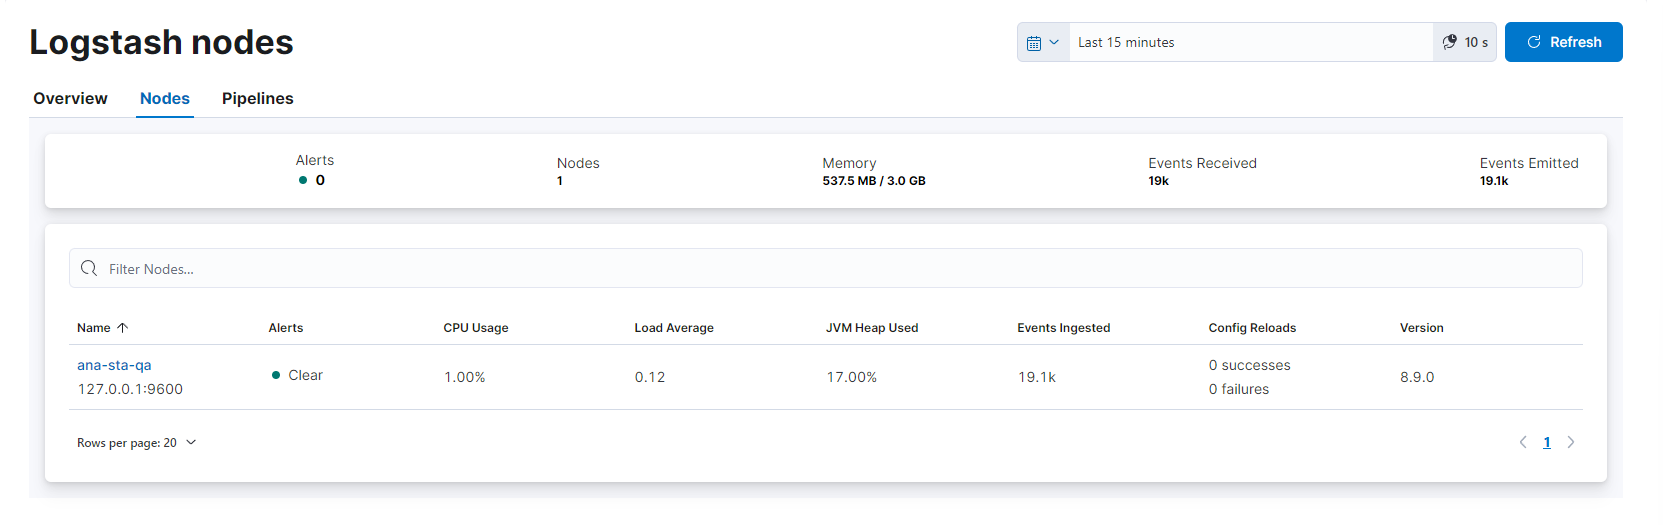
3.1.12.1.3.2. Logstash Nodes
This views features a table for Alerts,CPU Usage, Load Average, JVM Heap Used, Events Ingested, Config Reloads, Version.
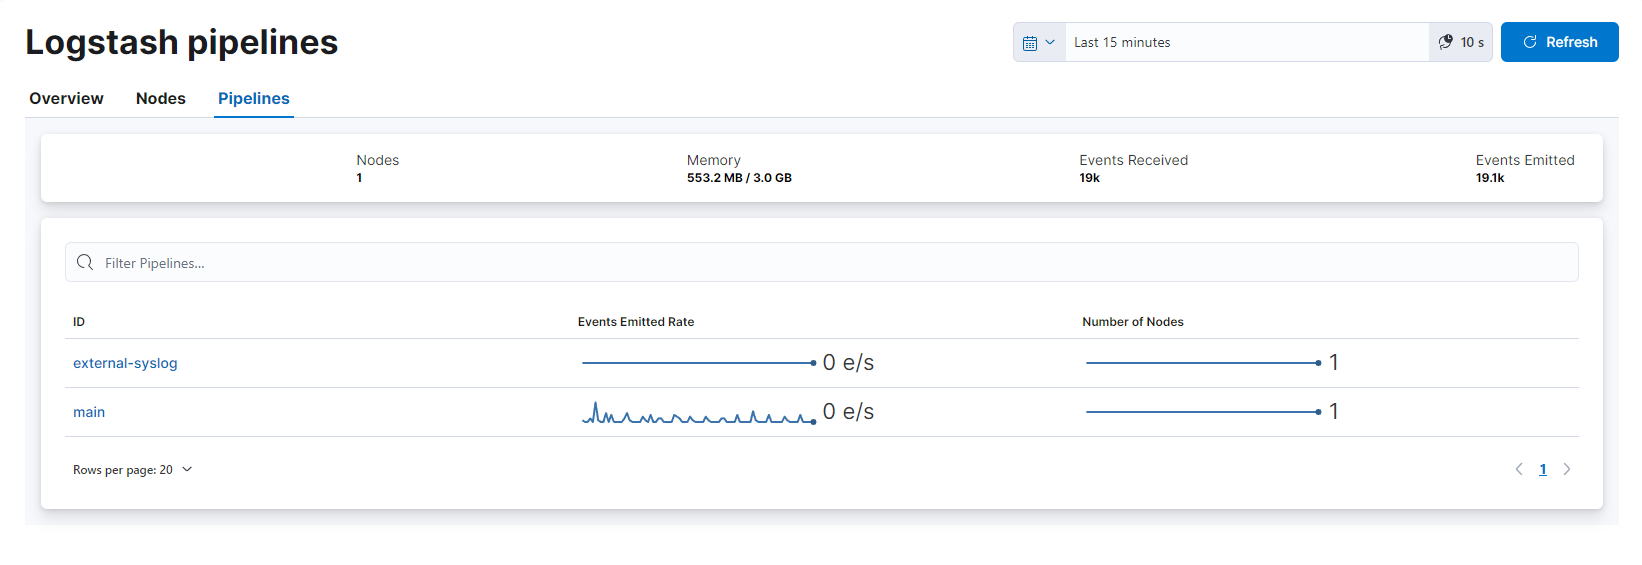
3.1.12.1.3.3. Pipelines
This views features pipelines information: Events Emitted Rate, Number of Nodes.