3.1.1. Overview
After deploying the ON Core (mandatory) and all its components (optional), we have to connect to the OpenNAC Administration Portal -a web interface that allows us to operate and administrate OpenNAC Enterprise technologies.
We have to use the IP just configured during deployment and our favorite browser as an agent.
Open your favorite browser and type https://<ON_Principal_ip_management>/admin. It is important to use /admin to reach the right logon page.
Important
If you are starting from a fresh installation and the SSL certificates have not been configured, OpenNAC Enterprise defaults to using self-signed certificates. This means that on the first access to the Web Portal Administration, you will have to trust the website from your browser as it will be shown as “Not Secure”. To configure your SSL certificates, see Certificates.
The default credentials created when the product is being installed are:
Username: admin
Password: opennac
Note
You should change the password as soon as you are done with the configuration. See Password Management.
The platform will be displayed in Spanish or English depending on the language of your browser. You can switch languages by changing your browser language. If you are using Chrome for example, you should go to Settings > Languages and set the language used to display the Google Chrome UI to Spanish or English.
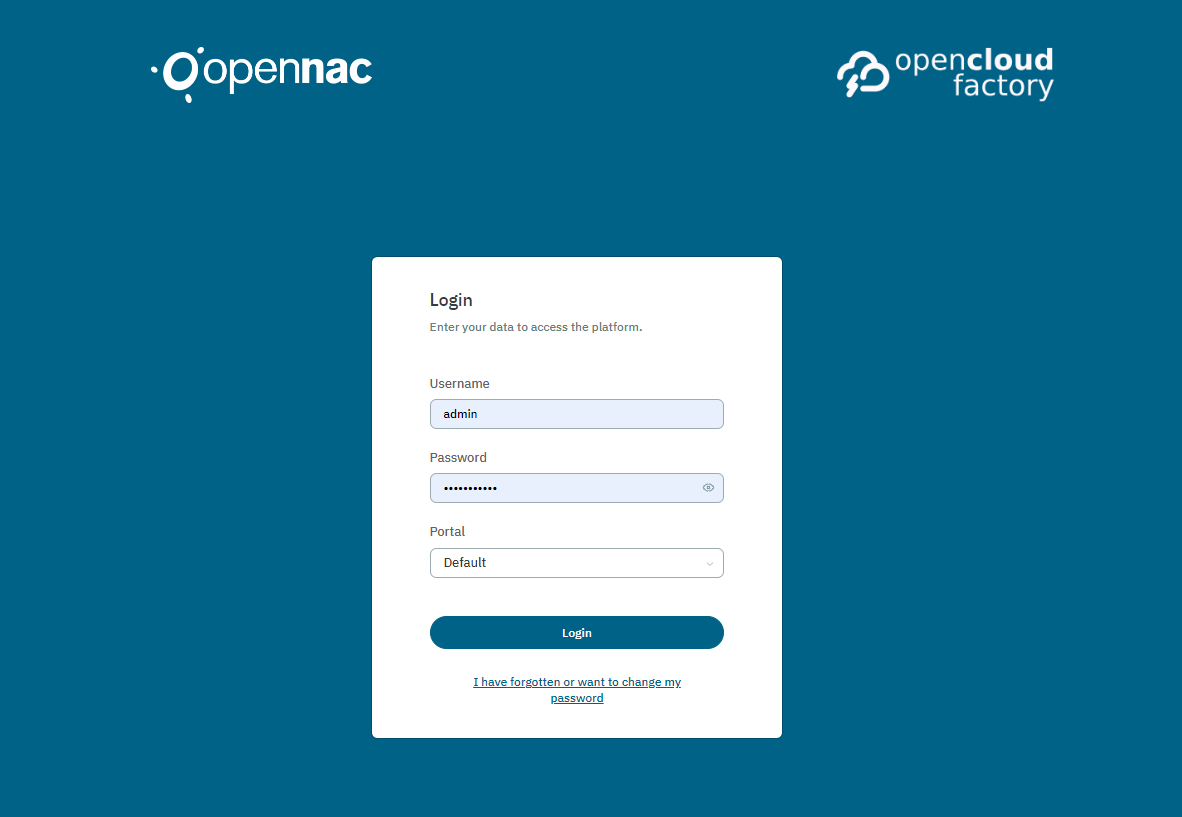
Enter your credentials and in the Portal field, choose Default to enter the Default Administration Portal. The second option called NextGen, will redirect you to the NextGen Administration Portal that is currently only available for the VPN use case.
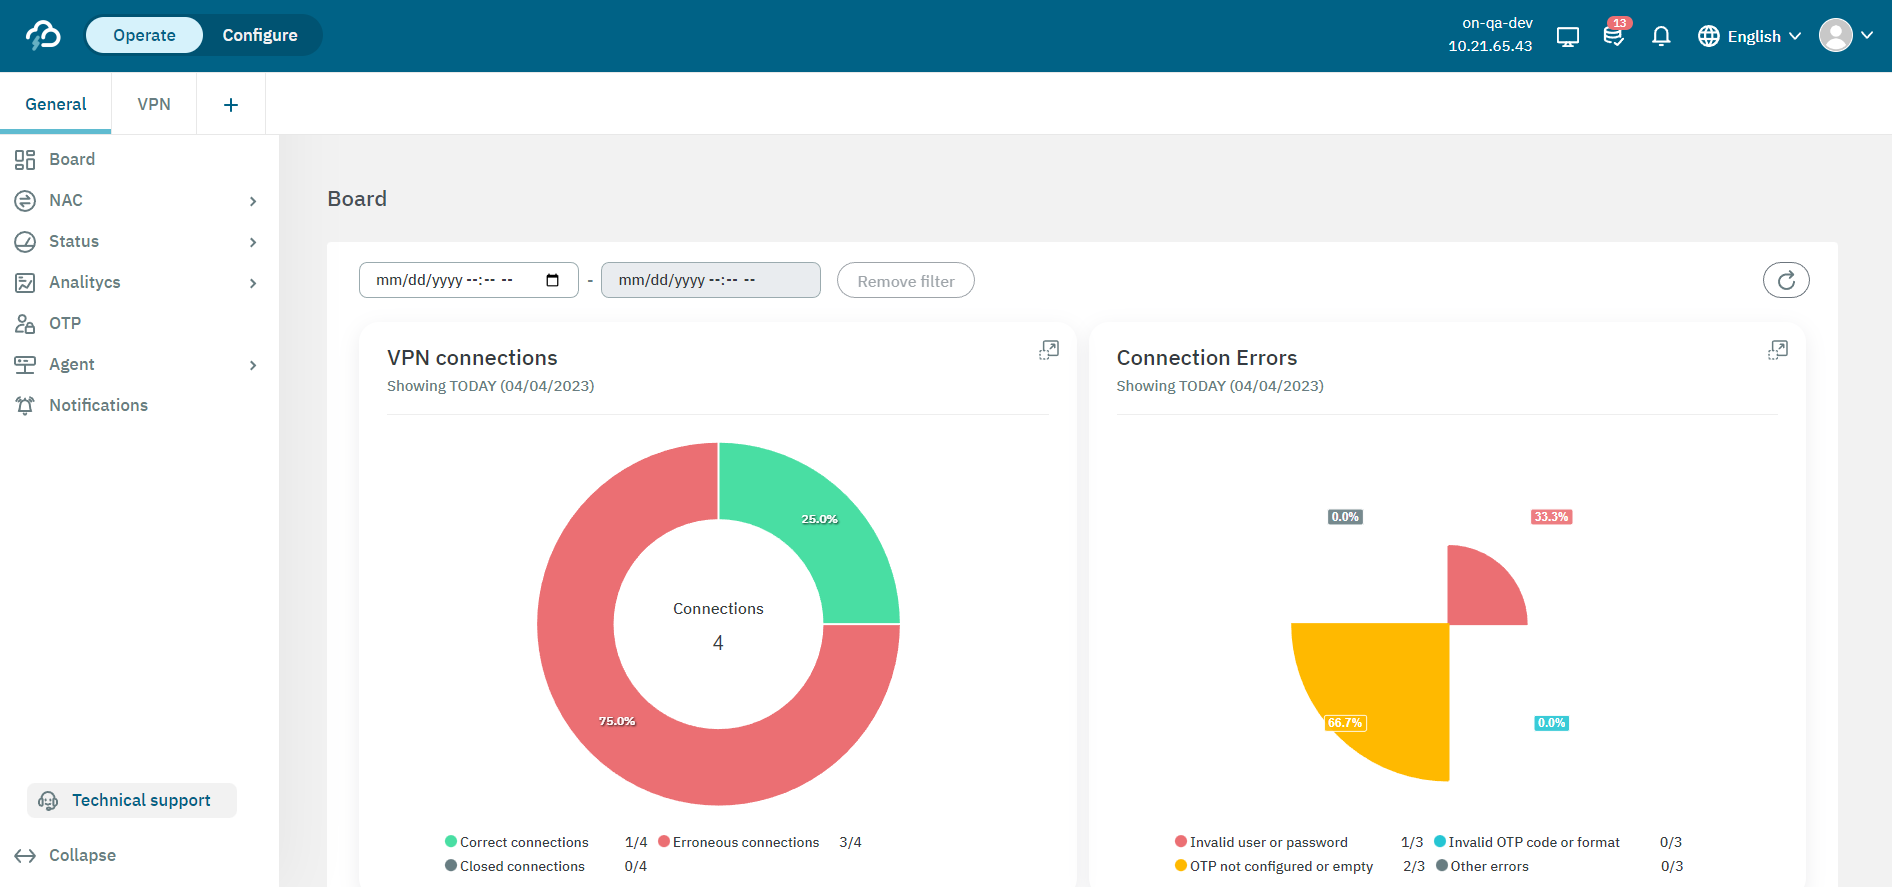
Once connected to the Administration Portal, you will find the main navigation menu on the left side, featuring various sections and subsections that offer different capabilities.
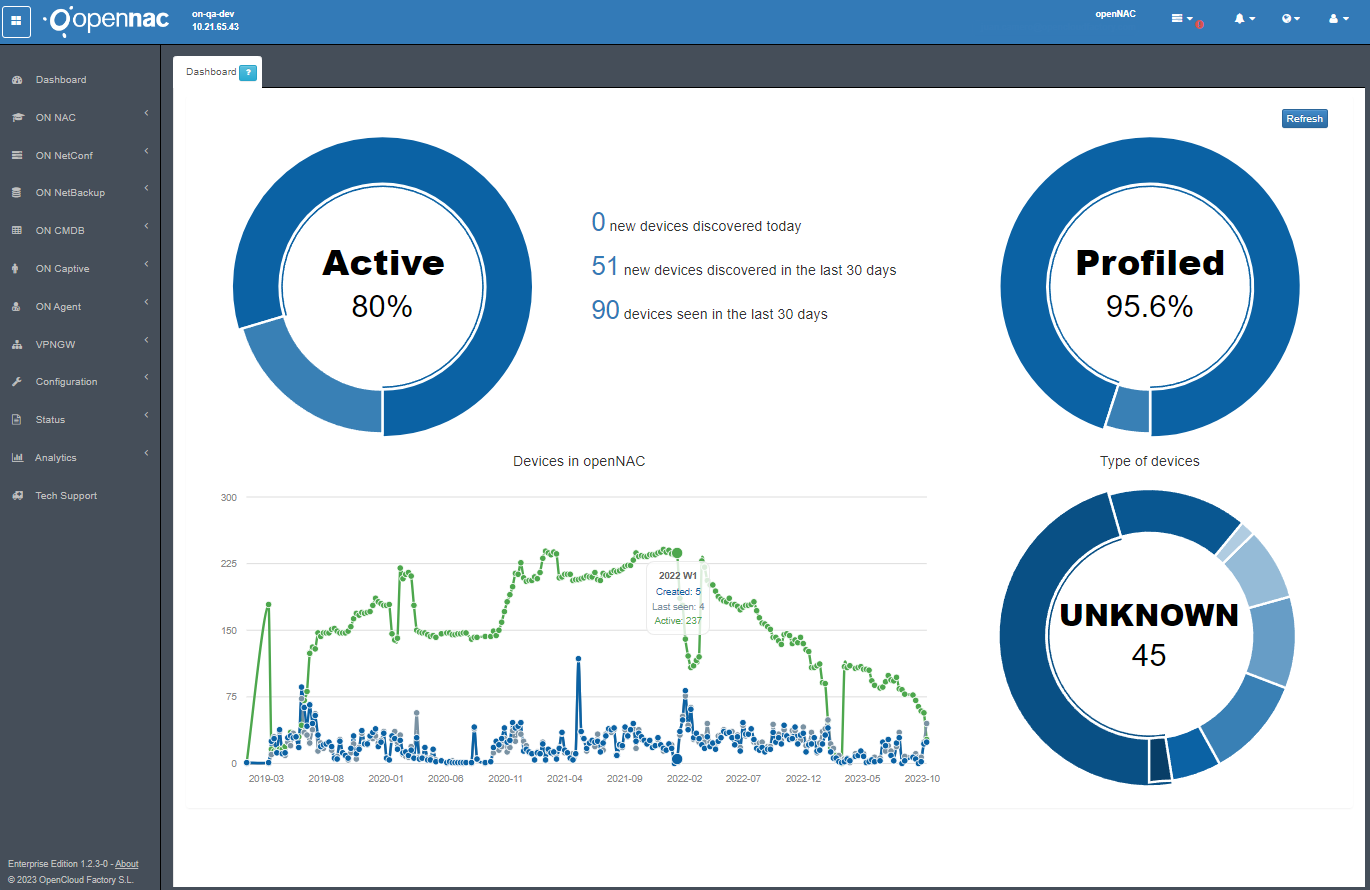
The interface is fast and intuitive for the user. It features tabs to improve user experience and efficient administration.
3.1.1.1. Administration Portal Settings
You can locate the Administration Portal settings at the upper-right corner:
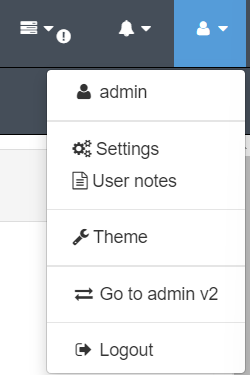
The user status shows the following options:
User session: Displays the user currently logged.
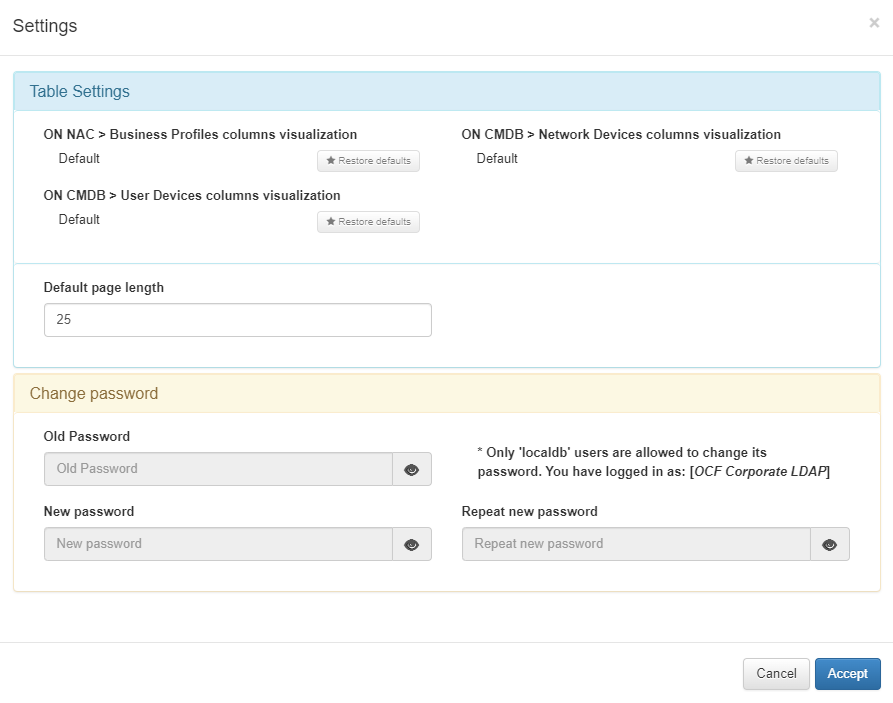
Settings: Allows to change web settings.
Table Settings: Here you can customize the settings of the tables of the openNAC Administration portal. For example, the “Default page length” allows you to define the number of rows per page.
Change password: Allows you to change your password only if you are a localdb user. If you are logged in from an LDAP you will not be able to change your password here.
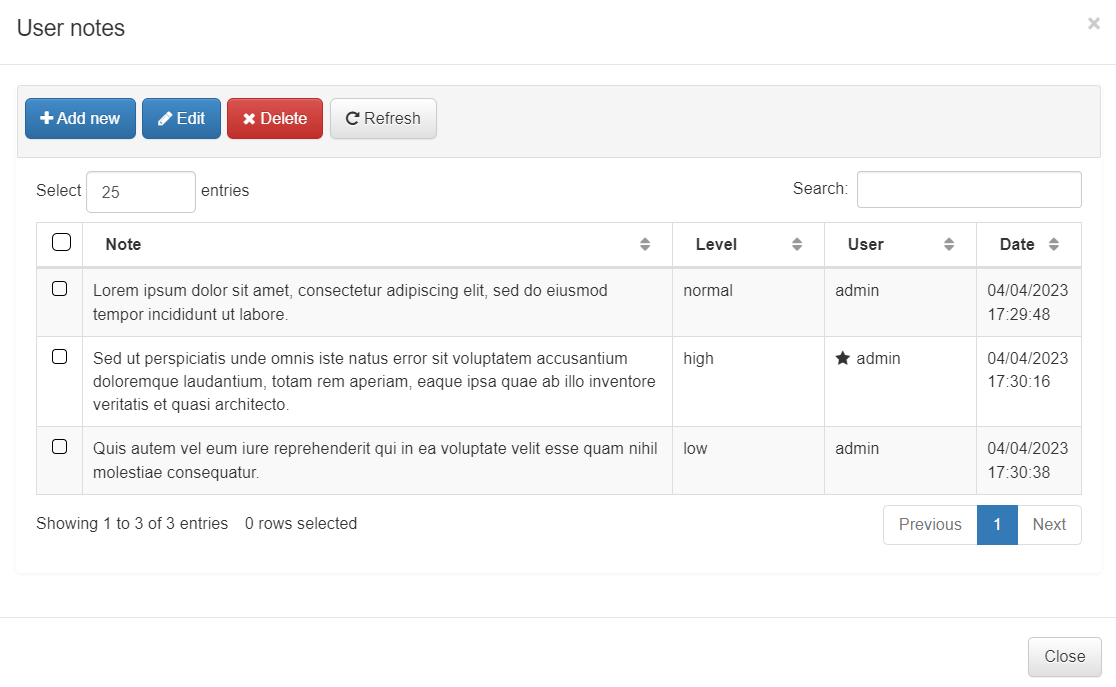
User notes: Here you can create, edit and delete user notes specifying their level (low, normal, or high) and privacy status.
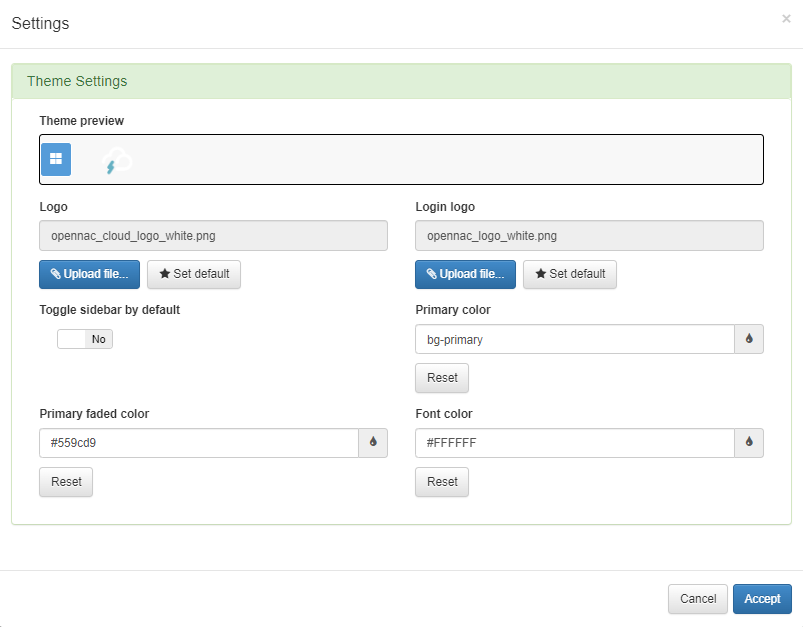
Theme: Allows you to customize the interface theme. You can previsualize the customized settings, change the upper left logo and the login logo among others (upper bar color, font color, etc.)
Go to NextGen Portal: By clicking on it, you will be redirected to the NextGen Portal version.
For a detailed view of this portal, see the V2 Overview section.
Logout: Allows you to log out of the current user session.
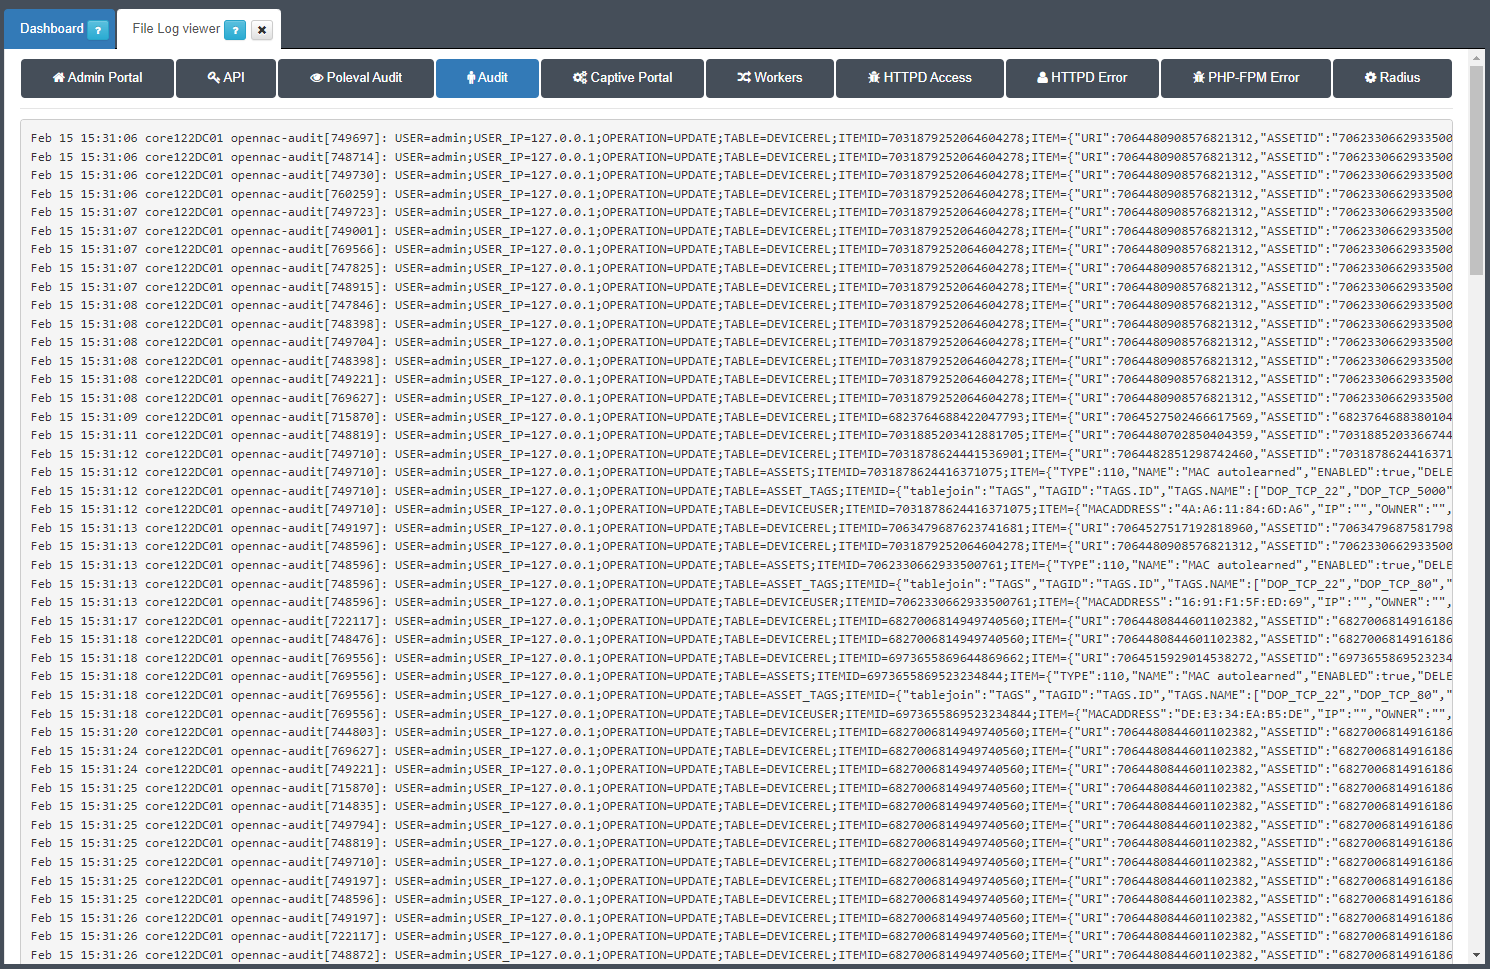
The Web Administration Portal allows reviewing all the changes that have been made during the current user session.

Is possible to review this activity and also the activity for all the users. To view it, go to Status –> File Log Viewer –> Audit
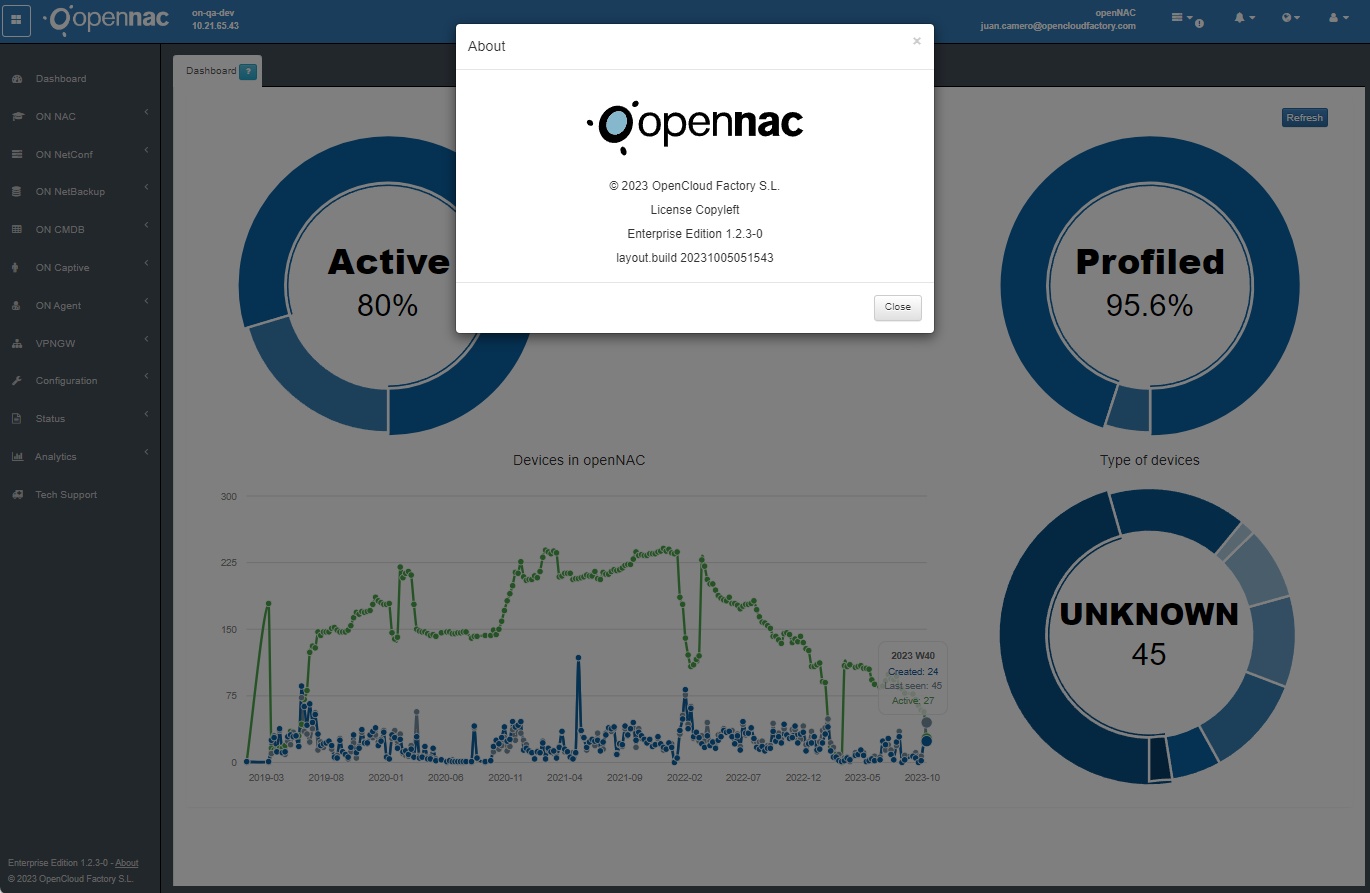
The product’s current version is shown as soon as the OpenNAC Enterprise is deployed, updated, and also after troubleshooting or bug findings. The current version is featured at the bottom left side of the interface, in corporate or in open-source versions. Clicking on About will open a window that shows the current version and the service license information.
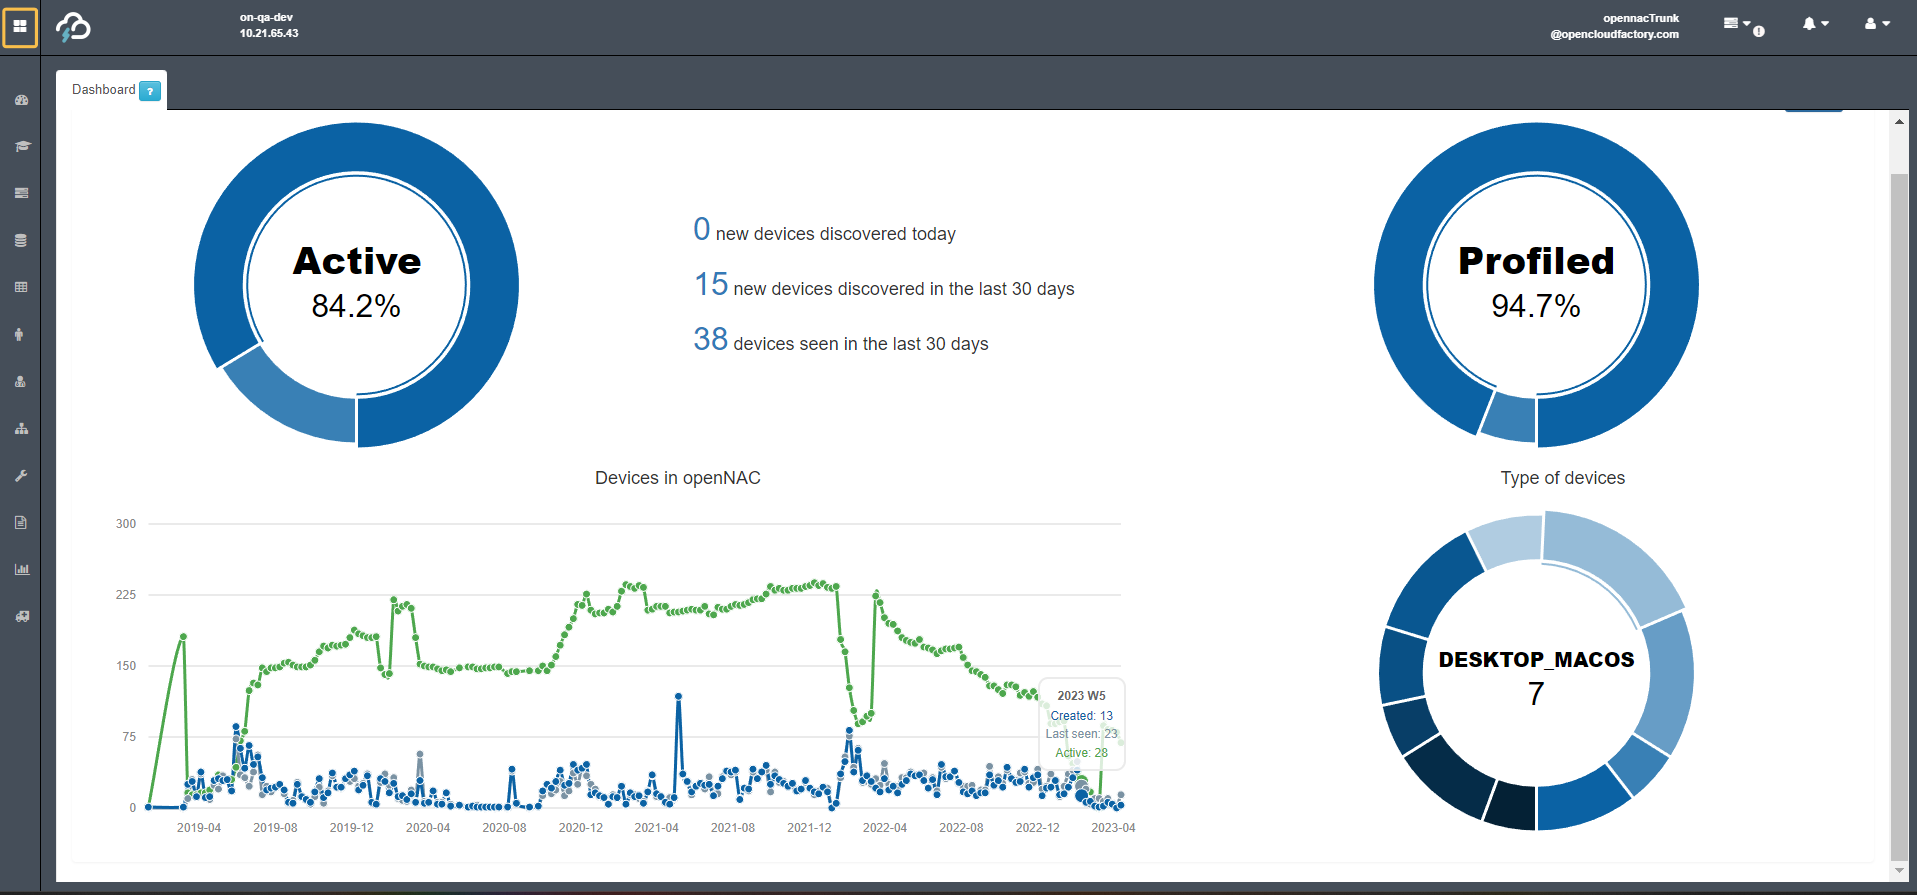
To improve screen space and visibility, the web administration interface can be contracted and expanded by clicking on the squared button located on the upper-left corner. This feature affects only the main menu.
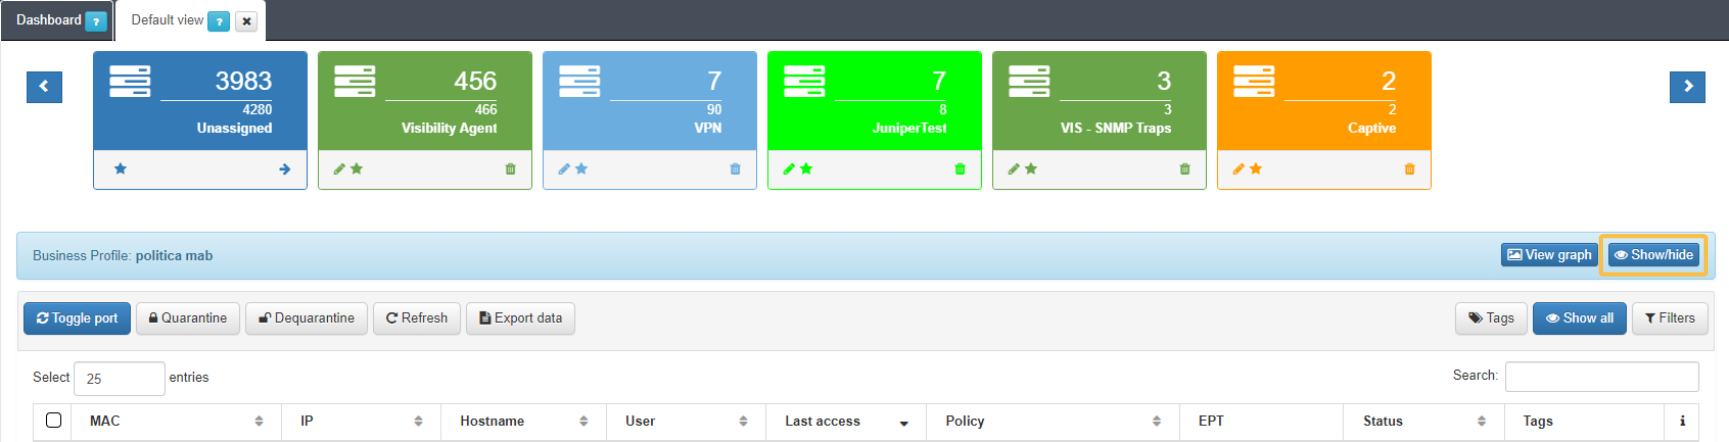
This feature is also available for business profiles at ON NAC -> Business Profiles. With the show/hide button, you can show or hide the Business Profiles to have a wider screen.
If we right-click on an OpenNAC Enterprise tab, we will see three options:

Close: Close the selected tab.
Close Others: Close all tabs except the selected tab.
Close all: Close all tabs.
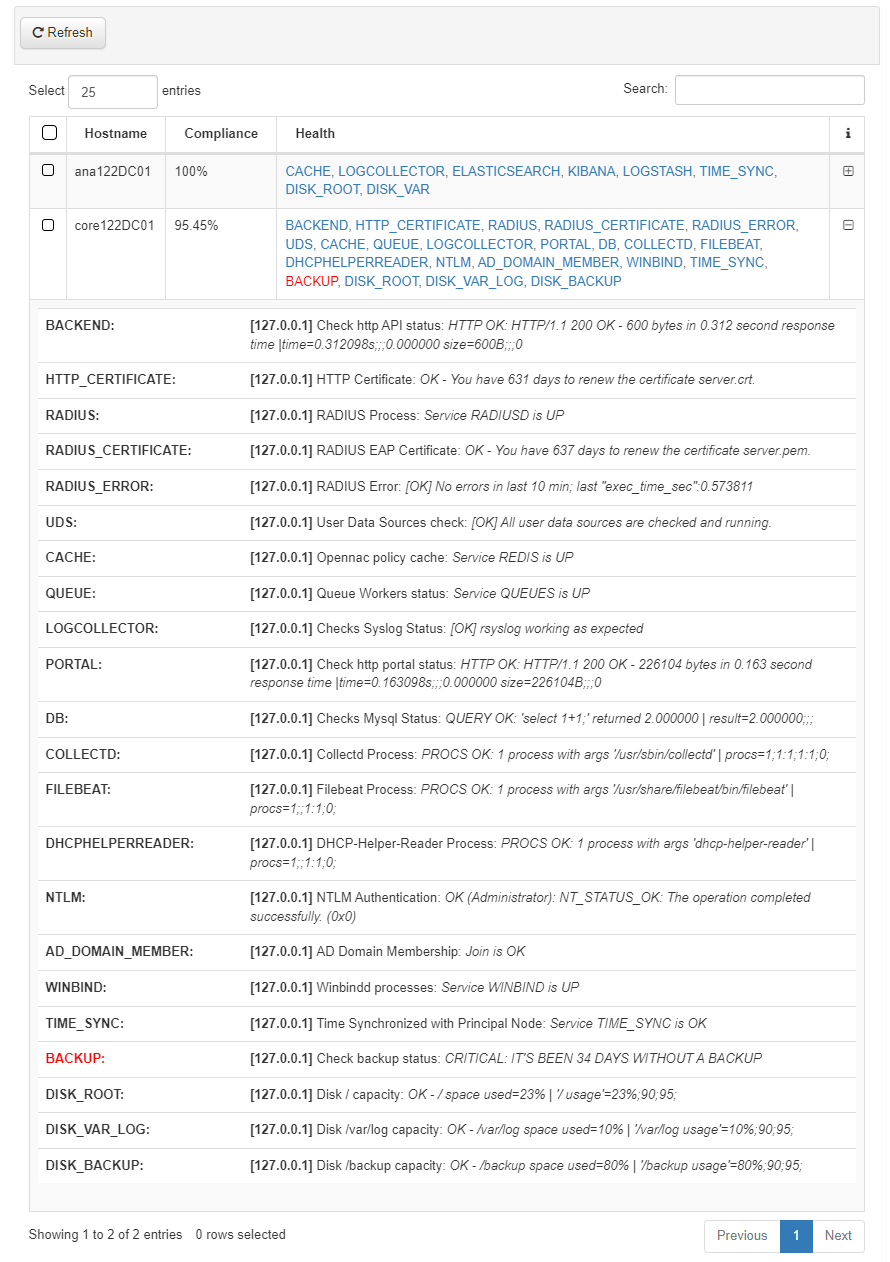
3.1.1.2. Healthcheck
ON Core includes an internal service monitoring feature called healthcheck that allows knowing the current status of OpenNAC Services as shown below. All these monitoring checks can be disabled, enabled, and internally modified (check intervals, the process to be monitored, thresholds assigned, and many others).
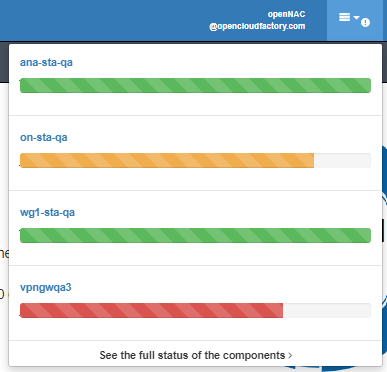
There are a few default services under this monitoring feature (ON Core related). You can see the details by clicking on See full status of onNAC infrastructure:
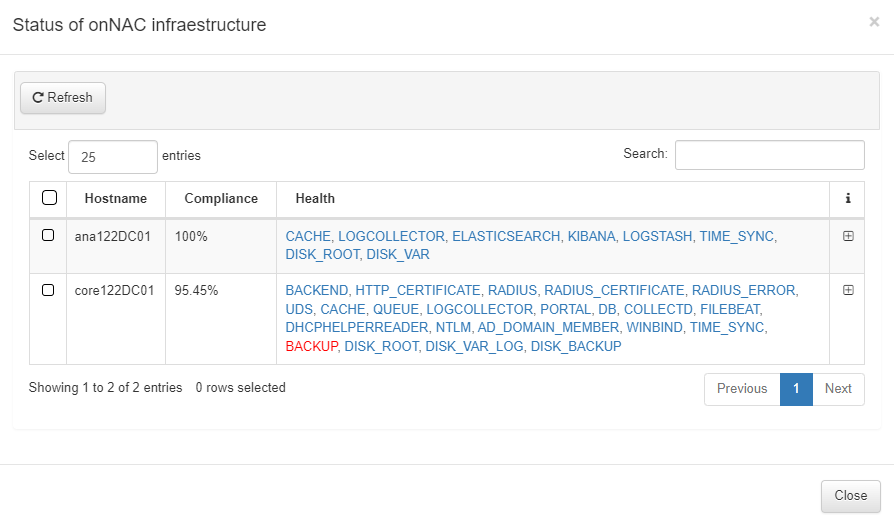
Backend: Checks that the API services work properly. API is one the main components of the solutions.
HTTP Certificate: Checks if the HTTP certificate has expired.
Radius: Checks that the RADIUS service is up and running.
Radius Certificate: Checks if the RADIUS certificate has expired.
Radius Error: Shows if there have been any RADIUS errors.
UDS (User Data Source): Checks the connection with identities’ databases.
Cache: Checks that the REDIS service is up and running.
Queues: These queues are used by workers to publish all the asynchronous jobs.
Log Collector: Monitors syslog services.
Portal: Monitors the administration portal (if it is up and running as excepted).
DB: Monitors database status, configuration, users, CMDB assets and product persistence rely on this component.
Collectd: Performance graphs published in the administration portal rely on these processes.
Filebeat: Checks the FILEBEAT process status.
DHCP Helper Reader: Reads the information collected by the DHCP Server. This information is normally sent by network devices, IP helpers or DHCP relay agents and must be pointed to ON Core. OpenNAC never replies to any DHCP request but this will store the information for profiling and inventory processes.
NTLM: Checks the NTLM authentication against the Active Directory (AD).
AD Domain Member: Checks that the host maintains the correct link with its AD.
Winbind: Checks that the WINBIND service is up and running.
Tyme Sync: Checks that the hour is synchronized with the ON Principal node and the TIME_SYNC service is active and running.
Backup: Checks the days from the last backup.
Disk root: Checks the percentage of the disk used.
Disk var log: Checks the percentage used of the disk /var/log
Disk backup: check the percentage used of the disk /backup
You can edit the file located at /usr/share/opennac/healthcheck/healthcheck.ini. From this path you can change monitoring parameters and its options on every server. Monitoring checks are based on API queries. ON Core includes an API RESTfull that allows monitoring the main components from outside of the product OpenNAC API.
By clicking on the + icon, you can expand the information and see more details about each service.
Note
If you are opening a support case, please attach the expanded information since this is the most detailed explanation of the alert.