3.1.12.4.4. UNAC volumetry
Following the drill-down approach of the UNAC section, the UNAC volumetry dashboard displays detailed information about connections.
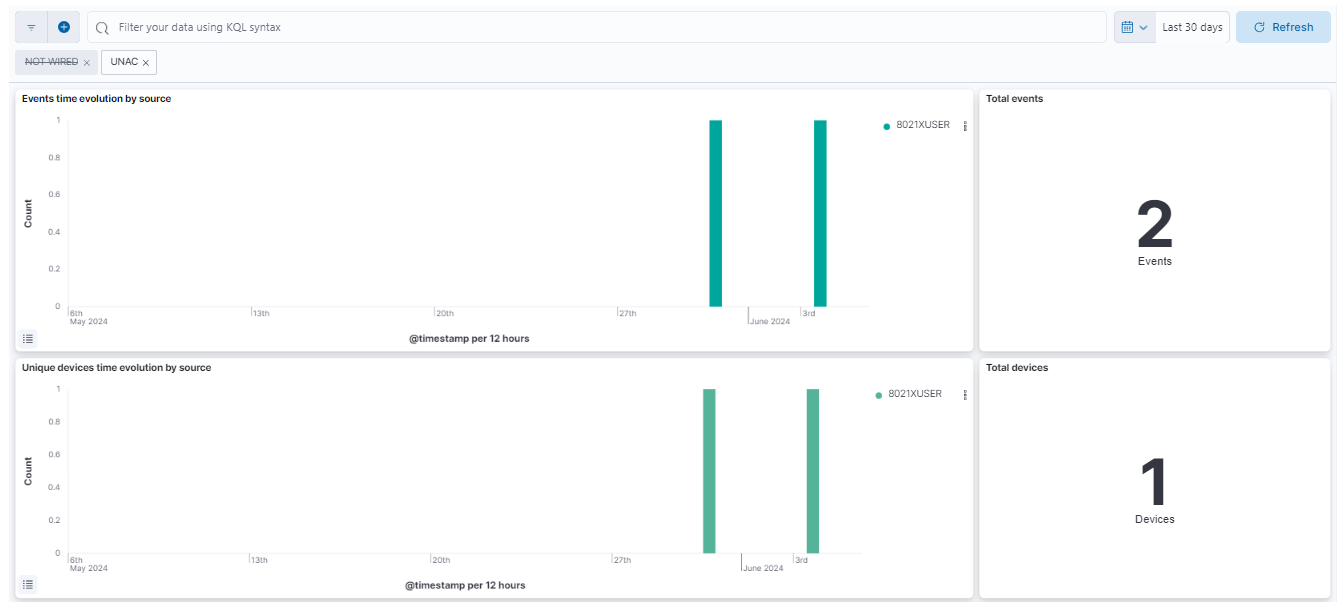
Events time evolution by source: The events timeline by source (SNP, 8021XUSER, IP, VPN)
Total events: The total number of opennac events.
Unique devices time evolution by source: The unique devices timeline by source (SNP, 8021XUSER, IP, VPN)
Total devices: The total number devices that generate opennac events.
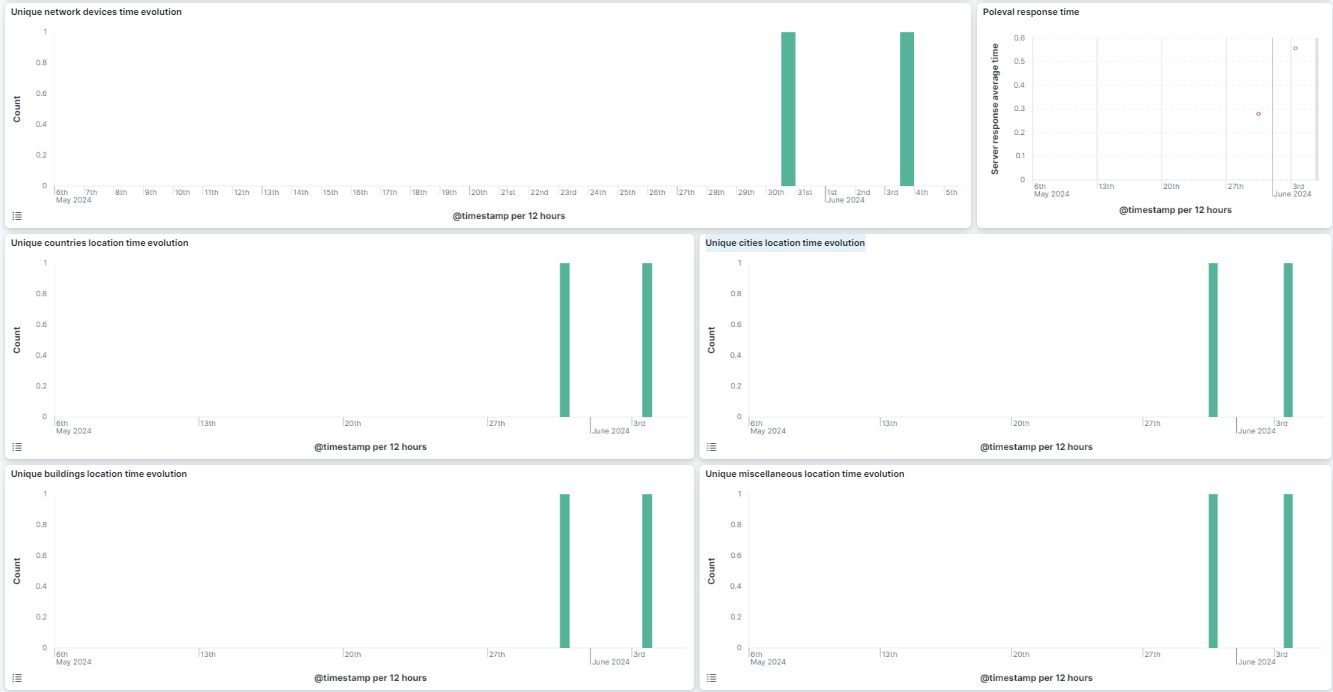
Unique network devices time evolution: The unique network devices timeline.
Poleval response time: A timestamp that shows poleval response time per 30 seconds.
Unique countries location time evolution: The unique countries location timeline.
Unique cities location time evolution: The unique cities location timeline.
Unique building location time evolution: The unique building location timeline.
Unique miscellaneous location time evolution: The unique miscellaneous location timeline.
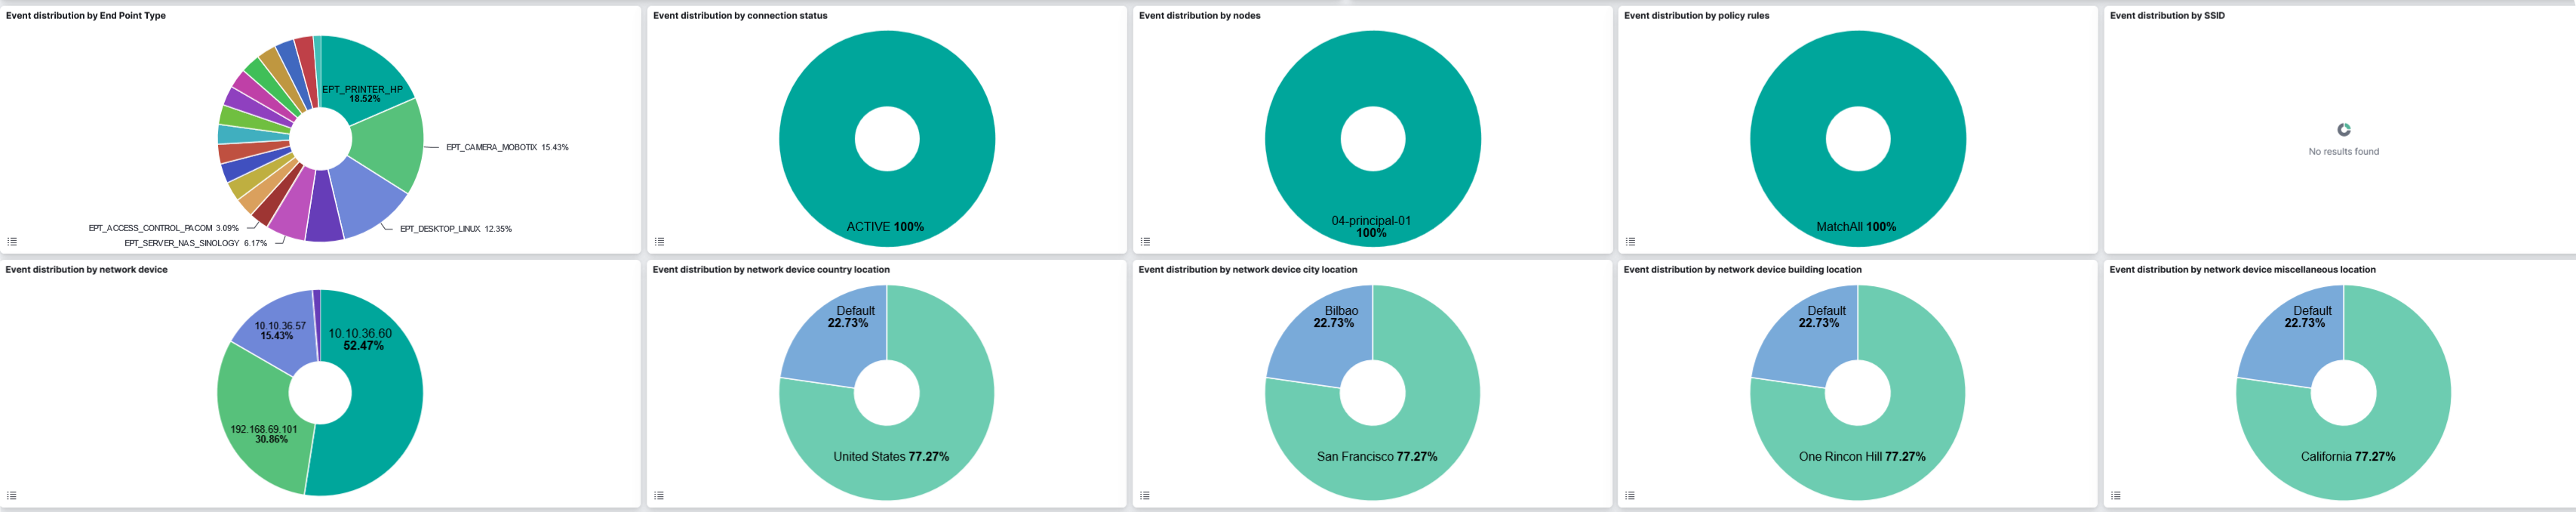
Event distribution by End Point type: A pie chart that displays connections by their Endpoint type (EPT tag).
Event distribution by connection status: A pie chart that displays the connection status distribution.
Event distribution by nodes: A pie chart that displays connections by nodes hostname.
Event distribution by policy rules: A pie chart that displays connections by policy rules.
Event distribution by SSID: A pie chart that displays connections by different Wi-Fi network identifiers in the environment.
Event distribution by network device: A pie chart that displays connections by network device.
Event distribution by network device country location: A pie chart that displays connections by network device country location.
Event distribution by network device city location: A pie chart that displays connections by network device city location.
Event distribution by network device building location: A pie chart that displays connections by network device building location.
Event distribution by network device miscellaneous network: A pie chart that displays connections by network device miscellaneous network (LMI tag).
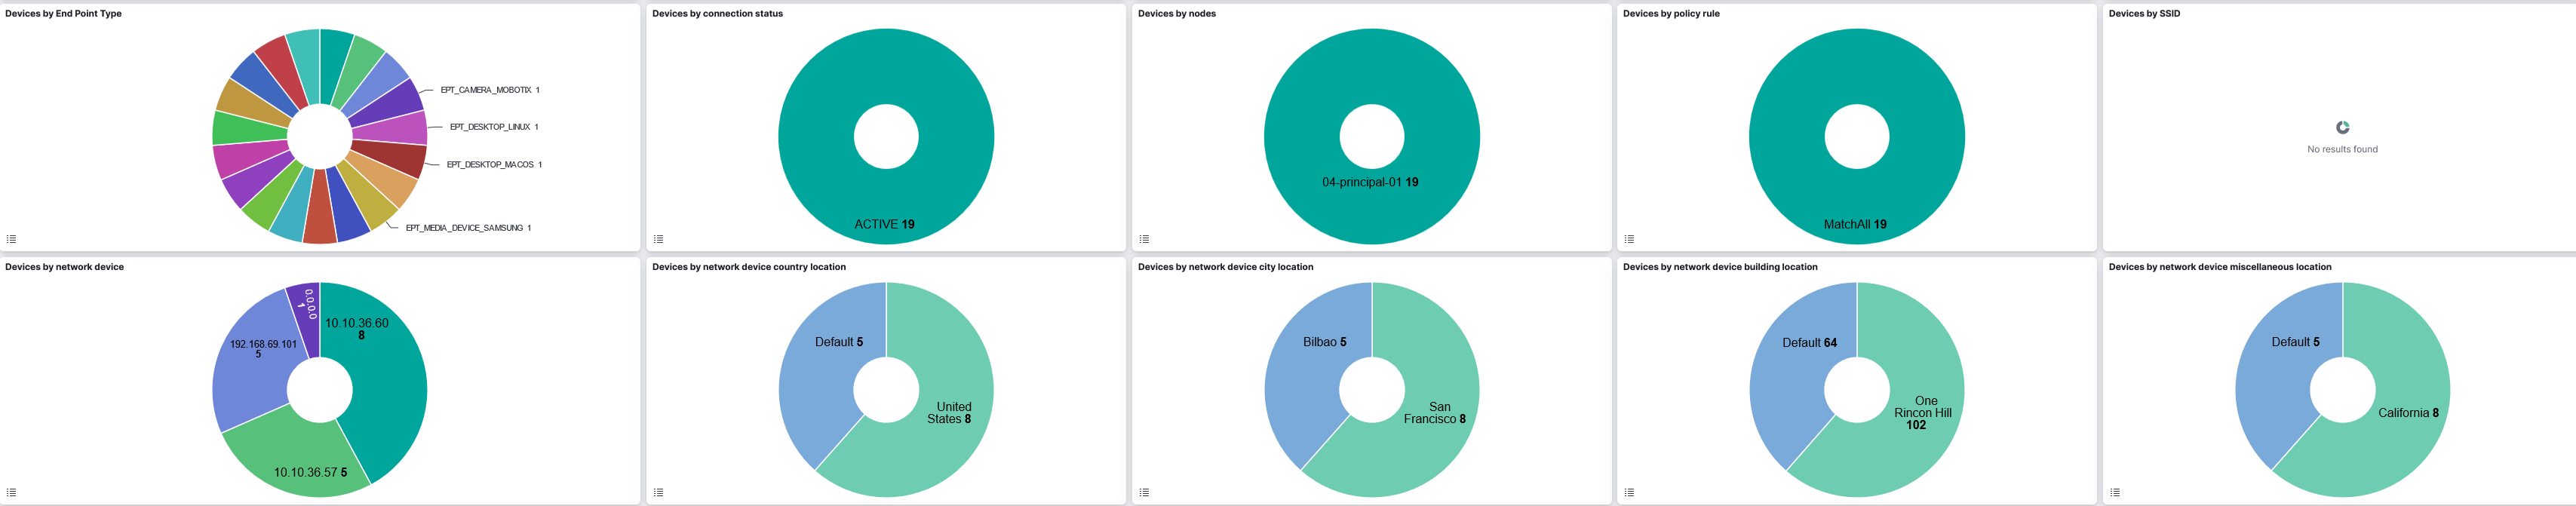
Device by End Point type: A pie chart that displays devices by their Endpoint type (EPT tag).
Devices by connection status: A pie chart that displays the devices status distribution.
Devices by nodes: A pie chart that displays devices by nodes hostname.
Devices by policy rules: A pie chart that displays devices by policy rules.
Devices by SSID: A pie chart that displays devices by different Wi-Fi network identifiers in the environment.
Devices by network device: A pie chart that displays devices by network device.
Devices by network device country location: A pie chart that displays connections by network device country location.
Devices by network device city location: A pie chart that displays devices by network device city location.
Devices by network device building location: A pie chart that displays devices by network device building location.
Devices by network device miscellaneous network: A pie chart that displays devices by network device miscellaneous network (LMI tag).
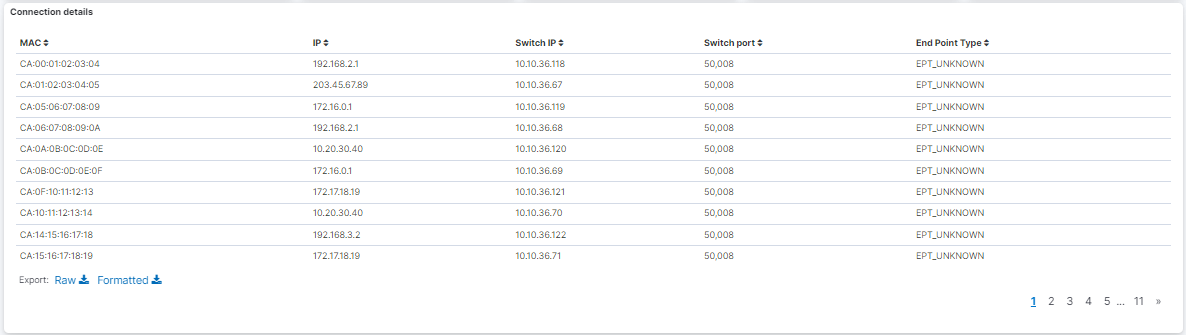
Connection Detail: This table displays MAC Addresses, IP Addresses, Hostnames, User names, Switch IPs, Switch ports, Policy names, Methods, Endpoint types, Status messages, and MAC.