4.4.1.6. Monitoring
With all the information related to the Endpoint Compliance network module that the system collects, it generates dashboards so that this information can be read and interpreted quickly and easily by the user. As a large volume of data of different types and sources is generated, different dashboards have been defined that group this information through graphs and tables.
All Dashboards have filters that allow us to define what parameters to show and what time period of the data will be used to generate said dashboards. Keep in mind that, if in the indicated period of time there has been no update on a specific device, through an event, this device will not appear.
4.4.1.6.1. UDC Overview
The UDC Overview dashboard displays all the user devices connected to the network, along with their compliance status and Agent features. We can see the following view on this dashboard:
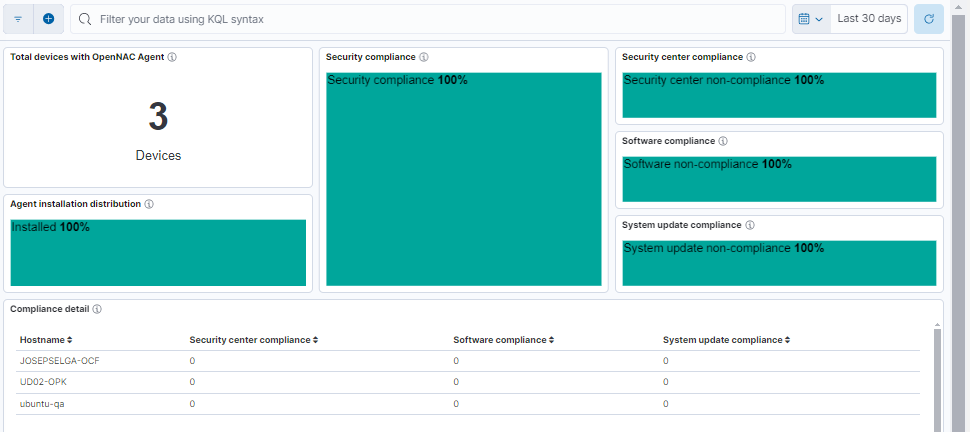
Total devices with OpenNAC Agent: Metric showing the total number of unique devices with the OpenNAC Agent installed.
Agent installation distribution: Treemap displaying the distribution of Agent installations across desktops.
Security compliance: Treemap indicating the security compliance of desktops with the Agent installed. Compliance means the desktop has a high level of security.
Security center compliance: Treemap showing the security center compliance of desktops with the Agent installed.
Software compliance: Treemap illustrating the software compliance of desktops with the Agent installed.
System update compliance: Treemap showing the system update compliance of desktops with the Agent installed.
Compliance detail: Table showing the relationship between hostname and compliance on desktops with Agent installed.
Note
This view relies on the following UD Tag Policies to display all values in the dashboards:
EPC_SECURITY_CENTER_COMPLIANCE
EPC_SECURITY_COMPLIANCE
EPC_SOFTWARE_COMPLIANCE
EPC_UPDATE_COMPLIANCE
Refer to the UD Tag policies section for more information about the default tag policies.
4.4.1.6.2. UDC Agent Metrics
The UDC Agent Metrics dashboard displays various metrics and statistics related to Agent events:
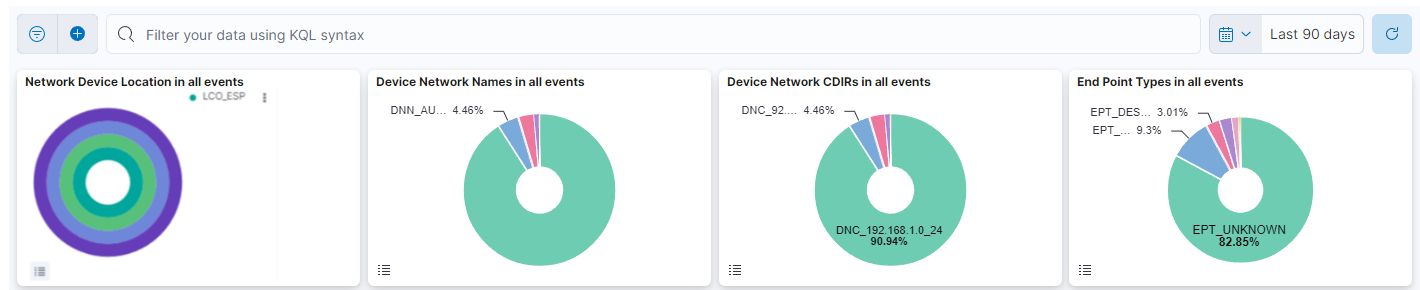
This header composed of four dashboards allows filtering by Network Device Location, Device Network Name, Device Network CDIRs, Endpoint Types. It will always look for the temporary index that is regenerated every day. In this toolbar, filter your data using KQL syntax.
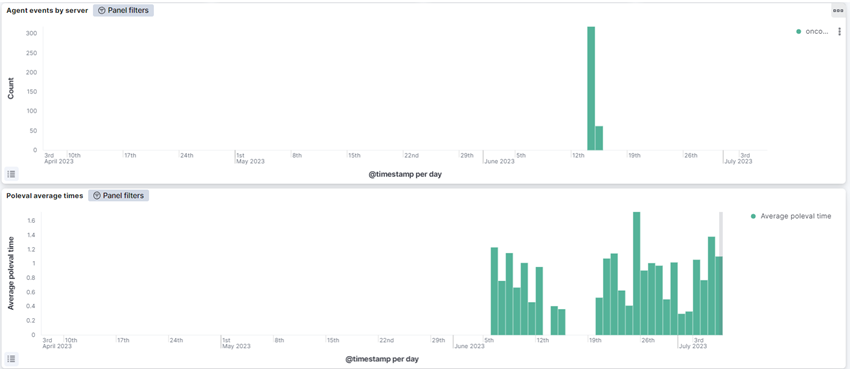
Agent events by server: Metric that represents the agent events by server.
Poleval average times: Metric that represents the average time taken for poleval (policy evaluation) in a specific timestamp.
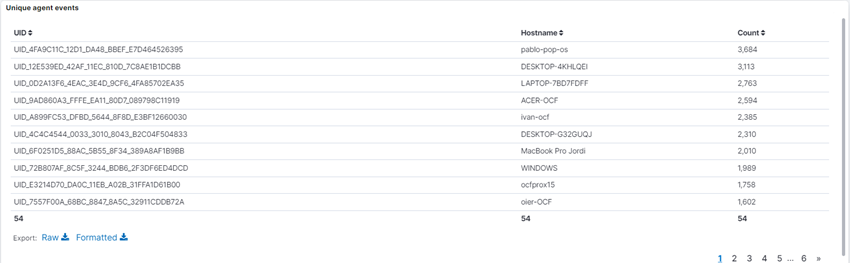
Unique agent events: Table that features the UID (Device Unique Identifier) tags, hostname and count of unique agent events.
4.4.1.6.3. EPT Changes
The EPT Changes dashboard displays information and records related to changes in Endpoint types:
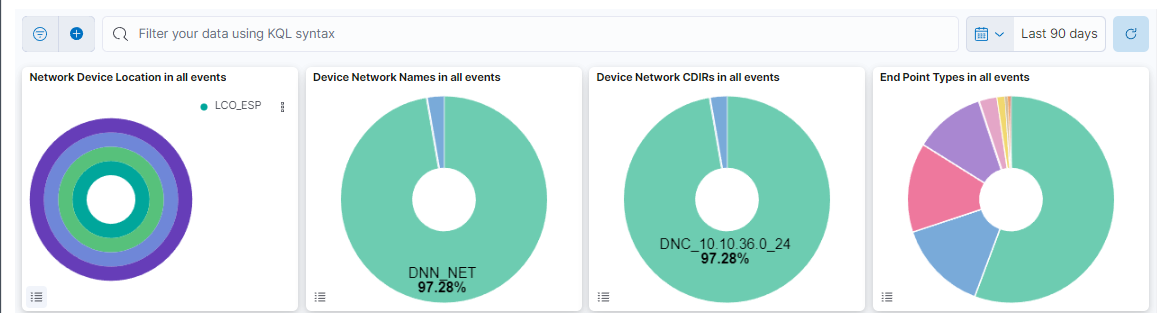
This header composed of four dashboards allows filtering by Network Device Location, Device Network Name, Device Network CDIRs, Endpoint Types. It will always look for the temporary index that is regenerated every day. In this toolbar, filter your data using KQL syntax.
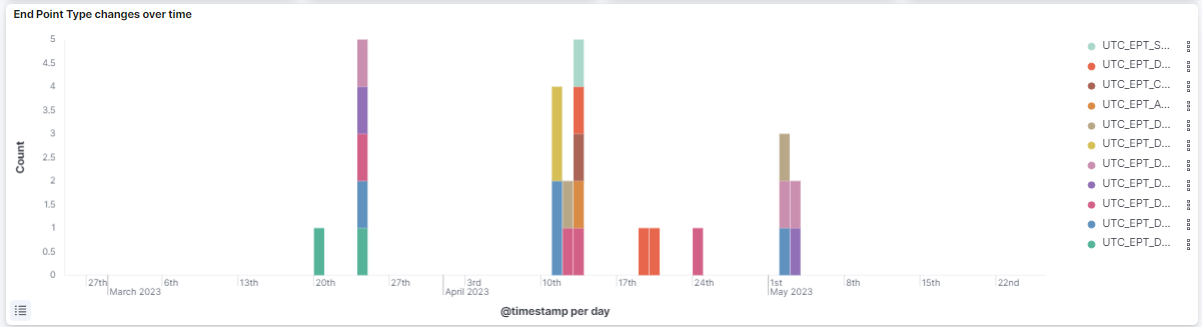
EndPoint Type changes over time: Displays a graphic with the changes over time and the tags associated to the EPT.
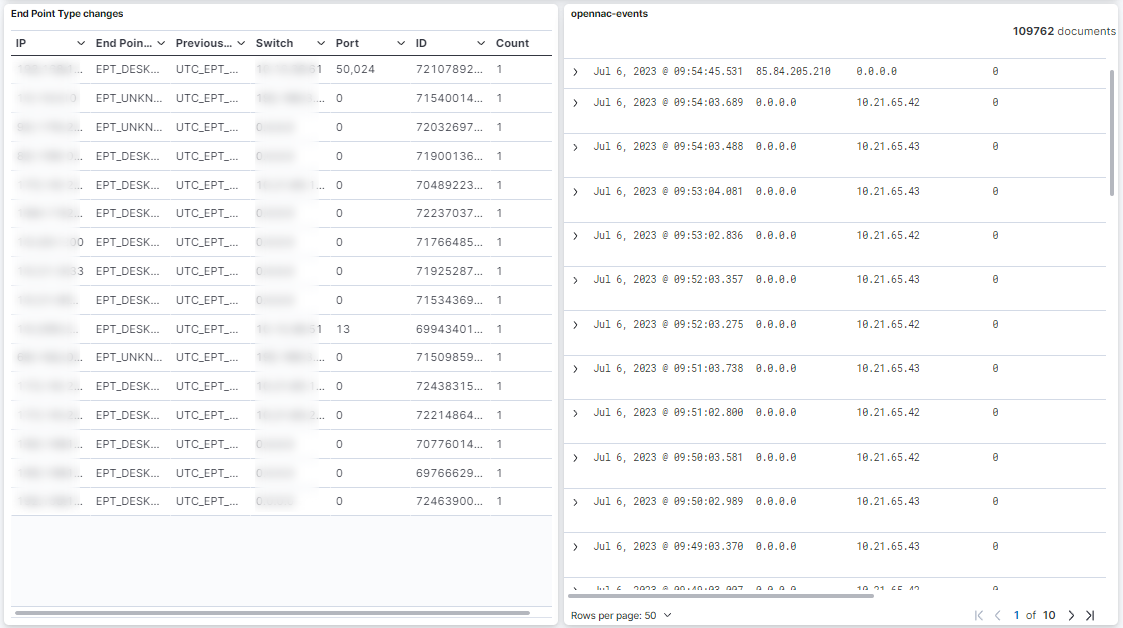
EndPoint Type changes: Table that displays APT changes details, including the previous EPT tags (UTC) and the count of those events.
oppenac events: Displays events related to the EPT change.
You can also navigate to Administration Portal > Analytics > UDC to find information about the dashboards available for this use case.