3.1.12.4.1. Internet Connections
The Internet Connection dashboard display various metrics and insights related to the compliance with corporate internet access policies.
The view displays the following dashboards:
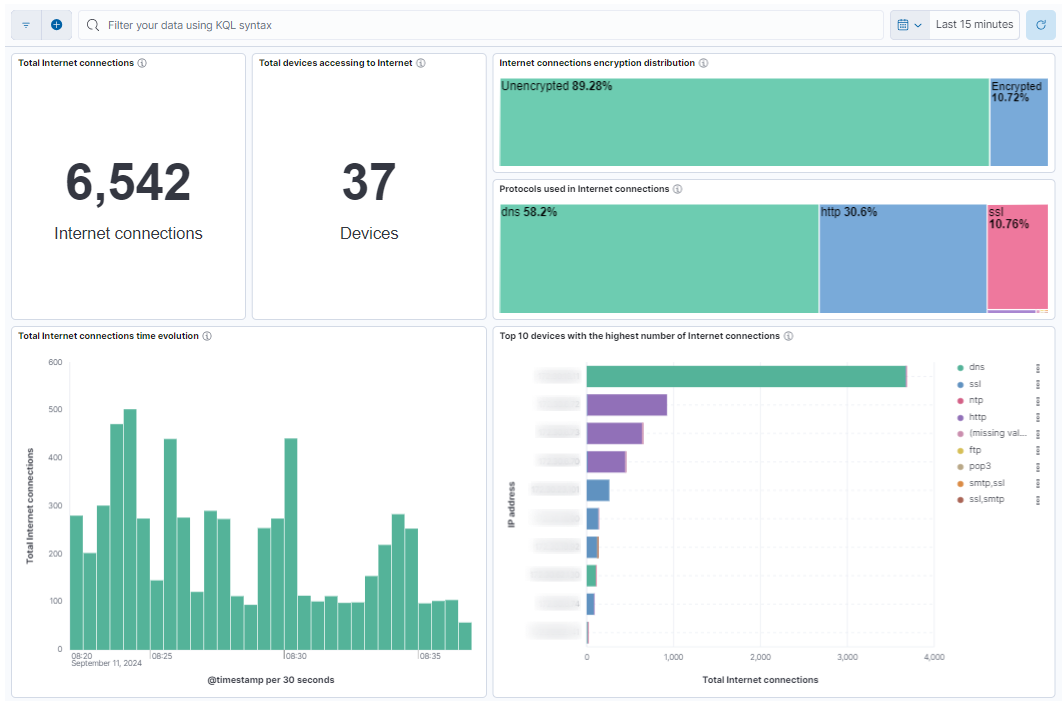
Total Internet connections: Metric showing the total number of connections to the internet.
Total devices accessing to Internet: Metric showing the total unique devices connecting to the Internet.
Internet connections encryption distribution: Tree map showing the encryption status of the connections to the Internet.
Protocols used in Internet connections: Tree map showing the distribution of protocols used in the internet connections.
Total Internet connections time evolution: Histogram showing the time evolution of the Internet connections.
Top 10 devices with the highest number of Internet connections: Bar chart showing the top 10 devices by the total number of connections to the Internet. Each bar indicates the Internet connections for a specific client IP address and is segmented by the protocol used: DNS, SSL, HTTP, etc. If the connection does not have a specific protocol, it will show “missing value”.
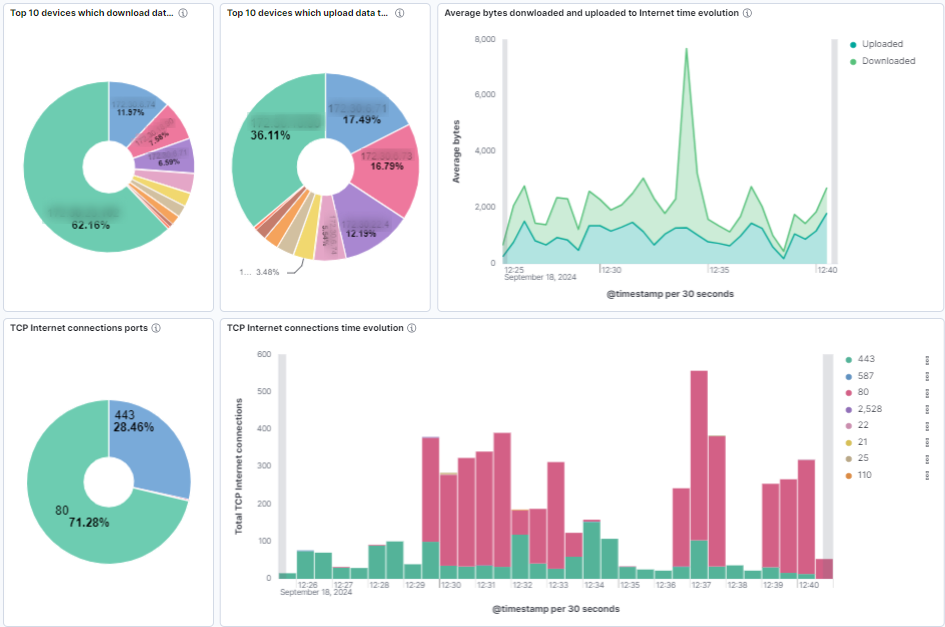
Top 10 devices which download data from Internet: Pie chart showing the top 10 devices with the highest downloaded bytes from internet.
Top 10 devices which upload data to Internet: Pie chart showing the top 10 devices with the highest downloaded bytes from internet.
Average bytes downloaded and uploaded to Internet time evolution: Histogram showing the time evolution of the average bytes downloaded and uploaded in Internet connections.
TCP Internet connections ports: Pie chart showing the distribution of destination TCP ports in Internet connections.
TCP Internet connections time evolution: Histogram showing the time evolution of TCP Internet connections. The bar stacks are segmented by the destination TCP port.
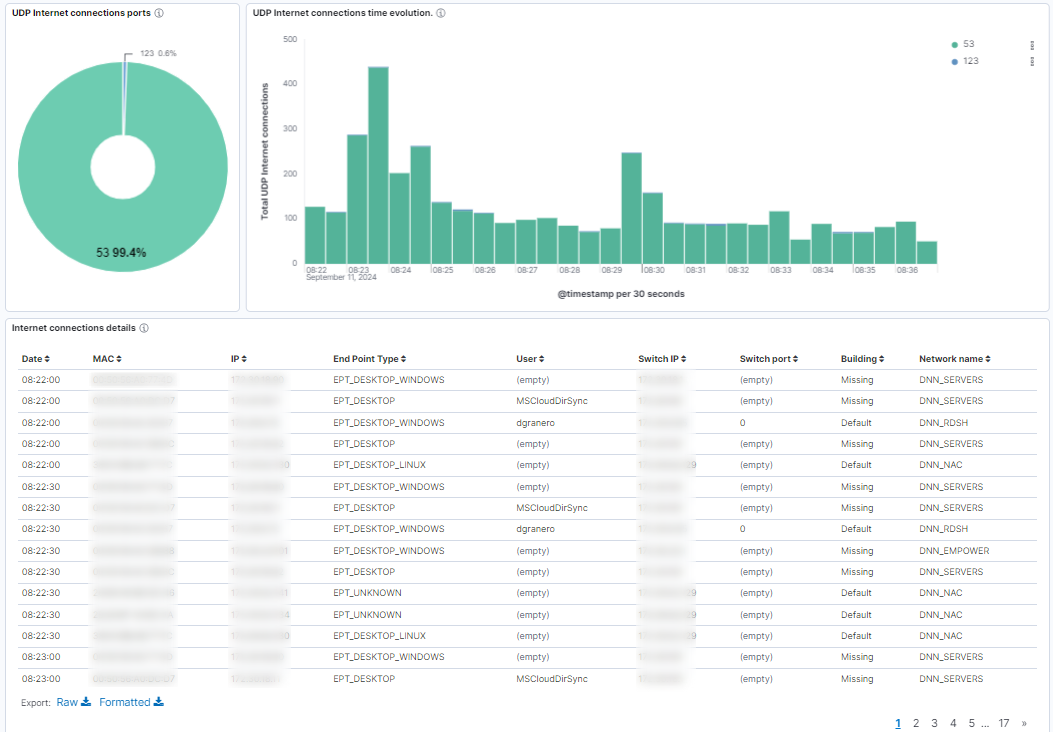
UDP Internet connections ports: Pie chart showing the distribution of destination UDP ports in Internet connections.
UDP Internet connections time evolution: Histogram showing the time evolution of UDP Internet connections. The bar stacks are segmented by the destination UDP port.
Internet connections details: Table showing the following information about Internet connections: dates, device info (MAC, IP, type), user, switch details (IP,port), and building and network names.