4.4.2.7. Troubleshooting
In order to troubleshoot the Network Device Compliance Use Case, we have considered the following sections. Carefully review the topics to see if they can solve your problem.
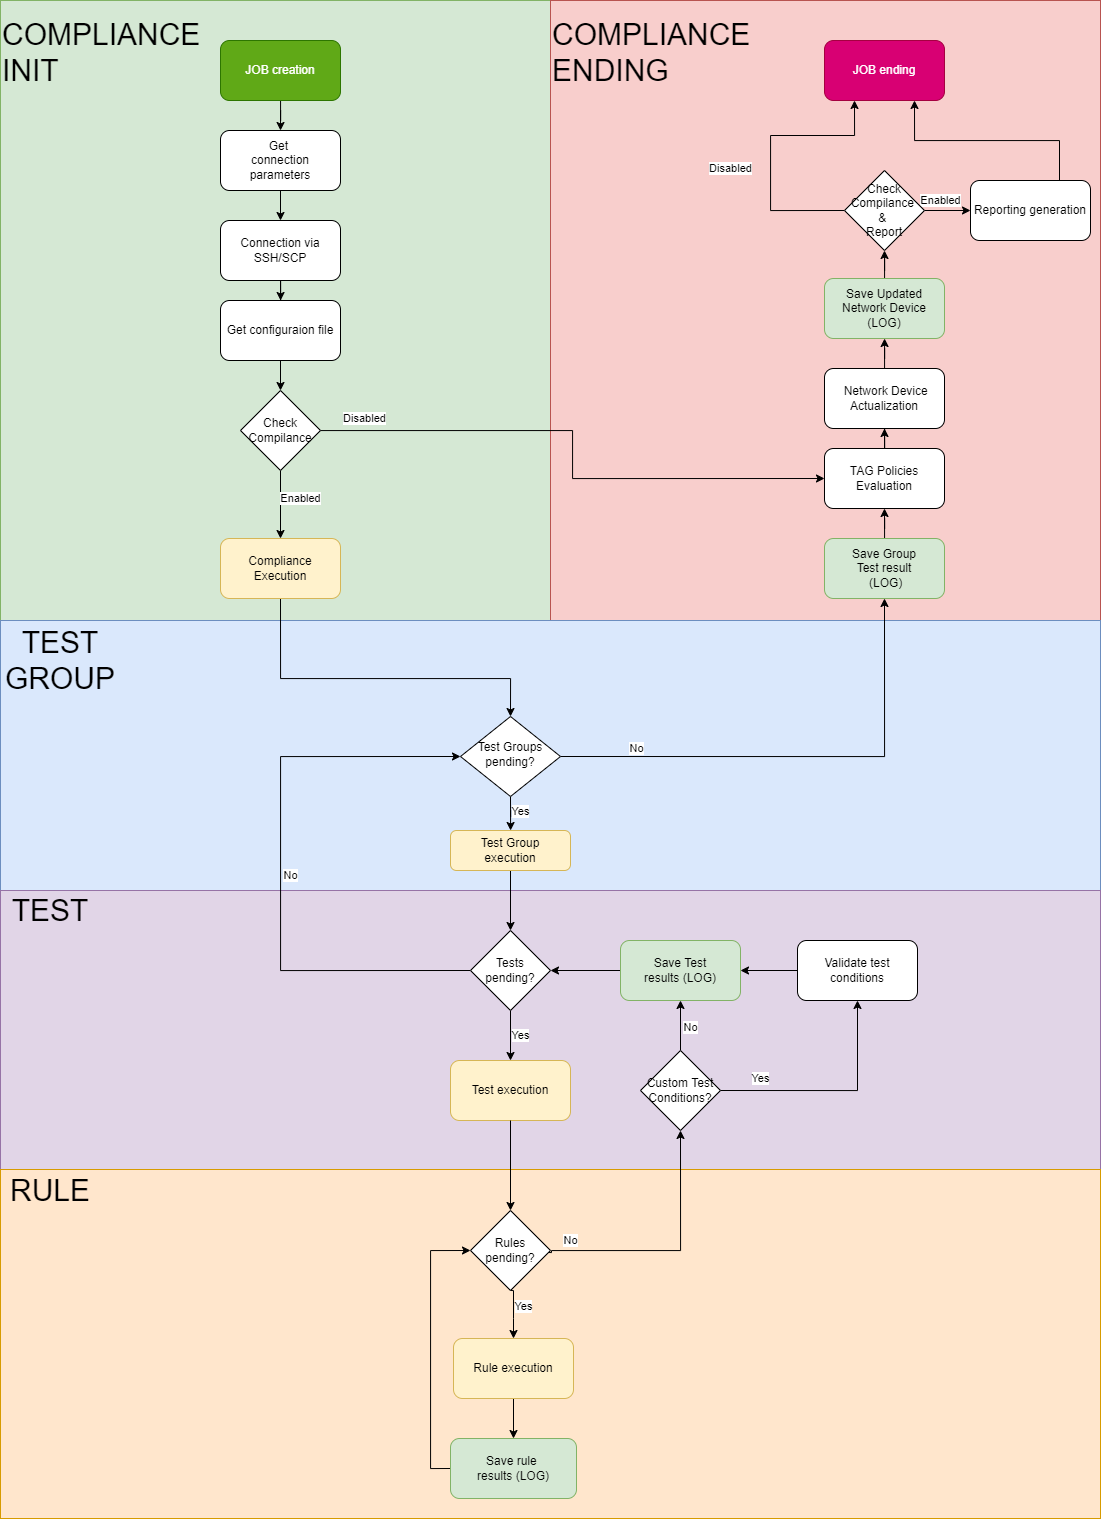
4.4.2.7.1. NDC flow diagrams
This section will show a detailed diagram of the execution flow of a Network Device Compliance test. This diagram corresponds to a single job, that is, the test for a single device from the complete list of devices of a scheduler.
The execution flow can help us to troubleshoot this use case.
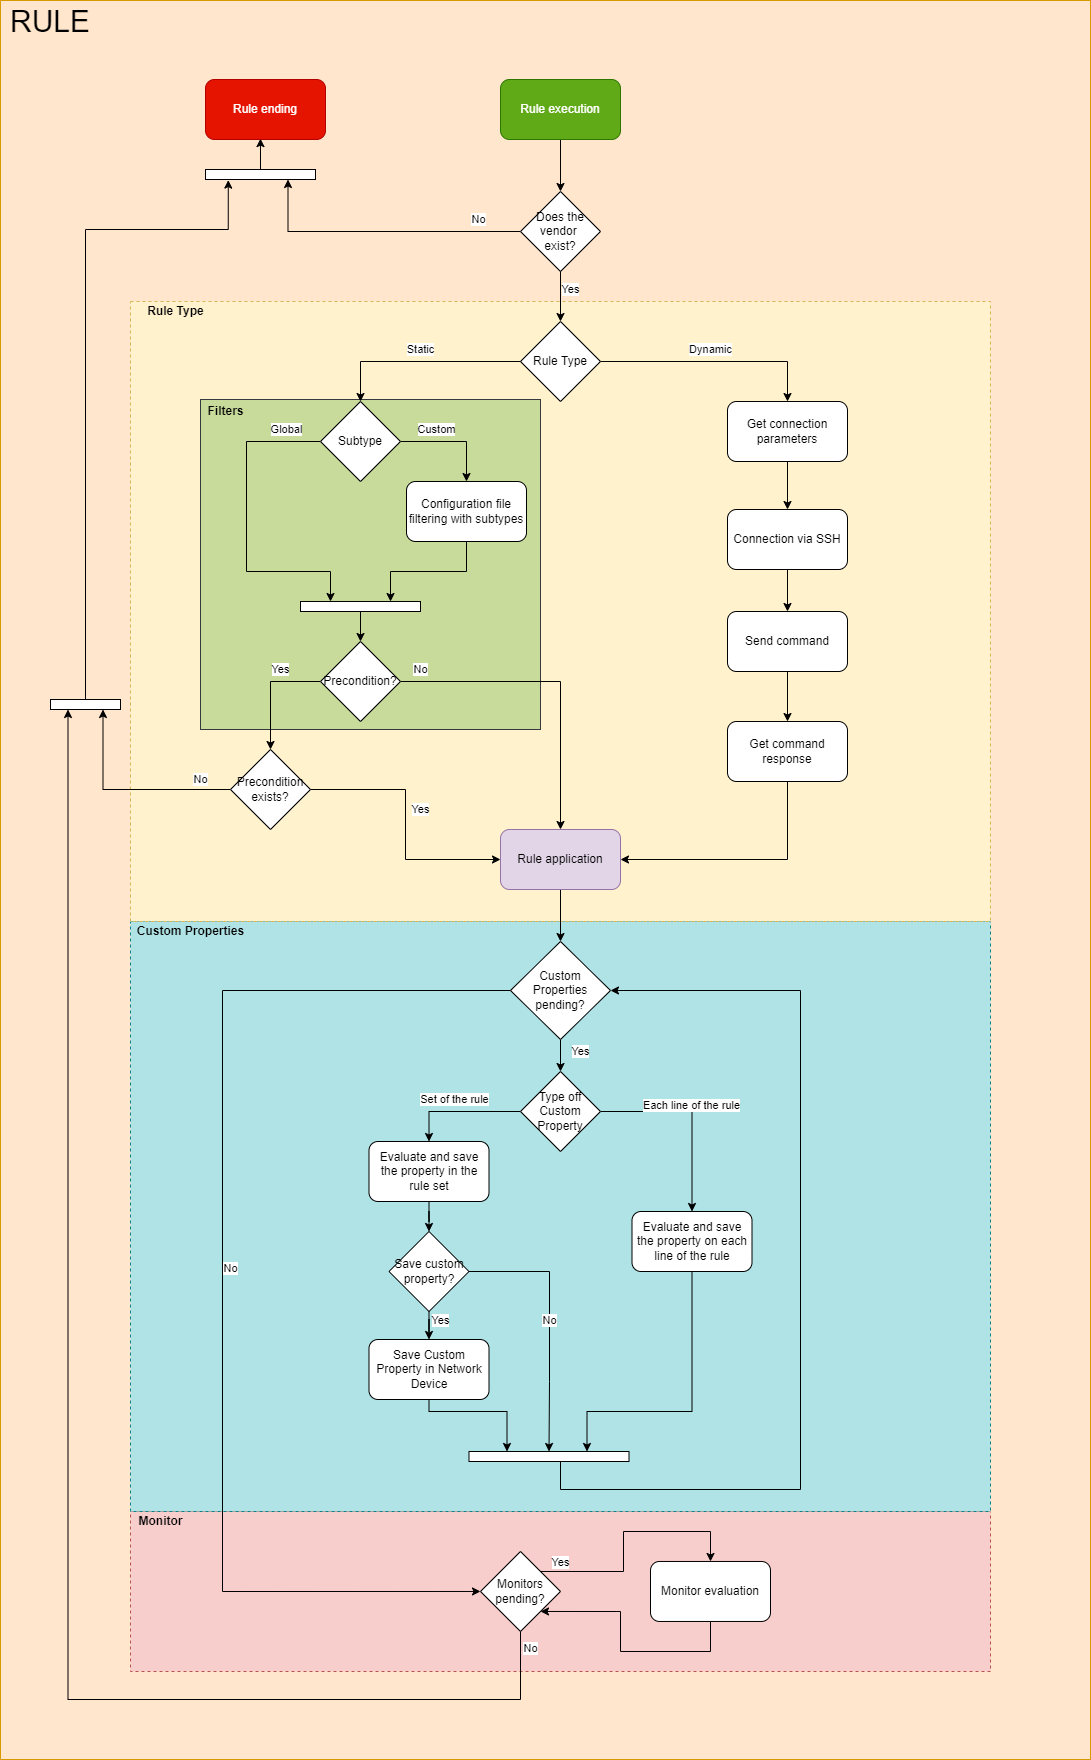
The rule execution flow happens as follows:
4.4.2.7.2. Logs and Analytics
The model for the management of logs and analytics generated in the Network Device Compliance is the ELK (Elasticsearch, Logstash, and Kibana). Working with these tools together we will have an information pipeline that collects data and transforms it (Logstash), a database where this information will be stored (Elasticsearch) and a front end to display said data in a graphic format (Kibana).
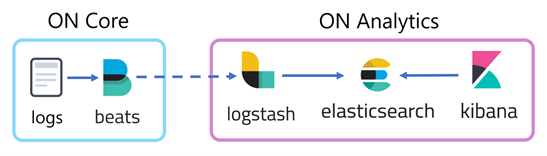
During the execution of the test, logs are generated from the information that is collected, such as events, errors, test results, or tags for network devices. As information is added to the log files, it is sent through filebeat to the analytics server. Logstash receives the information that arrives from the core and shapes it depending on the type of log that has been previously defined. All of this information is indexed and stored in elasticsearch in JSON format for querying.
The log file that is generated in an NDC execution is the following:
opennac-netdev-compliance.log
This log is in JSON format and contains the information related to each of the tests that have been carried out on the devices and is the one that is transmitted to the analytics through beats.
Path:
/var/log/opennac/opennac-netdev-compliance.log
Example of an NDC log:
2020-09-15T09:58:43.195888+02:00 on-dc-dev opennac-netdev-compliance[7329]:
{"deviceId":"6852218816923963698","deviceIp":"10.10.36.49","deviceIpManagement":"0.0.0.0",
"deviceBrand":"Cisco","deviceModel":"Generic","deviceHostname":"CiscoDemoCenter",
"deviceLocation":"","deviceVersion":"15.0(2)SE5","deviceMacaddress":"38:1C:1A:AA:F9:80",
"deviceSerialNumber":"FCW1828A5M2","devicePurchaseDate":"2020-09-25T00:00:00+02:00",
"devicePurchaseOrder":"","deviceWarranty":"2020-09-16T00:00:00+02:00",
"deviceMaintenance":"2020-09-18T00:00:00+02:00","deviceEol":"2020-09-21T00:00:00+02:00",
"deviceTags":"CGF_IOS_LAN_PORTS, CGF_IOS_SWITCH_IMPORTANCE_2, CGF_IOS_SWITCH_IMPORTANCE_3,
CGF_IOS_SWITCH_IMPORTANCE_4, CGF_IOS_SWITCH_IMPORTANCE_5, CGP_SWITCH_INFO,
CRF_IOS_AAA_SESSION_ID_UNIQUE, CRF_IOS_ACCESS_CLASS_LINE_VTY, CRF_IOS_BANNER_MOTD,
CRF_IOS_BOOT_SYSTEM, CRF_IOS_CDP_DISABLED, CRF_IOS_CHECK_VERSION,
CRF_IOS_CLOCK_SUMMER_TIME, CRF_IOS_DOMAIN_LOOKUP_DISABLED, CRF_IOS_EXEC_TIMEOUT_LINE,
CRF_IOS_GRATUITOUS_ARP_DISABLED, CRF_IOS_IP_BOOTP_SERVER_DISABLED, CRF_IOS_IP_CEF,
CRF_IOS_IP_HTTP_SERVER_DISABLED, ","complianceTestGroupId":"6790331328198873089",
"complianceTestGroup":"IOS_SWITCH_IMPORTANCE_5","complianceTestId":"6789876735128113163",
"complianceTest":"IOS_LINE_CONFIGURATION","complianceRule":["IOS_EXEC_TIMEOUT_LINE",
"IOS_LOGIN_AUTHENTICATION_LINE","IOS_ACCESS_CLASS_LINE_VTY",
"IOS_TRANSPORT_INPUT_LINE_VTY"],"complianceTestConditionFullfiled":"all",
"complianceStatus":0,"complianceResultTag":"CTF_IOS_LINE_CONFIGURATION"}
As we can see, we find the information related to the device itself, as well as the tags that have been assigned to it and the test information.
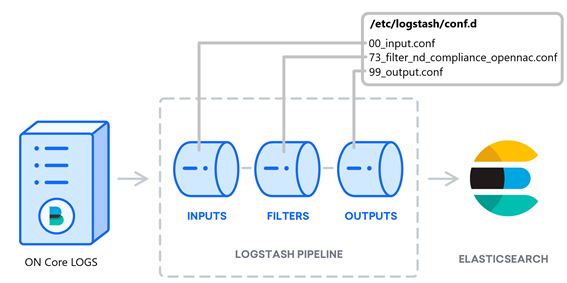
Once the log file reaches the analytics it will go through the logstash pipeline, it will be shaped using the input, filter (for a certain type of file), and output files. These files are located in the configuration folder of logstash conf.d.
Once these NDC logs have passed through Logstash and are stored in Elastic, they will have a format similar to the following. They wil present the corresponding modifications before being modified in the pipeline:
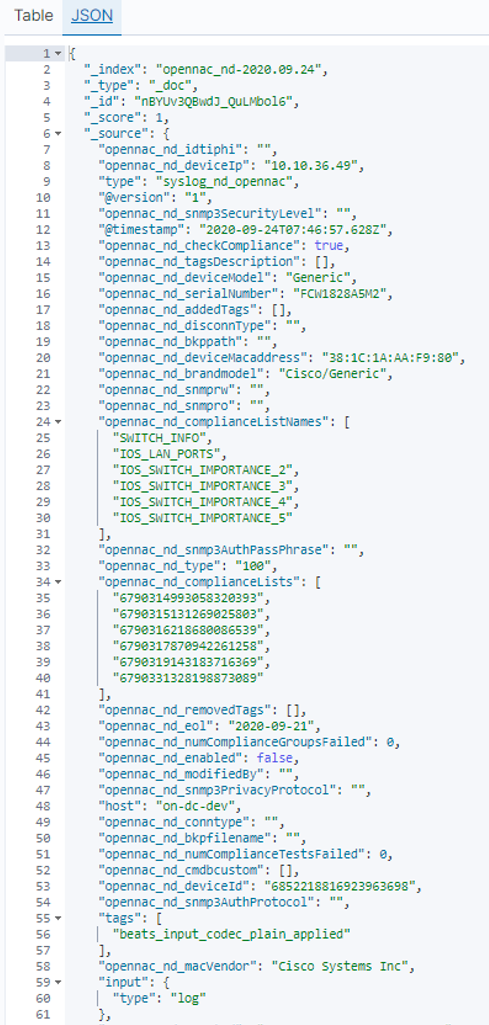
These logs can be viewed in Analytics -> Discover, selecting the NDC data in the opennac_nd-* index.
Finally, this information will be stored in elasticsearch so that, when accessing the test results dashboard Analytics -> Use Cases -> Network Device Compliance, Kibana feeds on them to generate the graphs.