4.4.2.6. Monitoring
With all the information related to the Network Device Compliance module that the system collects, it generates dashboards so that this information can be read and interpreted quickly and easily by the user. As a large volume of data of different types and sources is generated, different dashboards have been defined that group this information through graphs and tables.
All Dashboards have filters that allow us to define what parameters to show and what time period of the data will be used to generate said dashboards. Keep in mind that, if in the indicated period of time there has been no update on a specific device, through an event, this device will not appear.
4.4.2.6.1. NDC Overview
The NDC Overview dashboard displays an executive report of the network device compliance.
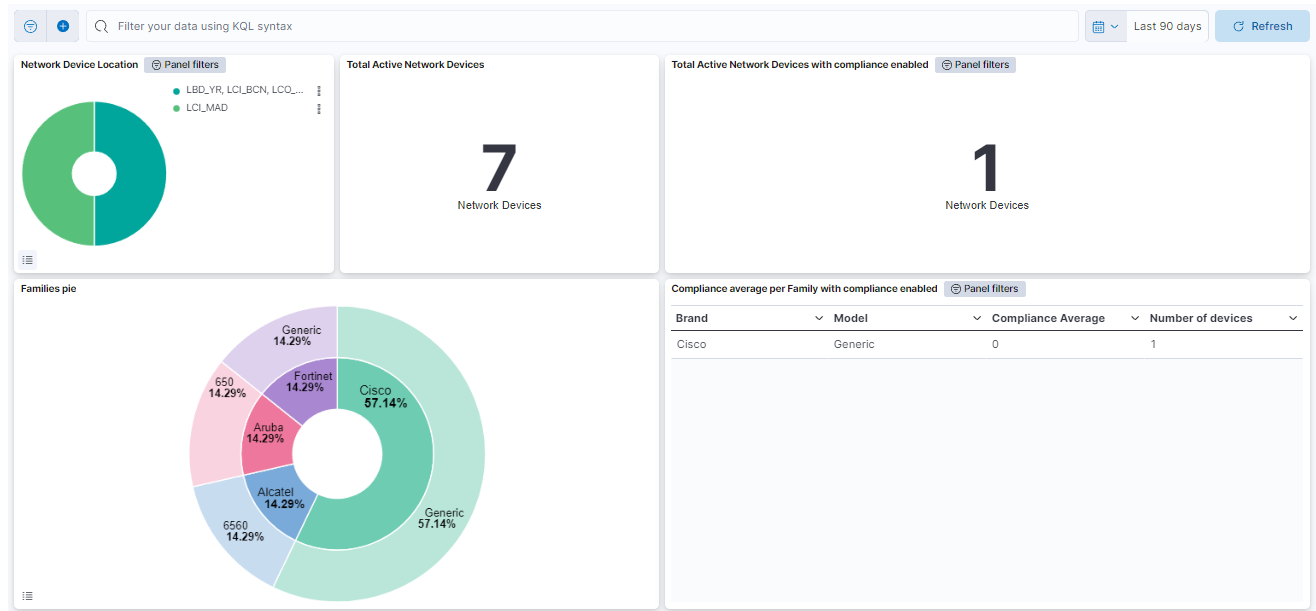
Network Device Location: Shows a pie chart with the location of the Network Devices.
Total active Network Devices: Number of the total network devices that have passed compliance.
Total Active Network Devices with compliance enabled: Number of total network devices that have passed compliance and have the check compliance feature enabled.
Families pie: The internal pie represents the percentage of network devices by brand. The external pie represents the percentage of network devices by model.
Compliance average per Family with compliance enabled: The table displays information about network device brands and models, including the brand name, model, compliance average, and the total number of devices for each brand and model.
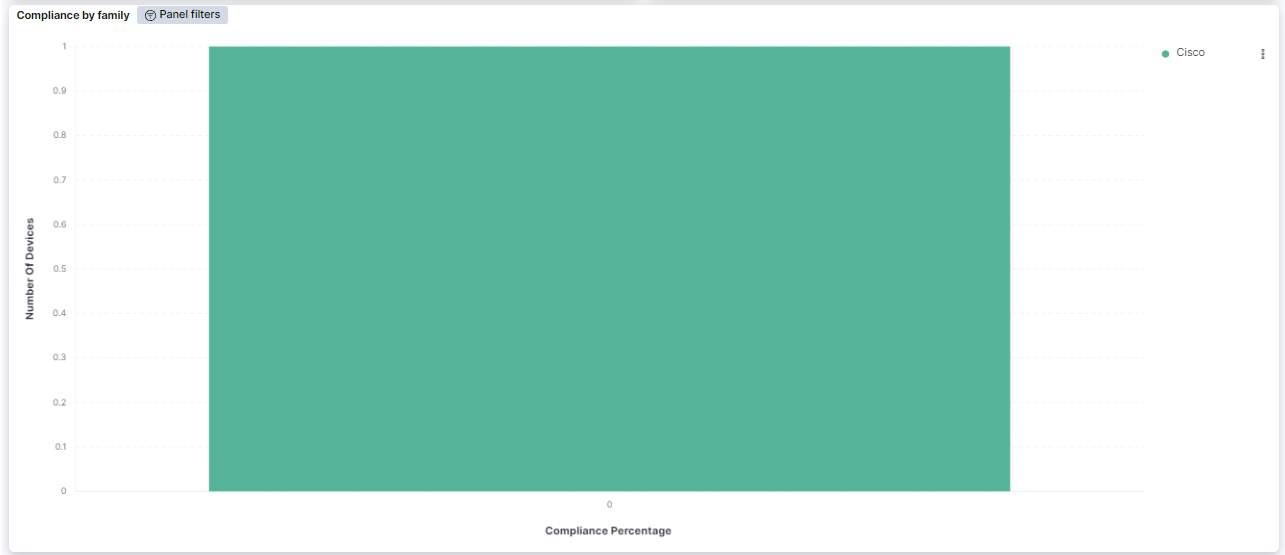
Compliance by family: Shows the number of devices with a concrete compliance percentage divided by family.
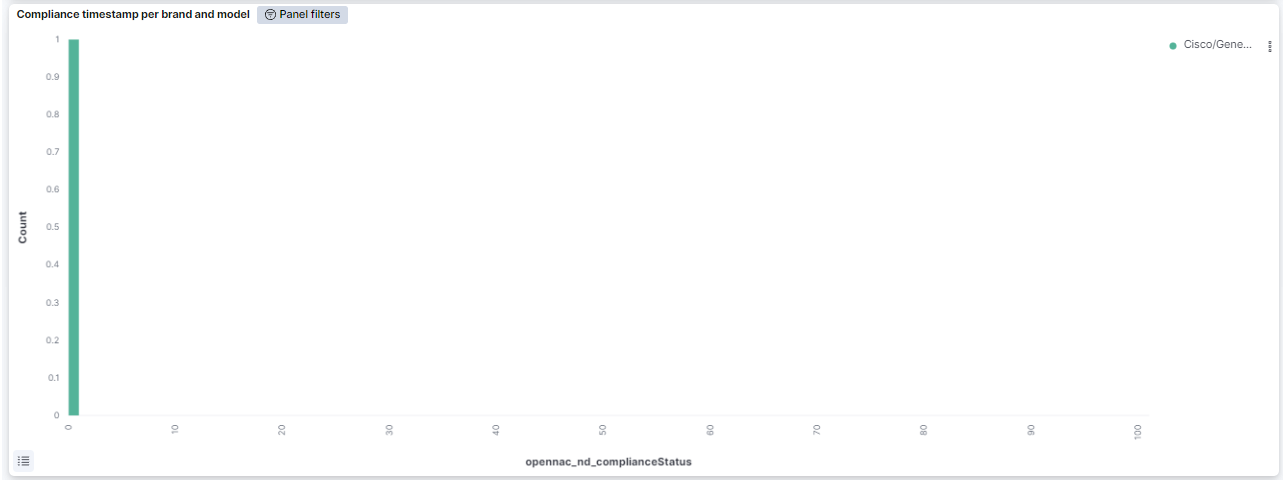
Compliance timestamp per brand and model: Shows the number of devices with a concrete compliance percentage divided by brand and model.
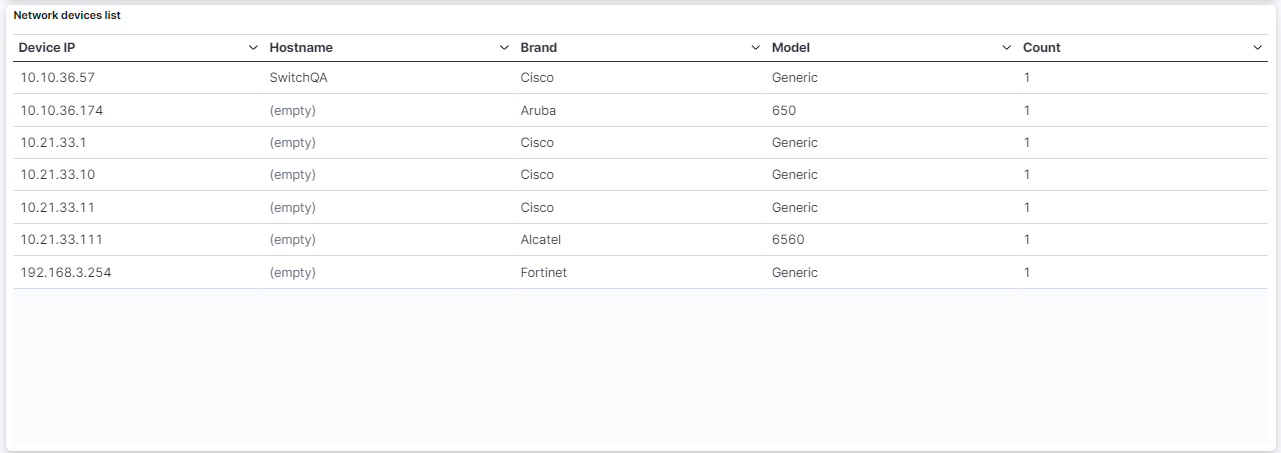
Network devices list: Shows a table with information about network devices. This table contains the network device IP, the hostname, the network device brand, and the network device model.
4.4.2.6.2. NDC Details
Following the drill-down approach of the NDC section, the NDC Details dashboard displays detailed information about Network Devices.
4.4.2.6.3. Header
The three available views in the NDC Details section show different information about network devices. However, they have a common header, which refers to a consistent section at the top of each view that contains shared information about Network Device Location.
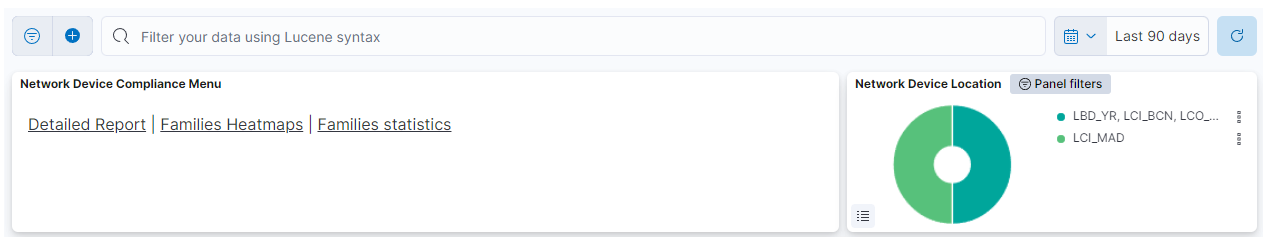
Network Device Compliance Menu
The menu features different windows, such as Detailed Report, Families Heatmaps, and Families statistics. Each window offers distinct dashboard views, allowing you to navigate between these sections. The following topics will explore these menu options in detail.
4.4.2.6.4. Detailed Report
This window detailed information about the compliance status of network devices.
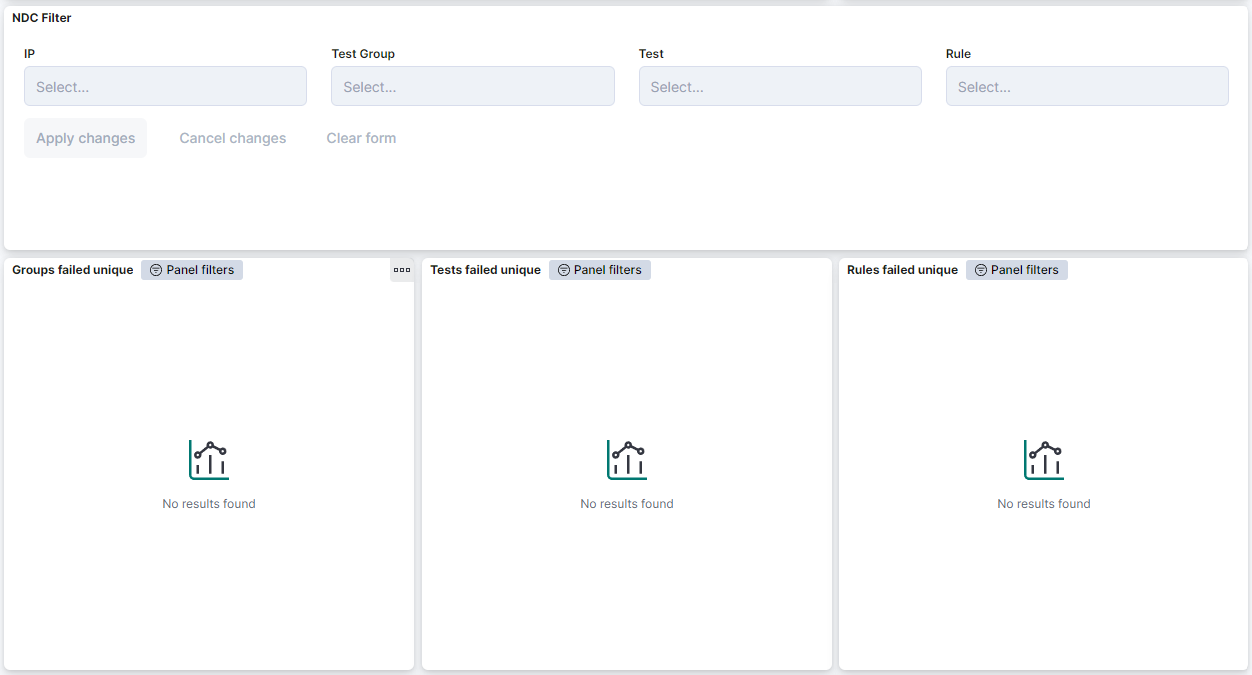
NDC Filter: Allows to filter the Network Device table and the rest of the dashboard by the network device IP, the test group, the group and the OpenNAC Enterprise policy rule.
Groups failed unique: Shows the groups failed.
Tests failed unique: Shows the tests failed.
Rules failed unique: Shows the rules failed.
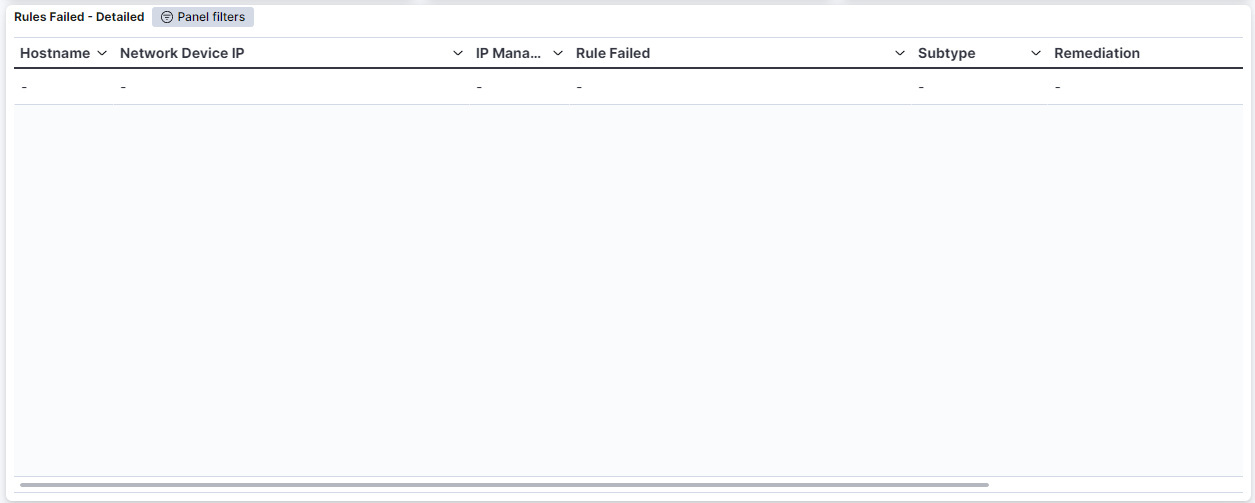
Rules Failed - Detailed: Shows a detailed table with the rules failed. This table represents the hostname, as well as the network device IP, the management IP, the failed rule, the subtype and the remediation for that rule.
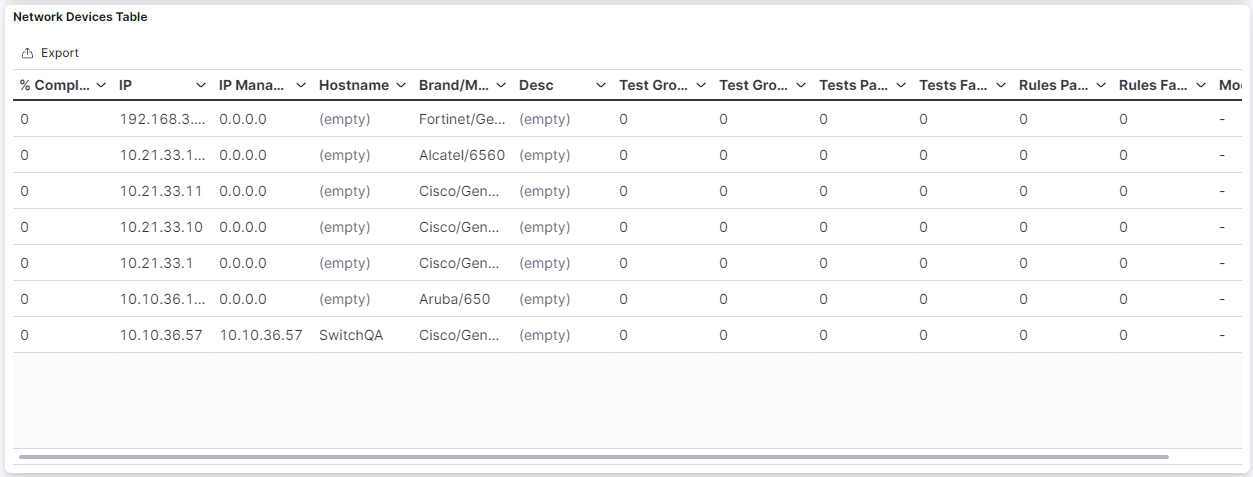
Network Devices Table: The table presents a comprehensive overview of network devices, including the percentage of compliance, IP address, management IP, hostname, brand and model, description, test groups passed, test groups failed, tests passed, tests failed, rules passed, rules failed, and the date of the most recent modification. This table provides detailed information about the compliance status and various aspects of the network devices.
Rules error details: Shows a table with the rules error details. This table represents the hostname, as well as the network device IP, the test group, the test, the rule and the error message.

Rules Monitoring: Shows a table with the rules monitoring. This table contains the hostname, the network device IP, the management IP, the rule, the ID, the monitor message and how many times this event is repeated.
4.4.2.6.5. Families Heatmaps
This window displays the families heatmap of the network device compliance.
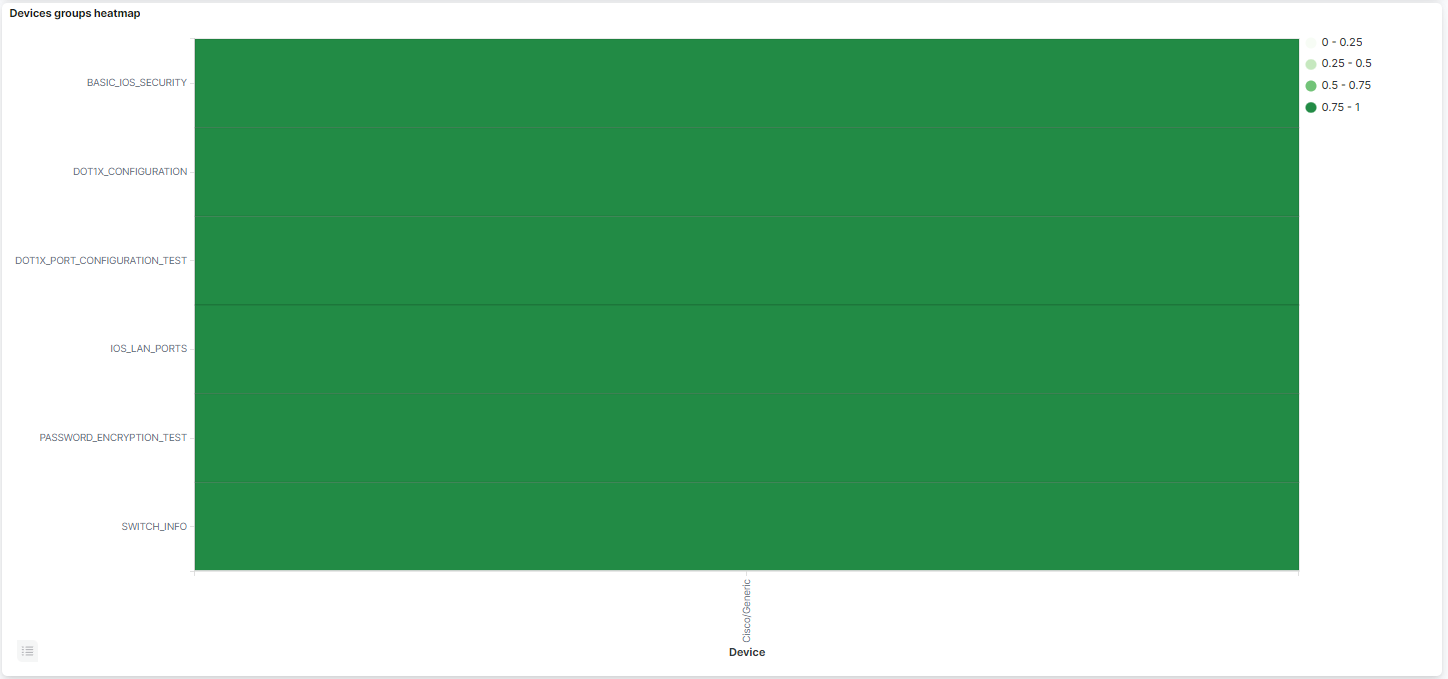
Devices groups heatmap: Shows a heatmap with the groups and the network devices brands and models that are passing these groups.
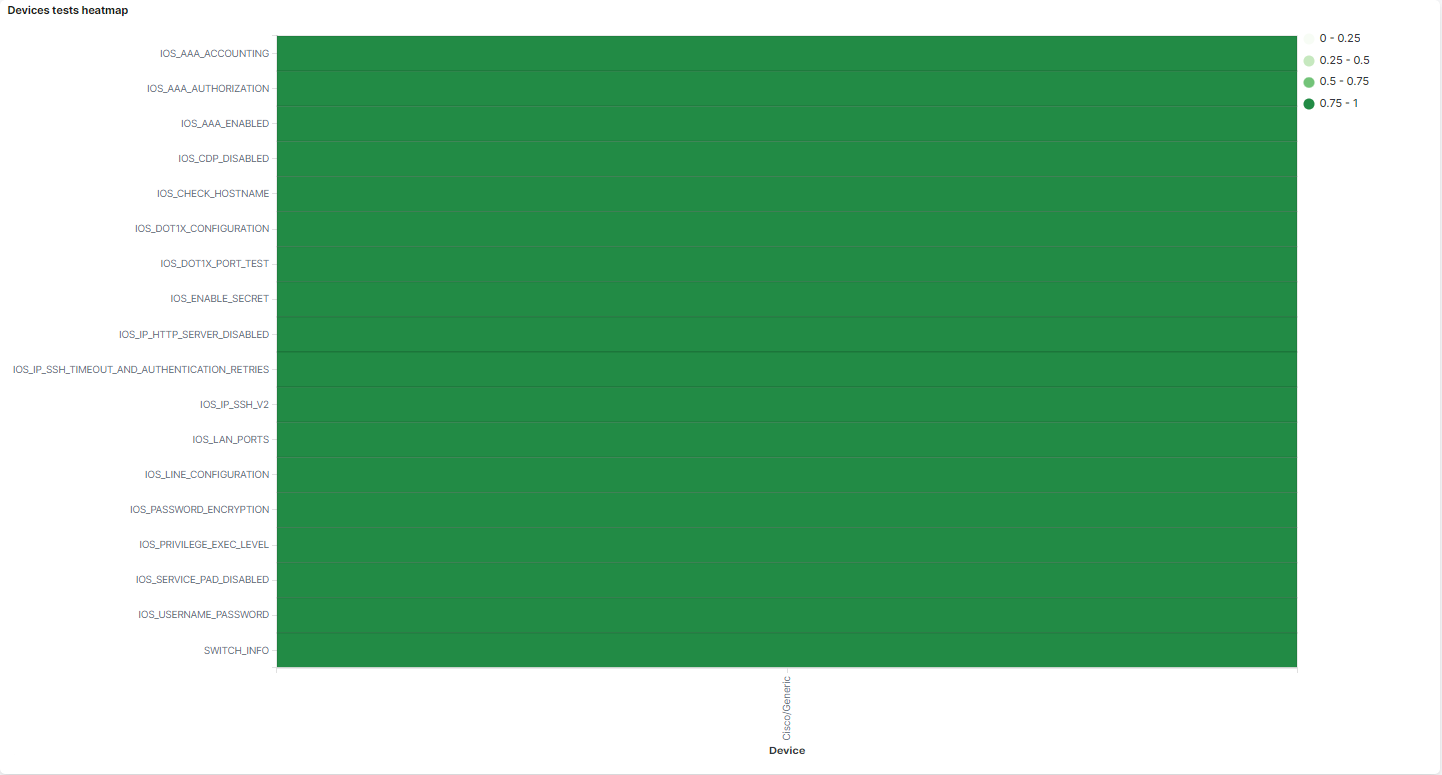
Devices tests heatmap: Shows a heatmap with the tests and the network devices brands and models that are passing these tests.

Devices rules heatmap: Shows a heatmap with the rules and the network devices brands and models that are passing these rules.
4.4.2.6.6. Families Statistics
This window displays the families statistics of the network device compliance.
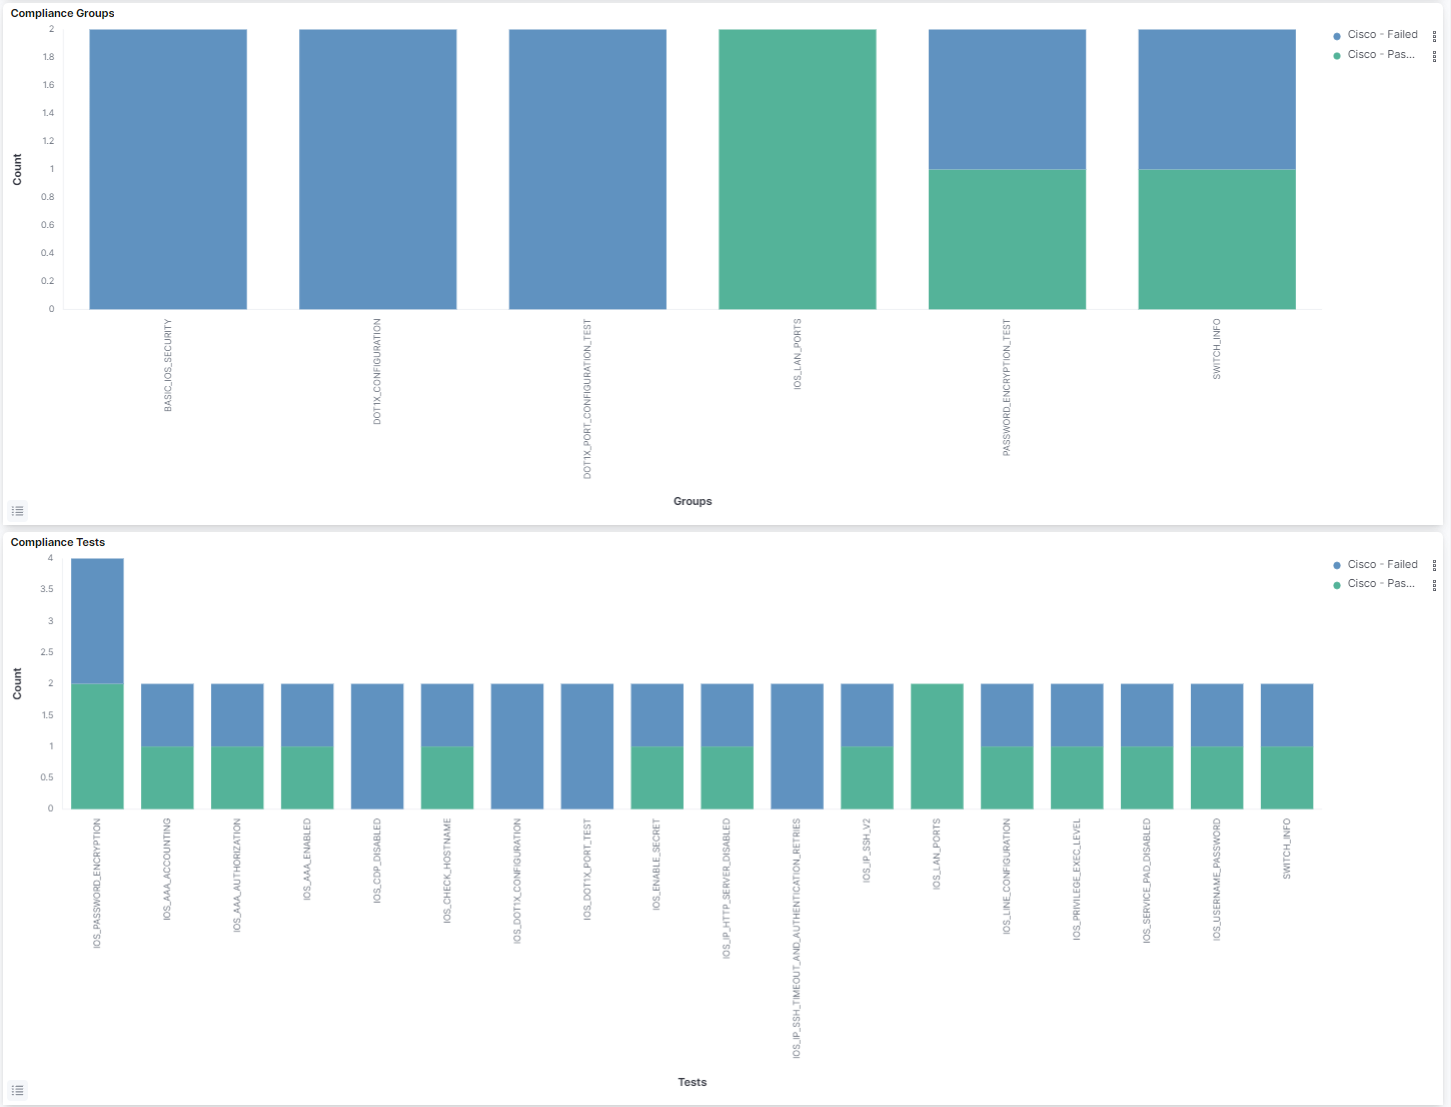
Compliance Groups: Shows the number of groups passed or failed by brand and model.
Compliance Tests: Shows the number of tests passed or failed by brand and model.
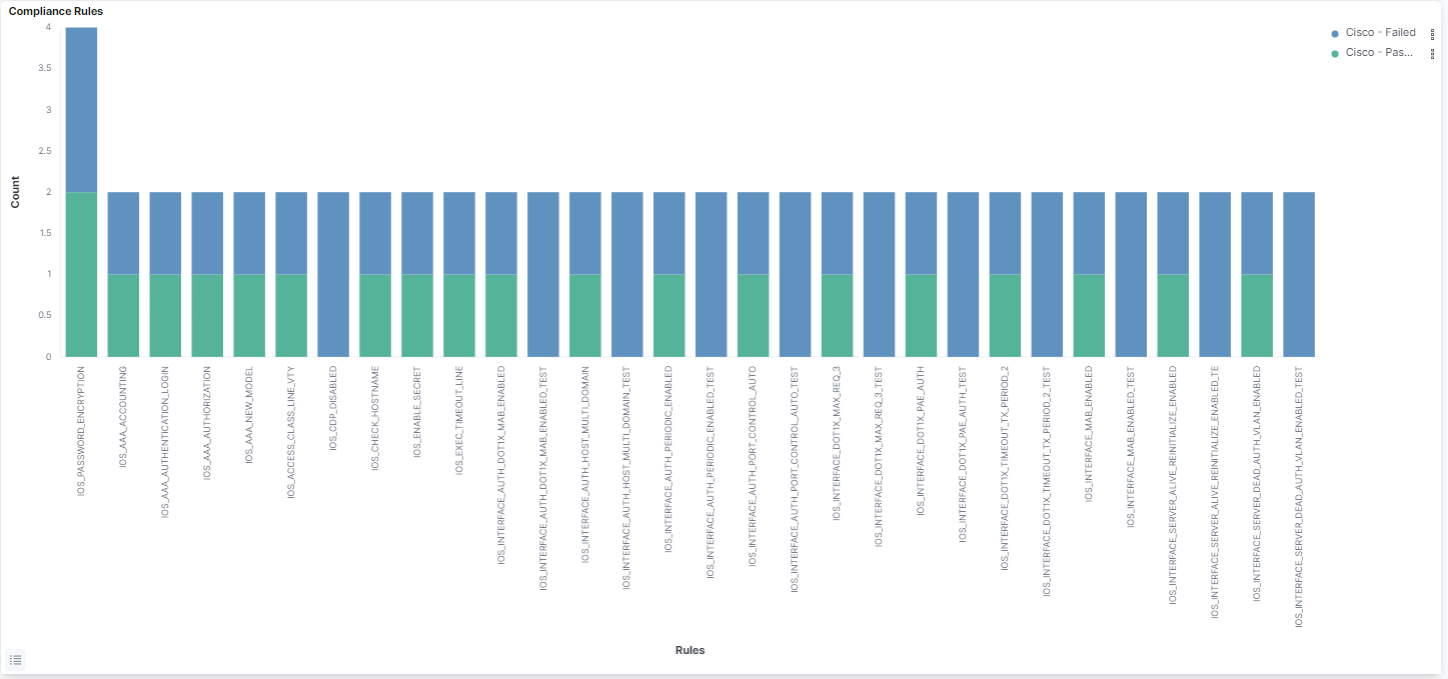
Compliance Rules: Shows the number of rules passed or failed by brand and model.
4.4.2.6.7. NDC Metrics
The NDC Metrics dashboard displays various metrics and statistics related to Network Device Compliance (UDC):
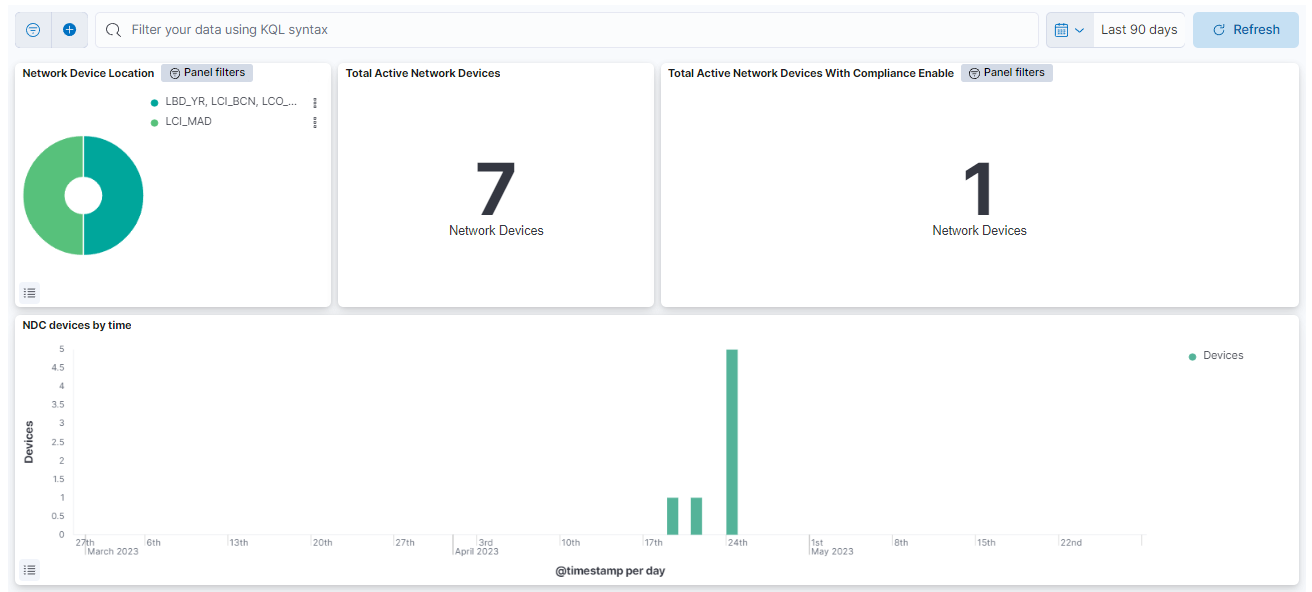
Network Device Location: Shows a pie chart with the location of the Network Devices.
Total active Network Devices: Number of the total network devices that have passed compliance.
Total Active Network Devices with compliance enabled: Number of total network devices that have passed compliance and have the check compliance feature enabled.
NDC devices by time: It provides a timeline that displays how the compliance of devices evolves over time.
You can also navigate to Administration Portal > Analytics > NDC to find information about the dashboards available for this use case.