4.4.2.3. Architecture
This section outlines the necessary nodes for the use case, offering essential information on its architecture, including components, simplified architecture, and recommended sizing.
4.4.2.3.1. Components
The deployment of the NDC module requires the installation of two components:
ON CORE: Implements an administration portal from which it manages the rule engine and its CMDB. Provides a Rest API.
ON ANALYTICS: This is a reporting tool that integrates all the solution’s logs and provides dashboards and a search engine.
4.4.2.3.1.1. ON Core
ON Core provides the centralized administration console.
It is a mandatory component of the solution that includes critical components such as:
Cron: Cron is the service that is responsible for managing the execution of processes. In the Network Device Compliance module, cron is responsible for executing the Compliance tests that have been programmed in the ON NetBackup scheduler.
SQL: SQL database to store the NDC scheduled tasks.
NetBackup: This is the module that contains the backup and compliance functionalities of the network devices. The processes it executes (backup or compliance) can be previously scheduled so that they start automatically in a defined period or date.
NetDevCompliance: This submodule integrated into NetBackup is the one in charge of carrying out the tests on all the network devices that have been defined in the scheduler. During this process all the test groups, their tests and the rules of these tests will be executed in each of the devices.
Filebeat: Filebeat will allow us to send all the logs that have been generated during the execution of the Network Device Compliance in the Core to the Analytics Logstash service so that they are processed (Logstash), stored (Elasticsearch) and displayed to the user (Kibana).
4.4.2.3.1.2. ON Analytics
ON Analytics is based on the ELK Stack. It receives the platform logs, structures, metadata and builds a datalake to display dashboards and reports in real time, allowing for specific searches.
It is a mandatory component of the solution that includes components such as:
Logstash: This tool will allow us to collect and process the data we receive from the Core through Filebeats. In Logstash, the data is filtered and shaped and then sent to Elasticsearch.
Elasticsearch: When the data has been modeled with Logstash, it reaches Elasticsearch where it is indexed and stored so that the user can execute queries and Kibana can generate the dashboards from this data.
Kibana: Kibana will generate the dashboards with different types of charts and tables from the data it extracts from Elasticsearch.
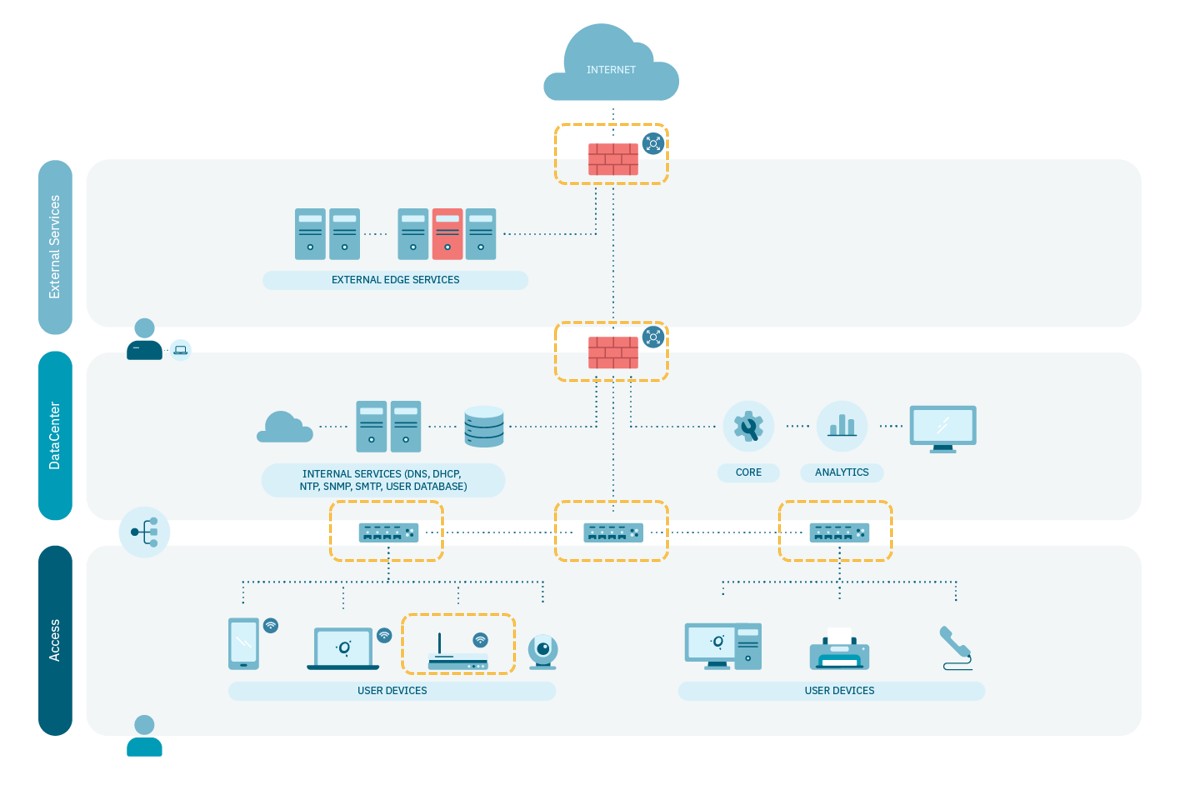
4.4.2.3.2. Standard Architecture
A reference architecture requires the components described above and depends on the network architecture available to the customer, as well as the number of users on the network.