4.7.1.8. Monitoring
With all the information related to the Guest module that the system collects, it generates dashboards so that this information can be read and interpreted quickly and easily by the user. As a large volume of data of different types and sources is generated, different dashboards have been defined that group this information through graphs and tables.
All Dashboards have filters that allow us to define what parameters to show and what time period of the data will be used to generate said dashboards. Keep in mind that, if in the indicated period of time there has been no update on a specific device, through an event, this device will not appear.
4.7.1.8.1. 2SRA Overview
The 2SRA Overview dashboard displays VPN connections and their features. We can see the following views on this dashboard, starting from the header:
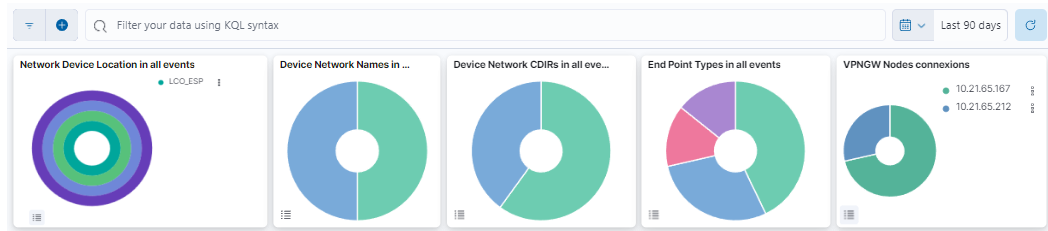
This header composed of five dashboards allows filtering by Network Device Location, Device Network Name, Device Network CDIRs, Endpoint Types, and VPNGW Nodes connections. It will always look for the temporary index that is regenerated every day. In this toolbar, filter your data using KQL syntax.
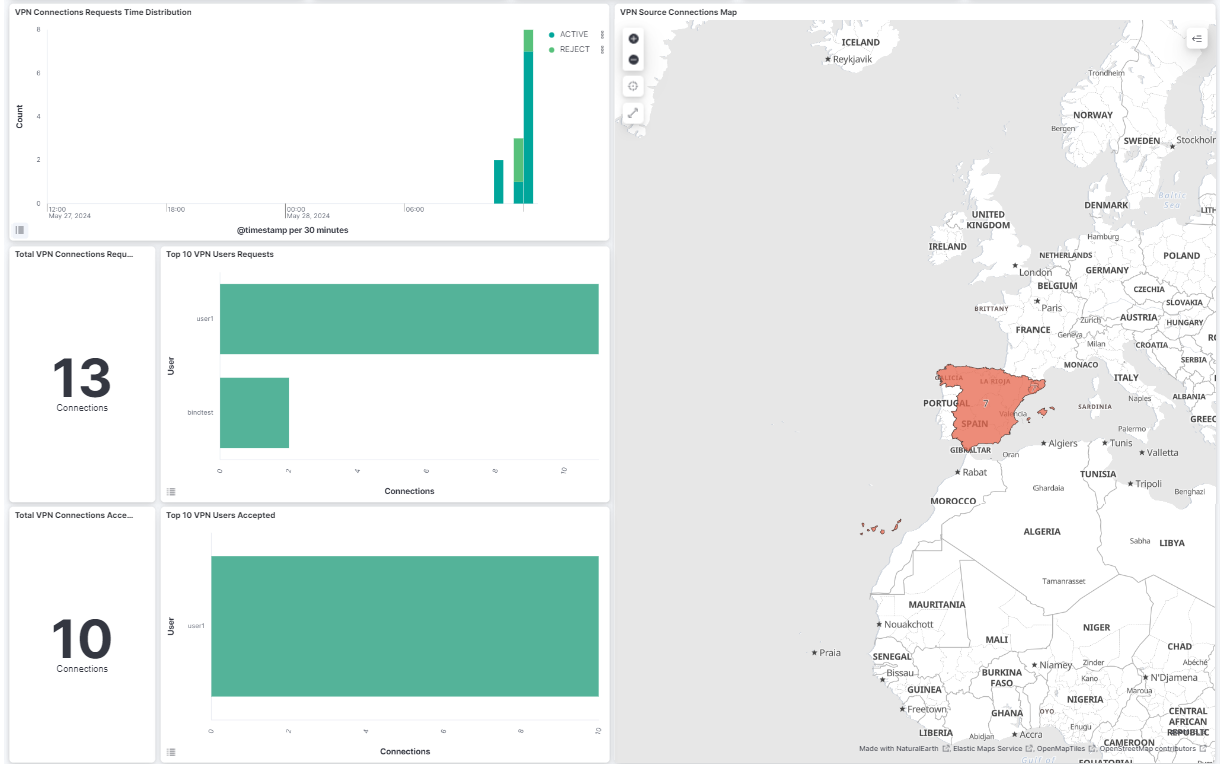
VPN Connection Requests Time Distribution: Shows the total of VPN events separated by active and rejected on a timeline.
VPN source connection map: A map displaying the locations of VPN connections.
Total VPN Connection Requests: Shows the number of total VPN connection requests.
TOP 10 VPN User Requests: Shows the top 10 users that generates the VPN requests, with the number of requests for user.
Total VPN Connections Accepted: NShows the number of total VPN connections accepted.
TOP 10 VPN Users Accepted: Shows the top 10 users that generates the VPN requests, with the number of accepted requests for user.
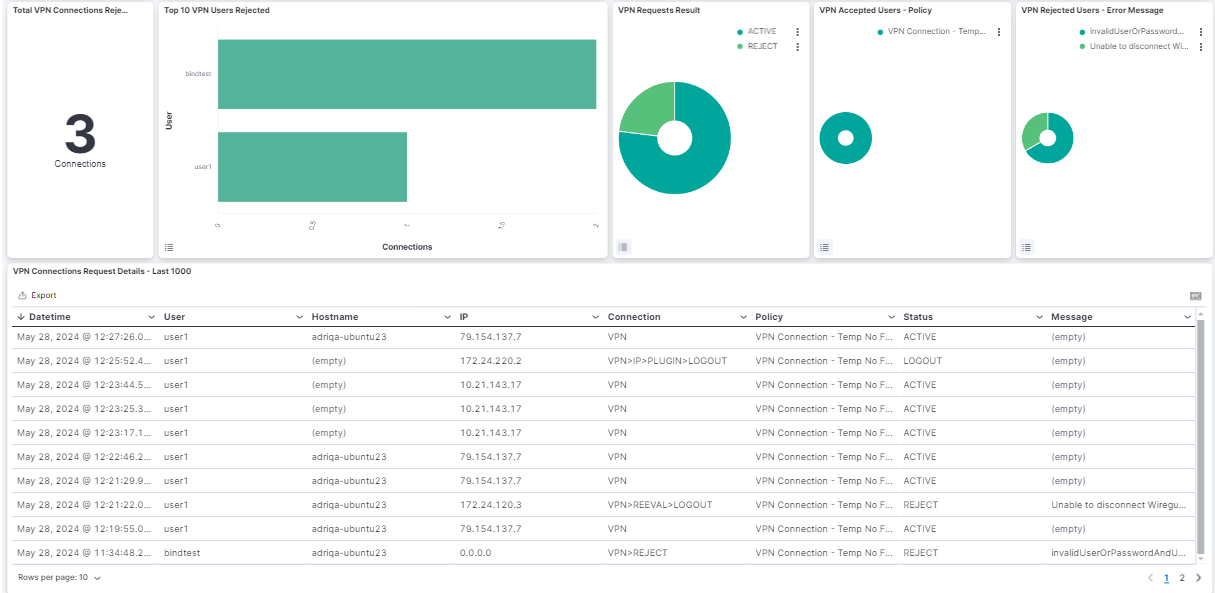
Total VPN Connections Rejected: Number of connections rejected.
TOP 10 VPN Users Rejected: Shows the top 10 users that generates the VPN requests, with the number of rejected requests for user. .
Connection Requests - VPN Servers: Represents the percentage of network devices VPN events.
VPN Requests Result: Represents the percentage of network devices VPN events results.
VPN Accepted Users - Policy: Represents the percentage of accepted users by policy.
VPN Rejected Users - Error Message: Represents the percentage of rejected users by error messages.
Connections Request Details - Last 1000: Shows a table with the last 1000 VPN connection requests details. In this table timestamp is represented, as well as the user, the hostname, the IP, the connection type, the policy rule and the message.
4.7.1.8.2. 2SRA Metrics
The 2SRA Metrics dashboard displays various metrics and statistics related to the 2SRA use case:
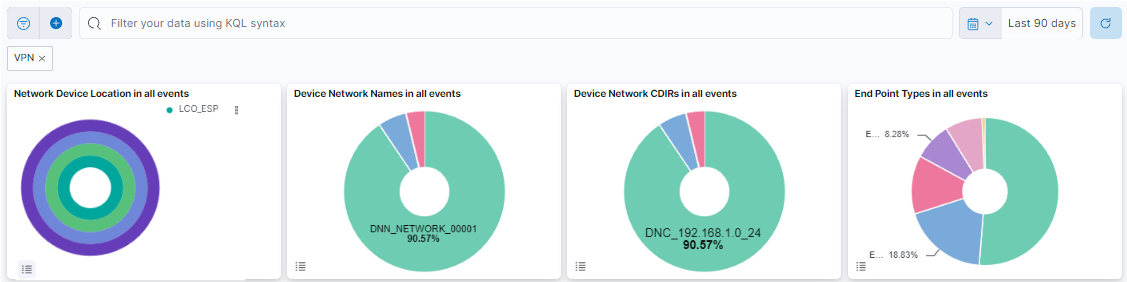
This header composed of four dashboards allows filtering by Network Device Location, Device Network Name, Device Network CDIRs, Endpoint Types. It will always look for the temporary index that is regenerated every day. In this toolbar, filter your data using KQL syntax.
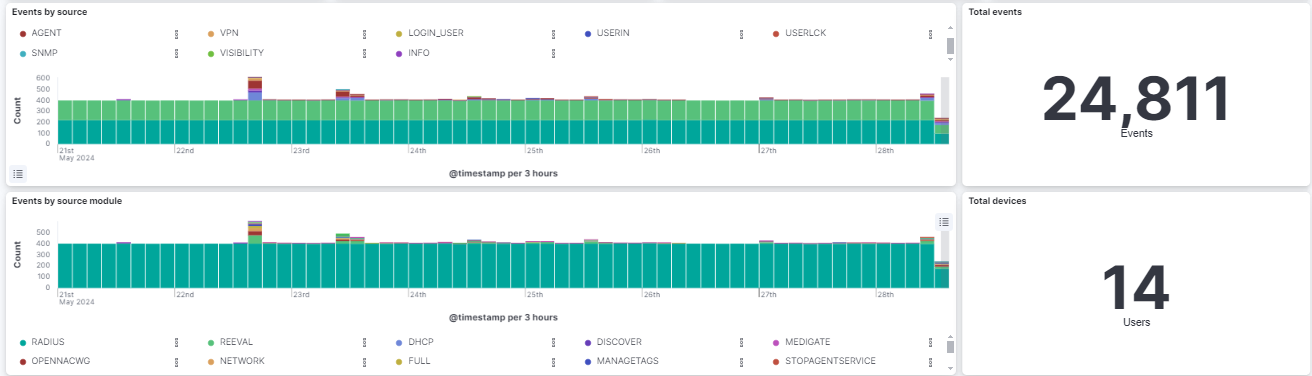
Events by source: The timeline of events by source (SNP, 8021XUSER, IP, VPN, etc.).
Total events: The total number of opennac events.
Events by source module: The timeline of events by source module (RADIUS, REEVAL, DISCOVER, STOPAGENTSERVICE, DHCP, etc.).
Total devices: The total number devices that generate opennac events.
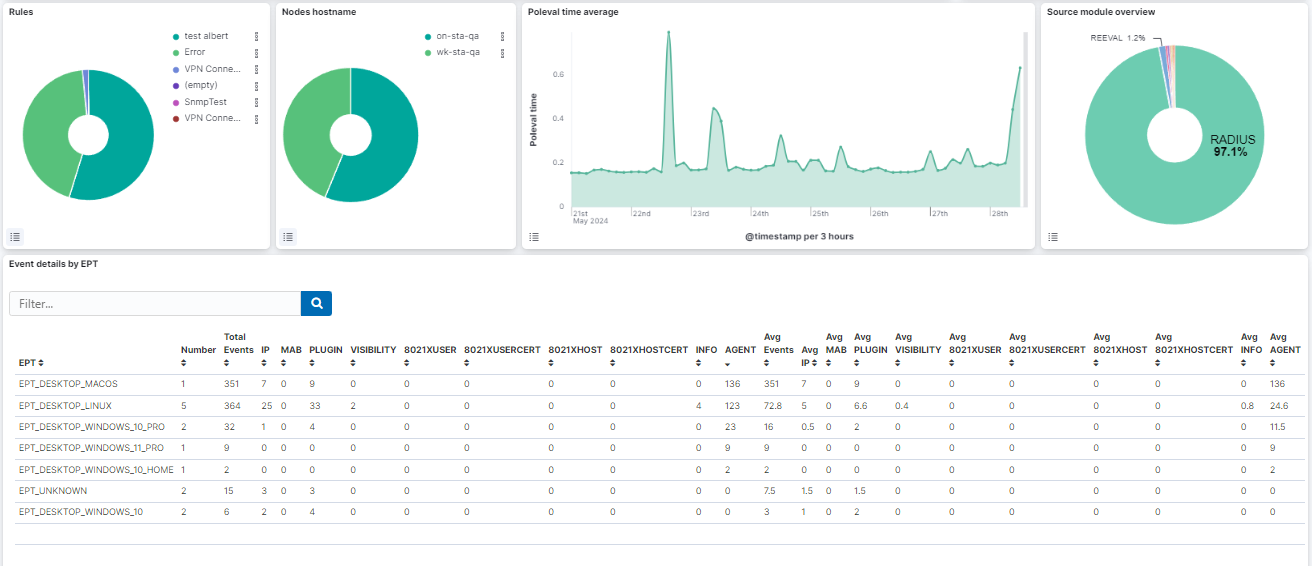
Rules: A pie chart showing the policies of the user devices.
Nodes hostname: A pie chart showing the hostnames of the farm nodes.
Poleval time average: A timestamp that shows the poleval time average.
Source Module overview: A pie chart showing the source module.
Event details by EPT: A table that shows the details of each event by EPT (number of events, source, etc).
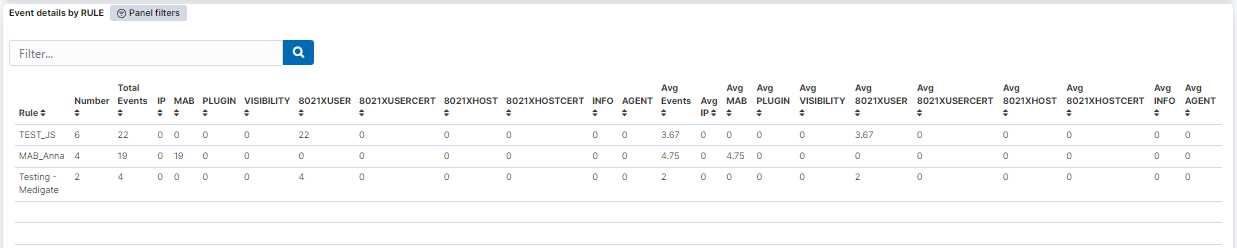
Event details by RULE: A table that shows the details of the events by policy.
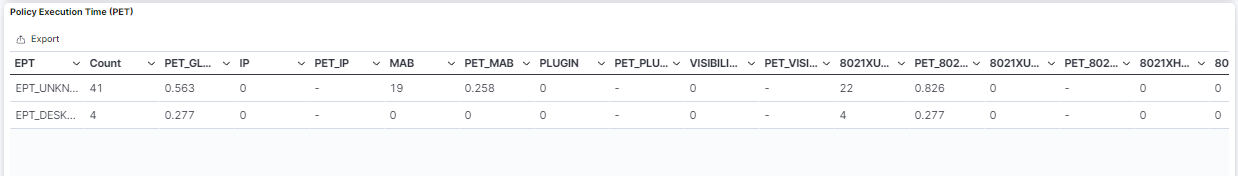
Policy Execution Time (PET): A table that shows the poleval execution time.
4.7.1.8.3. VPNGW
The VPNGW dashboard displays information about VPN Gateway events, metrics, and statistics.
4.7.1.8.3.1. Header
The three available views in the UNAC Overview section show different information about user devices and network devices. However, they have a common header, which refers to a consistent section at the top of each view that contains shared information.
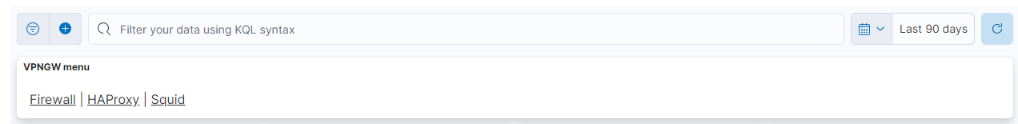
VPNGW Menu
The menu features different windows, such as Firewall, HAProxy, and Squid. Each window offers distinct dashboard views, allowing you to navigate between these sections. The following topics will explore these menu options in detail.
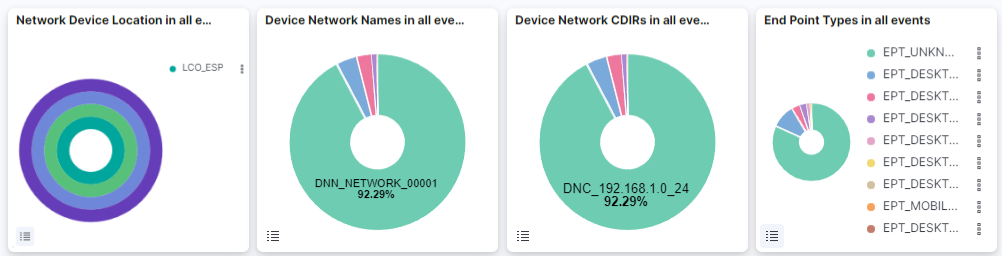
This header composed of four dashboards allows filtering by Network Device Location, Device Network Name, Device Network CDIRs, Endpoint Types. It will always look for the temporary index that is regenerated every day. In this toolbar, filter your data using KQL syntax.
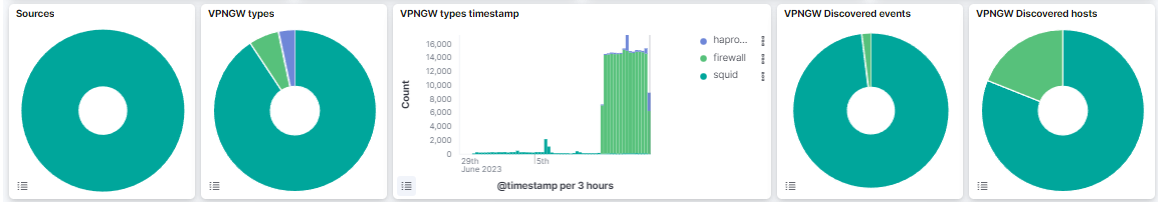
Sources: Graphic representation of the VPNGW sources.
VPNGW types: Graphic representation of the VPNGW types.
VPNGW types timestamp: VPNGW types timestamp per 3 hours.
VPNGW Discovered events: Graphic representation of discovered and unknown events.
VPNGW Discovered hosts: Graphic representation of discovered and unknown devices.
4.7.1.8.3.2. Firewall
The Firewall window displays firewall events and statistics information.
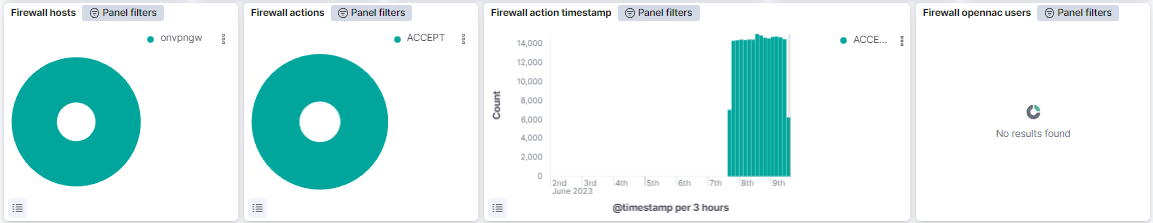
Firewall hosts: Graphic representation of firewall hosts.
Firewall actions: Graphic representation of firewall acceptance and rejection.
Firewall action timestamp: Firewall action timestamp per 3 hours.
Firewall opennac users: Graphic representation of firewall opennac users.
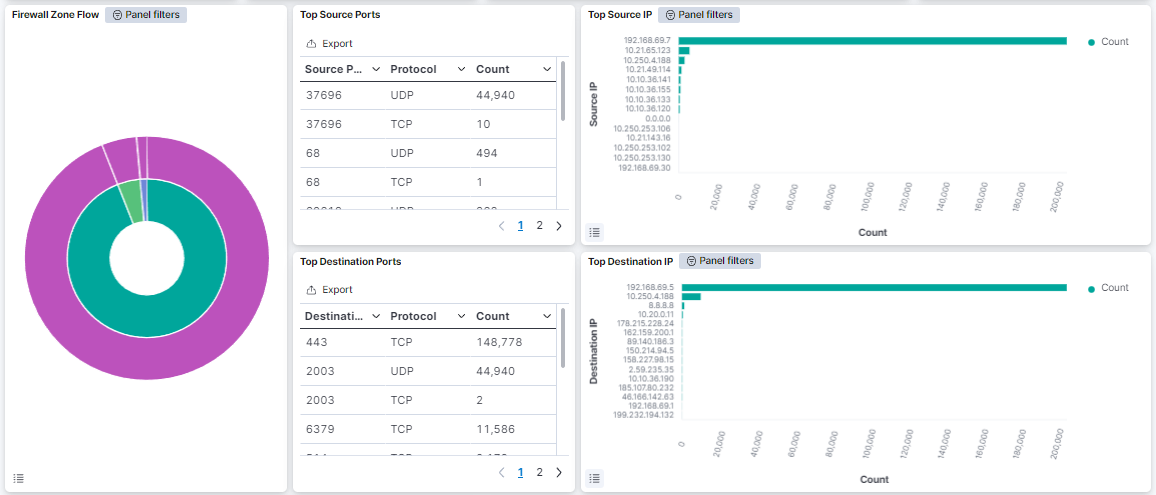
Firewall Zone Flow: Graphic representation of the firewall zone flow, where the inside pie chart shows the untrust connection data and the exterior pie chart shows the accepted connection data.
Top Source Ports: Table that features top source ports, protocols used and count of events.
Top Source IP: Graphic that represents the top source IP count.
Top Destination Ports: Table that features top destination ports, protocols used and count of events.
Top Destination IP: Graphic that represents the top destination IP count.
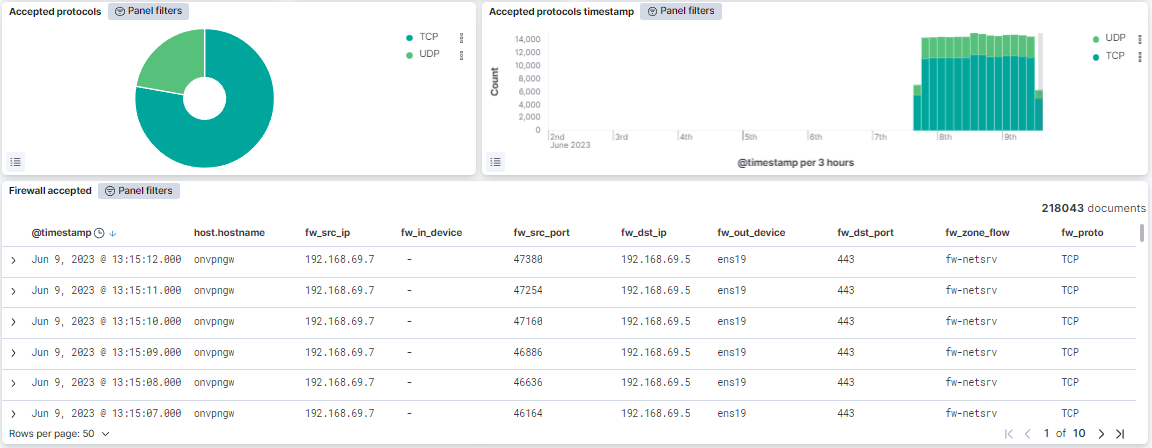
Accepted protocols: Graphic representation of accepted protocols (TCP, UDP,ICMP).
Accepted protocols timestamp: Accepted protocols timestamp per 3 hours.
Firewall accepted: Table that features the an overview of firewall accepted events.
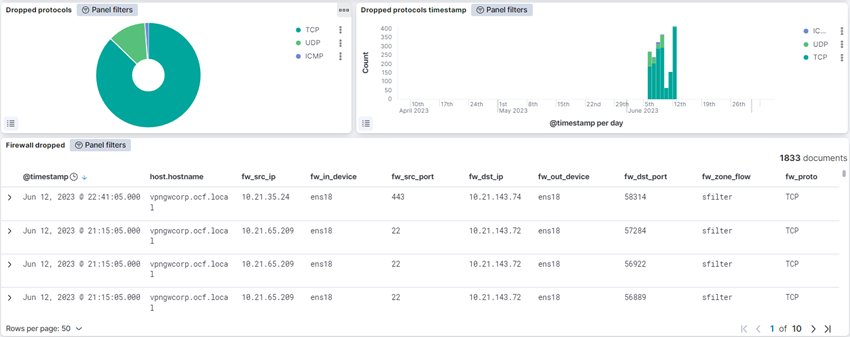
Dropped protocols: Graphic representation of the dropped protocols (TCP, UDP, ICMP).
Dropped protocols timestamp: Dropped protocols timestamp per 3 hours.
Firewall dropped: Table that features the an overview of firewall dropped events.
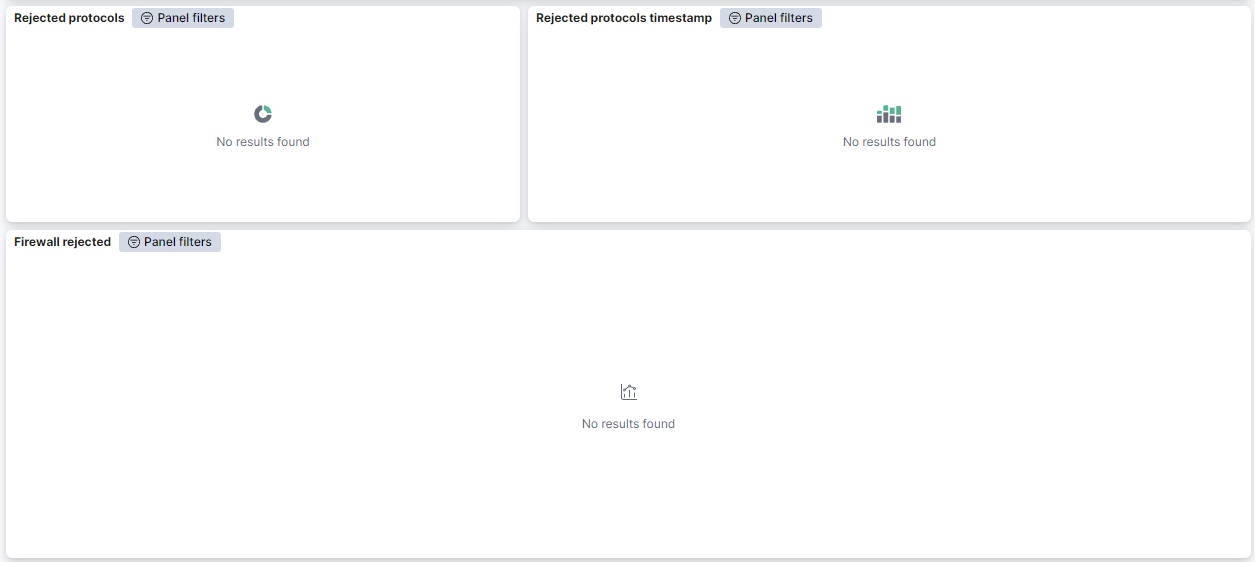
Rejected protocols: Graphic representation of the rejected protocols (TCP, UDP, ICMP).
Rejected protocols timestamp: Rejected protocols timestamp per 3 hours.
Firewall rejected: Table that features the an overview of firewall rejected events.
4.7.1.8.3.3. HAproxy
This window displays information about HAproxy servers, actions and requests.
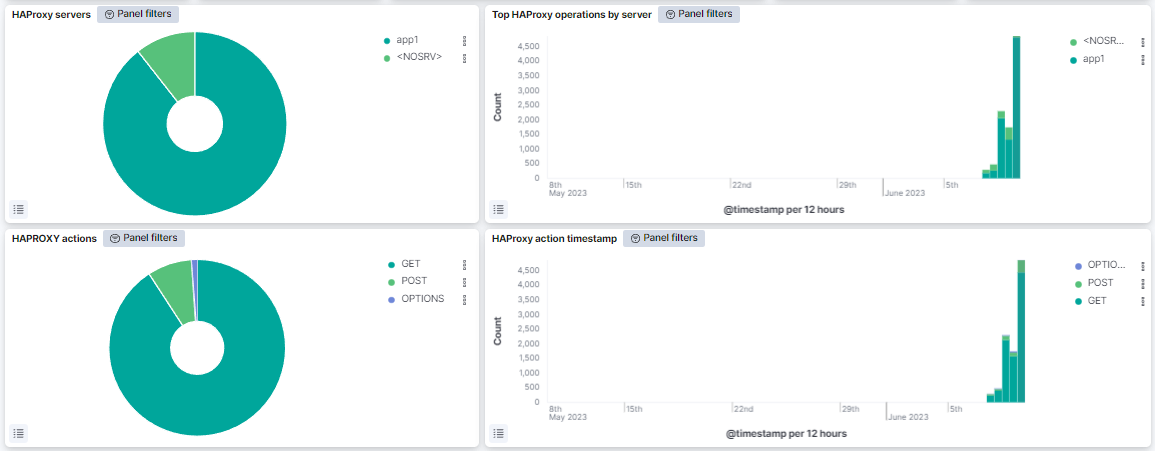
HAProxy servers: Graphic representation of the HAProxy servers.
Top HAProxy operations by server: Operations by server timestamp per 12 hours.
HAPROXY actions: Graphic representation of the HAProxy actions.
HAProxy action timestamp: HAProxy actions timestamp by 12 hours.
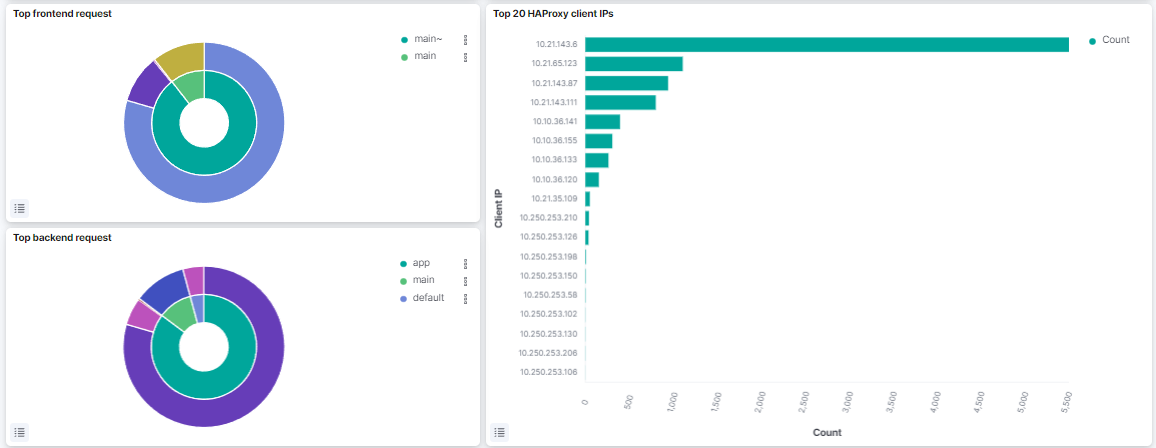
Top frontend request: Graphic representation of frontend requests.
Top 20 HAProxy client IPs: Count of Top 20 HAProxy client IPs.
Top backend request: Graphic representation of Top backend requests.
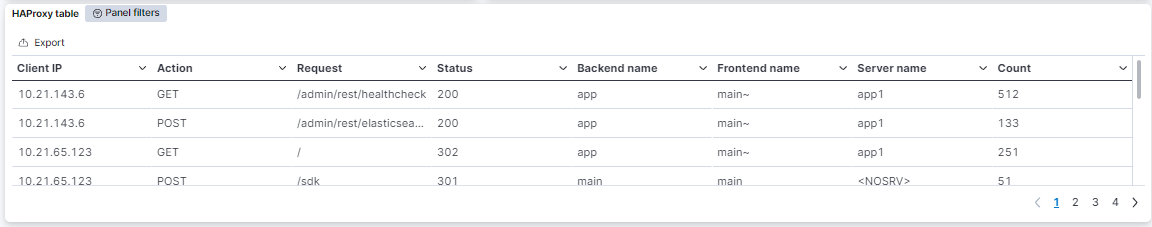
HAProxy table: Displays HAproxy requests details such as client IP, action, backend name, frontend name, server name, and count.
4.7.1.8.3.4. Squid
This window displays information about Squid Proxy Server statistics and metrics.
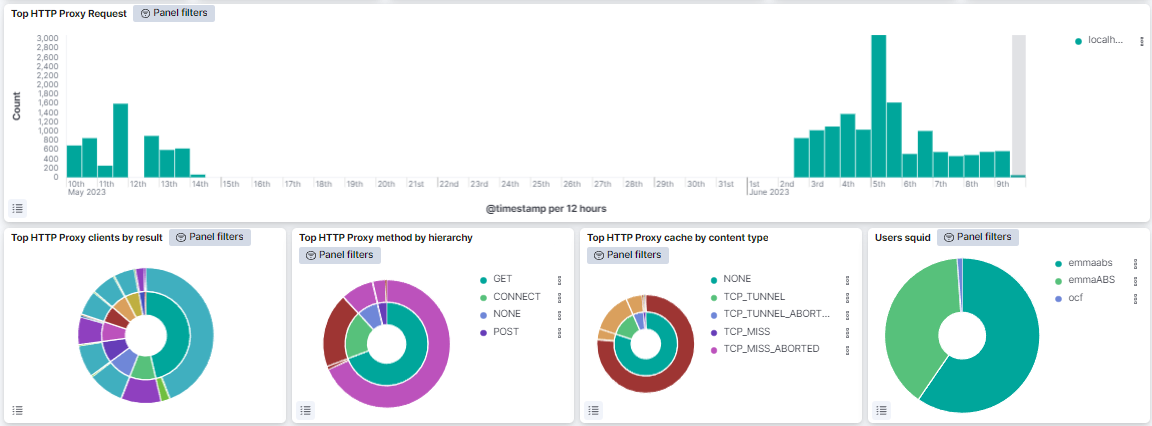
Top HTTP Proxy Request: Top HTTP proxy requests timestamp per 12 hours.
Top HTTP Proxy clients by result: Graphic representation of clients by result.
Top HTTP Proxy method by hierarchy: Graphic representation of top HTTP Proxy method by hierarchy.
Top HTTP Proxy cache by content type: Graphic representation of top HTTP Proxy cache by content type.
Users squid: Displays the users in a graphic representation.
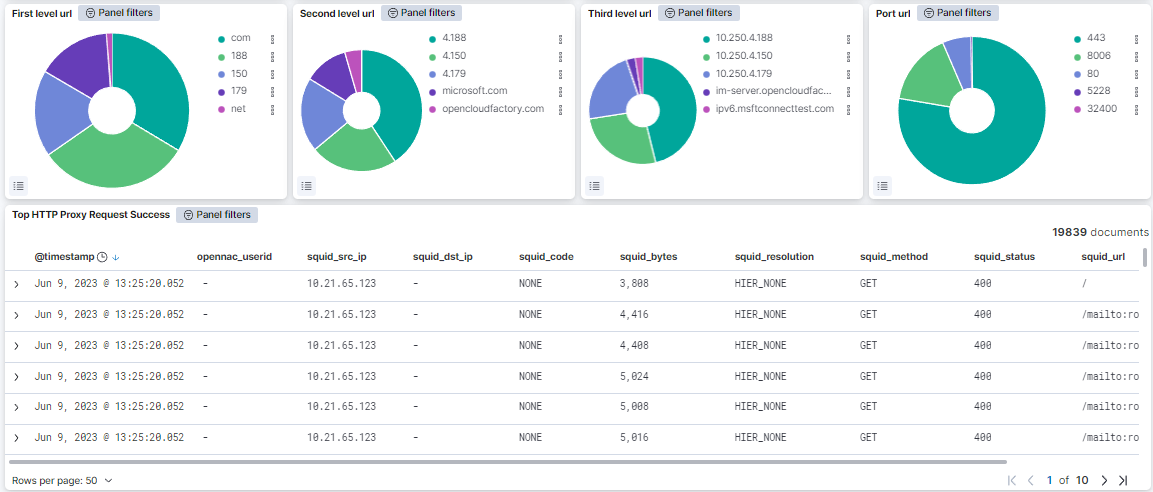
First level url: Graphic representation of first level URLs.
Second level url: Graphic representation of second level URLs.
Third level url: Graphic representation of third level URLs.
Port url: Graphic representation of ports associated with specific URLs.
Top HTTP Proxy Request Success: Timestamp of the success rate of top HTTP proxy requests.
4.7.1.8.4. Third Party VPN
The Third party VPN dashboard displays all the events related to the Third Party VPN use case.
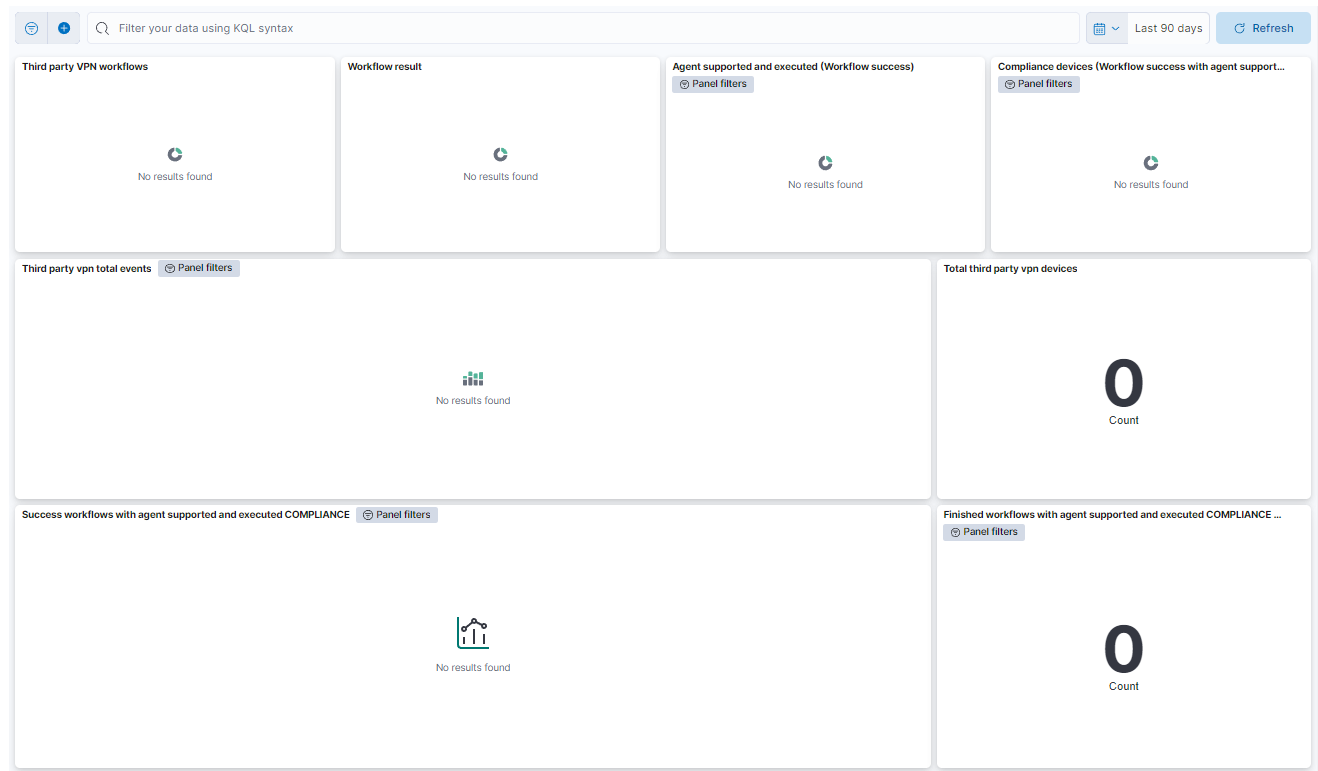
Third party VPN workflows: A pie chart that shows the Captive Workflow used.
Workflow result: A pie chart that shows the result of the workflow (success/not finished).
Agent supported and executed (Workflow success): A pie chart that shows the agent executed whether it is supported by the browser or not (and later executed or not) (supported/unsupported).
Compliance devices (Workflow success with agent supported): A pie chart that shows the relationship between compliance and not compliance devices.
Third party vpn total events: Third party VPN total events on a timeline.
Total third party vpn devices: The total number of third party VPN devices.
Success workflows with agent supported and executed COMPLIANCE: The workflows executed with the supported agent that are compliant.
Finished workflows with agent supported and executed COMPLIANCE count: The total number of workflows executed with the supported agent that are compliant.
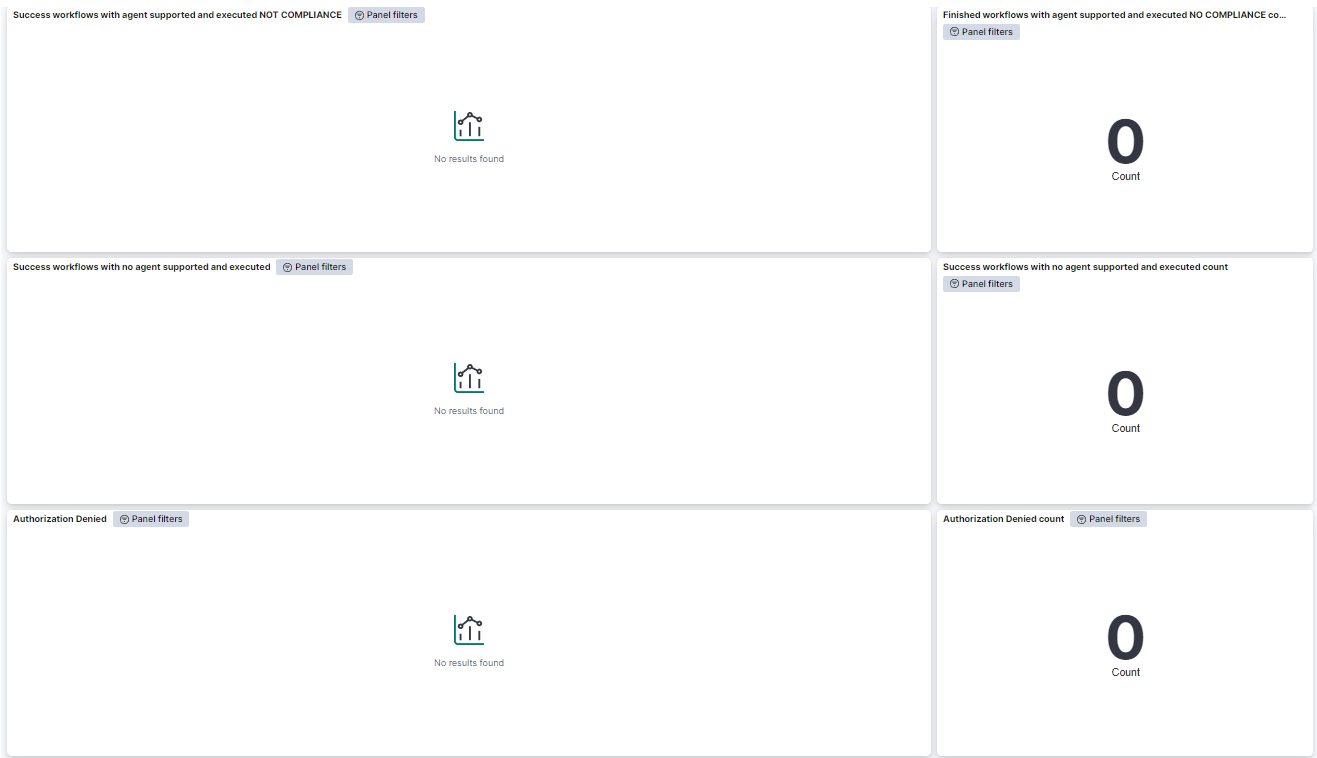
Success workflows with agent supported and executed NOT COMPLIANCE: The workflows executed with the supported agent that are NOT compliant.
Finished workflows with agent supported and executed NO COMPLIANCE count: The total number of workflows executed with the supported agent that are NOT compliant.
Success workflows with no agent supported and executed: The workflows executed but without the agent because of the browser.
Success workflows with no agent supported and executed count: The total number of workflows executed but without the agent because of the browser.
Authorization Denied: The authorizations that have been denied.
Authorization Denied count: The number of authorizations that have been denied.
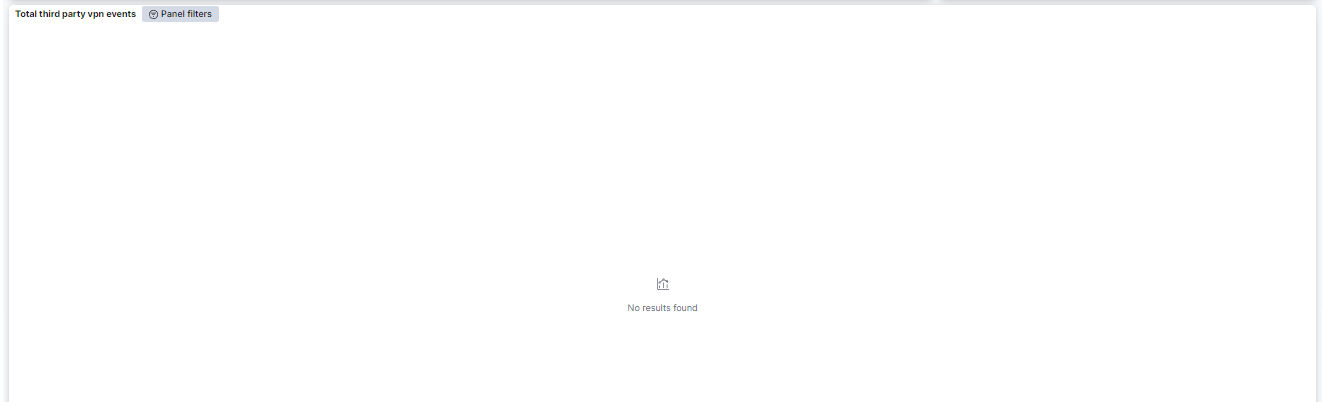
Total third party vpn events: List of third party VPN events that includes their time, opennac_ip, opennac_mac, host, opennac_userid, and opennac_rule.
You can also navigate to Administration Portal > Analytics > 2SRA to find information about the dashboards available for this use case.