5.1.3.1.4. Sensor
The Sensor device is basically composed of two interfaces:
Administration Interface
Traffic Capture Interface
The ON Sensor establishes communication with the ON Analytics and ON Core devices.
When the communication is established with ON Analytics or ON Aggregator, it sends logs to Logstash, using the Filebeat service.
When the communication is established with ON Core, it reads the packets from DHCP helper readers, access to two main services Redis and queue services gearmand.
This section has the basic troubleshooting for ON Sensor devices. It verifies the internal resources. It is also recommended to follow the trending guide in Opennac Administration Portal.
The main services on ON Sensor devices are:
DHCP Helper Reader service
Zeek service
PF_RING service
Filebeat service
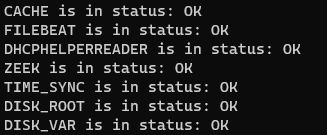
You can execute a complete review in the directory /usr/share/opennac/healthcheck using the command php healthcheck.php
cd /usr/share/opennac/healthcheck
php healthcheck.php
5.1.3.1.4.1. DHCP Helper Reader service
Check if the service is disabled, and enable it as you consider using the following commands:
systemctl (start|stop|restart|status|enable|disable) dhcp-helper-reader
You can modify or add the interface from where the Sensor receives packets:
vim /etc/sysconfig/dhcp-helper-reader
It is necessary to configure the OPTIONS variable as below:
OPTIONS="-r interface1 interface2 -s onprincipal -q oncore"
Restart dhcp-helper-reader service:
systemctl restart dhcp-helper-reader
Review the traffic on local interface using the tcpdump service. In this case we are using the core IP address:
tcpdump -Nnl -i eth0 host 172.16.3.4
5.1.3.1.4.2. Zeek service
Managing service Zeek:
systemctl (start|stop|restart|status) zeek
ps -ef | grep zeek
You can also verify the interface associated to Zeek service, and if there is traffic being listening on it.
tcpdump -i eth1 -Nnl
Check if Zeek service is correctly configured:
vim /opt/zeek/etc/node.cfg
Listening only one interface, (only need to change the interface):
[zeek]
type=standalone
host=localhost
interface=interface_name
Listening several interfaces we need several workers:
[logger]
type=logger
host=localhost

[manager]
type=manager
host=localhost

[proxy-1]
type=proxy
host=localhost

[worker-1]
type=worker
host=localhost
interface=interface1_name

[worker-2]
type=worker
host=localhost
interface=interface2_name
You can also check the disc space. By default, the Zeek logs are on the path /opt/zeek/. Check if this partition has free space:
cd /opt/zeek/
ls -l
dh -h
If you see the partition full, you can erase some files in /opt/zeek/logs. Each file of this path contains an entire day of logs. The current file contains the actual day logs.
You can modify the log rotation configuration in the file zeekctl.cfg in the path /opt/zeek/etc.
The files in /opt/zeek/logs/current should be written. Check if Zeek service is created and updated log files. We have to view files as conn.log, dns.log or dhcp.log
cd /opt/zeek/logs/current
ls -la
5.1.3.1.4.3. PF_RING service
Check if PF_RING service is correctly configured:
vim /etc/pf_ring/interfaces.conf
#MANAGEMENT_INTERFACES="eth0"
CAPTURE_INTERFACES="eth1"
Note
In the case of having more than one capture interface, after the name of the first interface a space will be left and then the name of the second one will be written. For example CAPTURE_INTERFACES=”eth1 eth2”
5.1.3.1.4.4. Filebeat service
The configuration files are in /etc/filebeat/. This service reads the files generated by zeek and sends them to the Analytics.
Managing service Filbeat:
systemctl (start|stop|restart|status) filebeat
ps -ef | grep filebeat
The filebeat file on var/log/filebeat should be written:
Check filebeat log:
cd /var/log/filebeat
ls -la
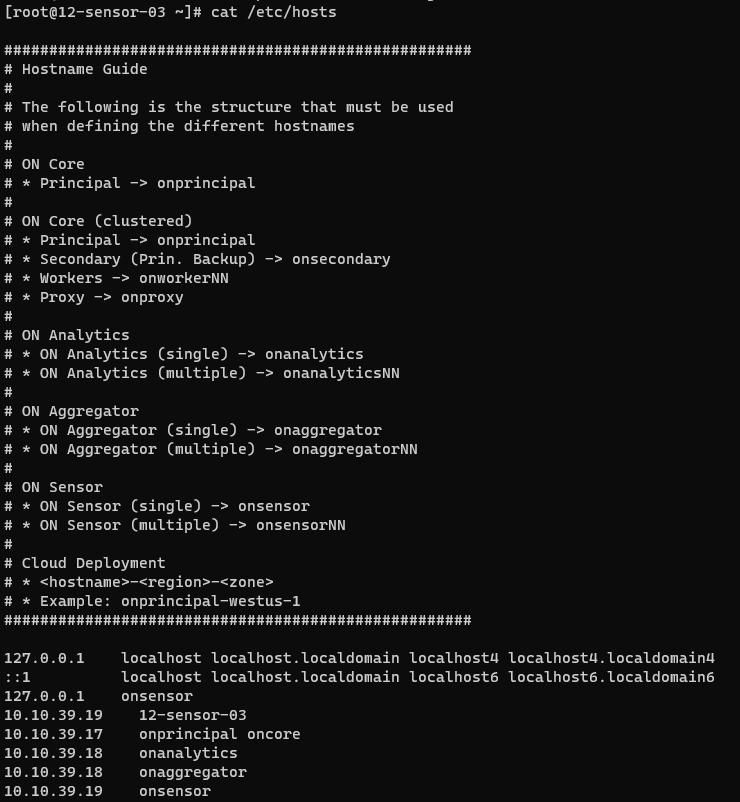
Make sure the hosts file on /etc has been properly configured. Remember that the onaggregator IP must be set.
The port used for communication between Sensor and ON Analytics/ON Aggregator is the tcp 5001:
netstat -ano | grep 5001
You can verify the connection to port 5001 at onaggregator executing the following command:
telnet onaggregator 5001
Verify the log traffic using tcpdump
tcpdump -Nnl -i eth0 port 5001
These packets are being sent to Logstash service in ON Analytics/ON Aggregator server.