5.1.3.1.3. ON Analytics
This section features the basic troubleshooting for the ON Analytics component -it verifies the internal resources. It is also recommended to follow the trending guide in Opennac Administration Portal.
The main services in ON Analytics devices are:
Logstash service
ElasticSearch service
Kibana service
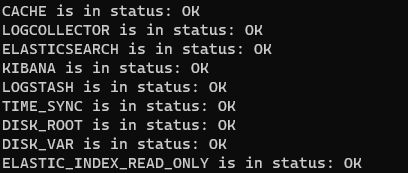
You can execute a complete review in this directory /usr/share/opennac/healthcheck using the command php healthcheck.php
cd /usr/share/opennac/healthcheck
php healthcheck.php
5.1.3.1.3.1. Logstash Service
Managing service Logstash:
systemctl (start|stop|restart|status) logstash
Check Logstash files:
tail -f /var/log/logstash/logstash.log
tail -f /var/log/logstash/logstash.err
tail -f /var/log/logstash/logstash.stdout
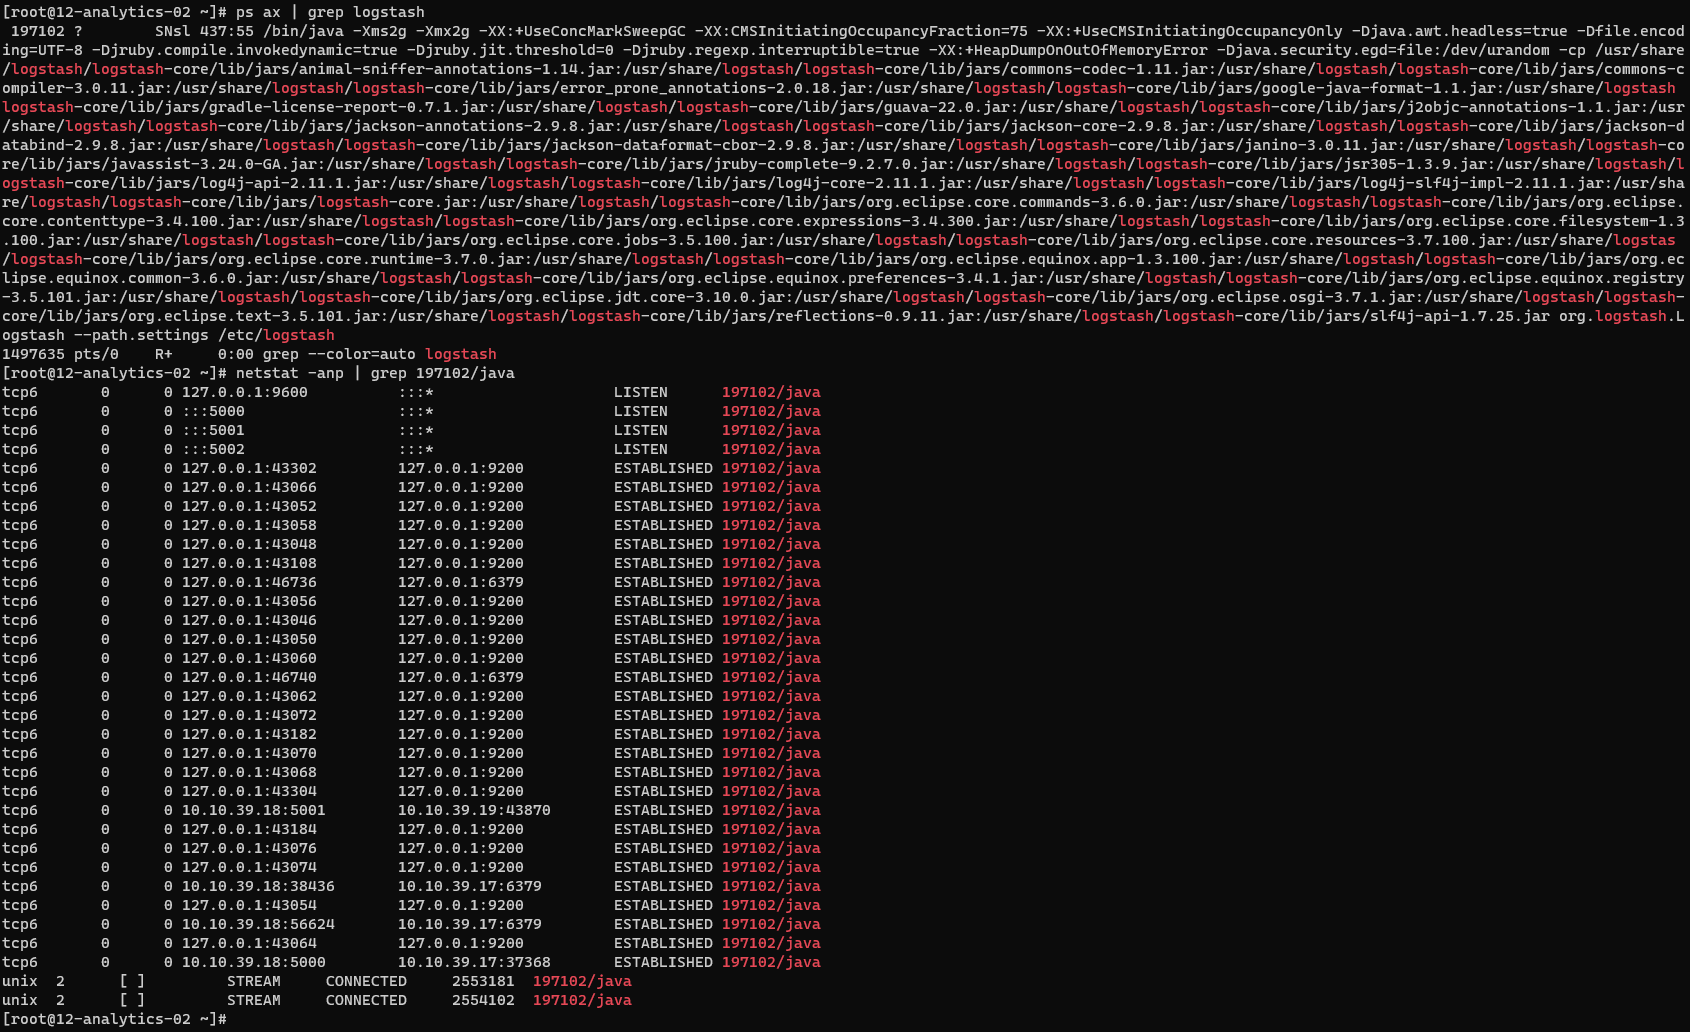
Verify Logstash ports:
First, find the id process then verify the associated port. The first command will let you know which is the process id for logstash, the second one, which is the used port by logstash process (5000/TCP,5001/TCP,5002/TCP).
ps ax | grep logstash
netstat -anp | grep 197102/java
Process running:
ps -ef | grep "logstash"
5.1.3.1.3.2. ElasticSearch Service
Managing service ElasticSearch:
systemctl (start|stop|restart|status) elasticsearch
Check ElasticSearch log:
tail -f /var/log/elasticsearch/elasticsearch.log
Data location:
ls /var/lib/elasticsearch/elasticsearch/nodes/0/indices/
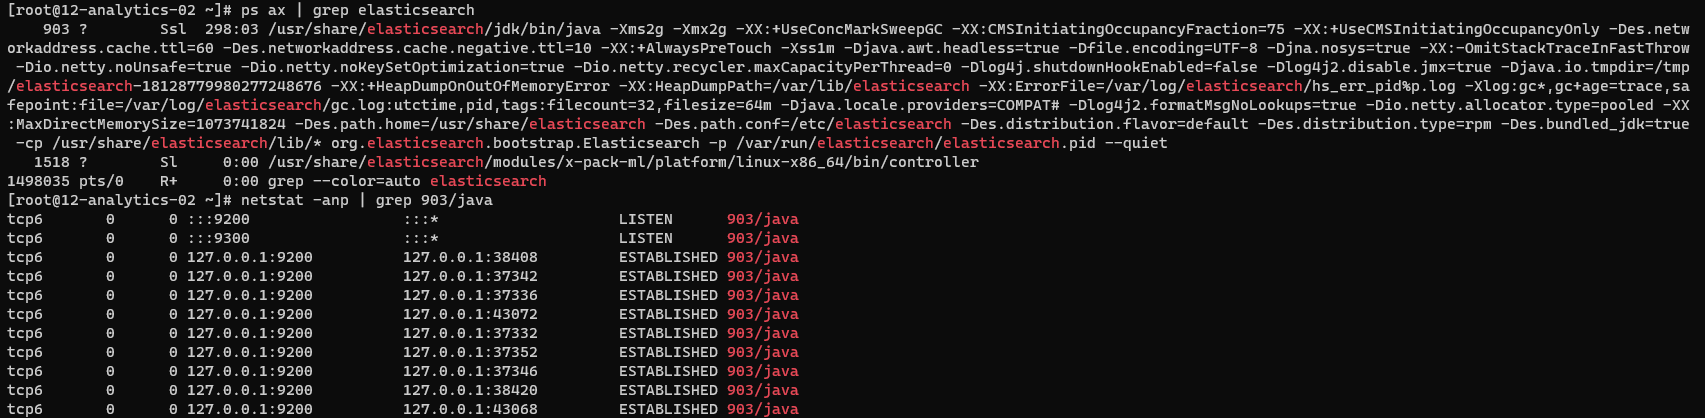
Verify ElasticSearch ports:
First, find the id process, then verify the associated port (9200/TCP,9300/TCP).
ps ax | grep elasticsearch
netstat -anp | grep 903/java
Process running:
ps -ef | grep "elasticsearch"
5.1.3.1.3.3. Kibana Service
Managing service Kibana:
systemctl (start|stop|restart|status) kibana
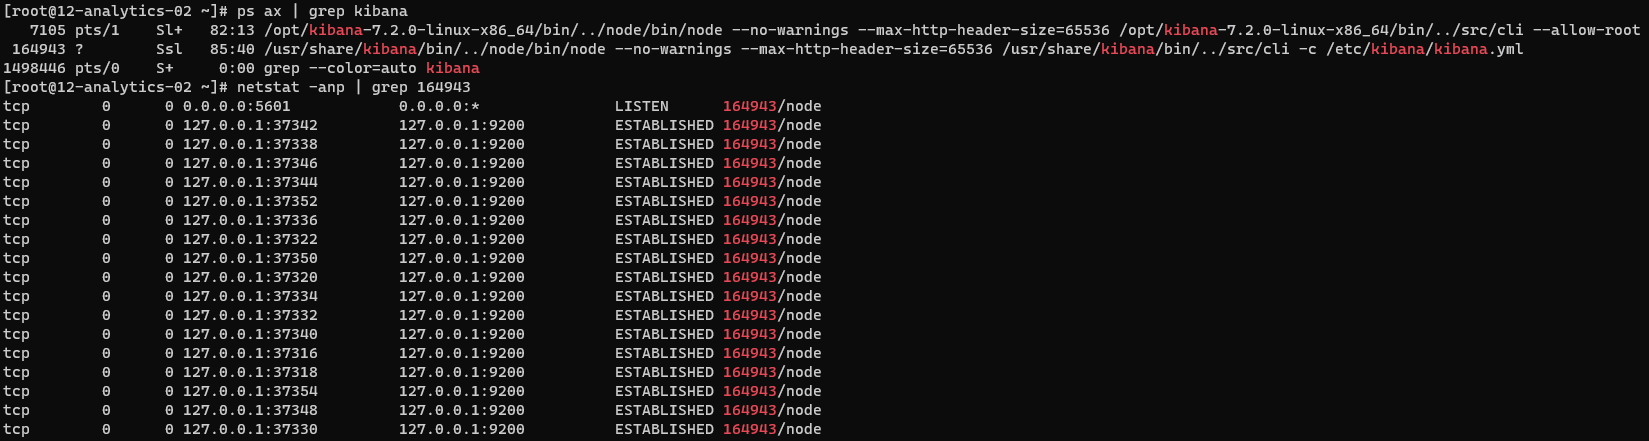
Verify Kibana ports:
First, find the id process, then verify the associated port (5601/TCP).
ps ax | grep kibana
netstat -anp | grep 164943
Process running:
ps -ef | grep "kibana"
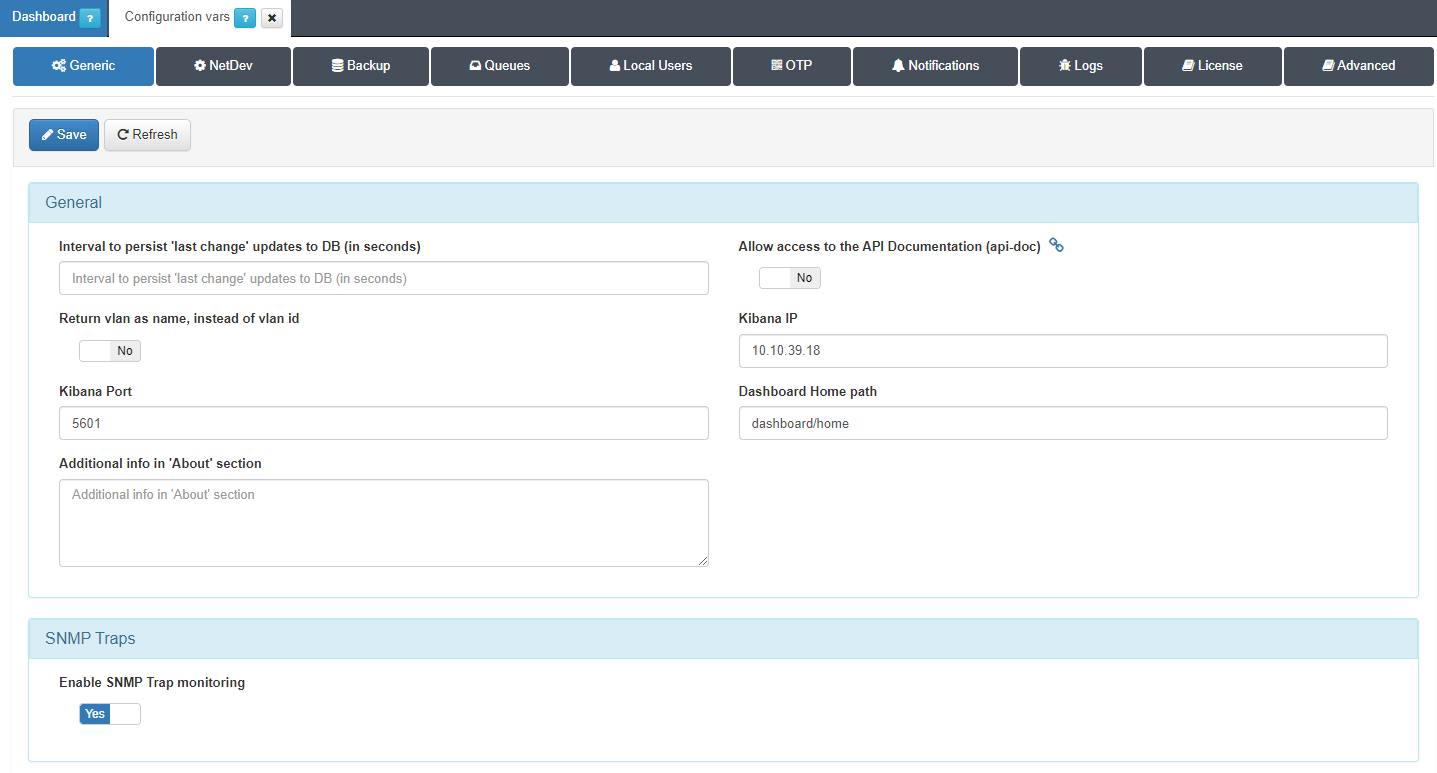
Verify the settings for kibana IP on Configuration -> Configuration vars -> Generic from Core web console.
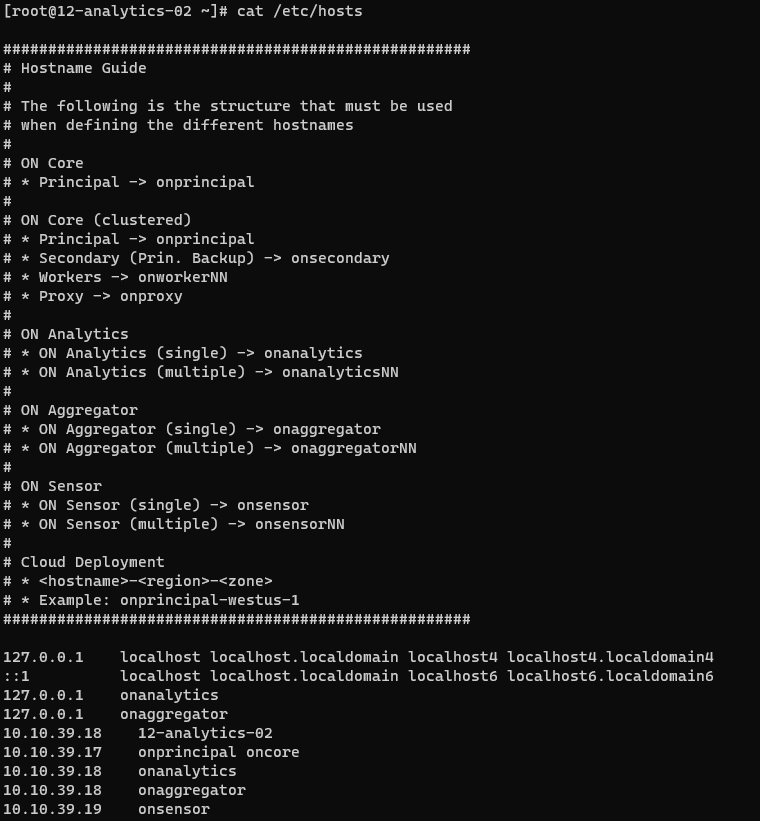
5.1.3.1.3.4. Hosts File
Make sure the hosts file /etc/hosts has been properly configured.
5.1.3.1.3.5. Reset ELK Stack
If you have explored different solutions without success, restarting the ELK Stack might address the persisting issues.
Warning
You should only restart ELK in exceptional cases and when it is acceptable to delete Elasticsearch data.
Explore the alternative solutions listed in this section before resorting to this measure.
1. Stop the ELK services:
systemctl stop elasticsearch
systemctl stop logstash
systemctl stop kibana
2. Once the services are stopped, delete the Elasticsearch data:
rm -rf /var/lib/elasticsearch/*
3. Start Elasticsearch:
systemctl start elasticsearch
4. Check if it is up and working properly:
curl localhost:9200/_cluster/health
5. If it is not working properly, check the Elasticsearch logs:
tail -f /var/log/elasticsearch/elasticsearch.log
If it is a cluster:
tail -f /var/log/elasticsearch/{{ cluster_name }}.log
6. Start Kibana:
systemctl start kibana
7. Check the Kibana logs to ensure that it is working properly:
journalctl -xeu kibana
8. Add mappings for OpenNAC indices and dashboards before logs are ingested:
/usr/share/opennac/analytics/scripts/elk8_update.sh -o update
9. Reset Logstash to initiate the logs entry.
systemctl start logstash
10. Check if it is up and working properly:
tail -f /var/log/logstash/logstash-plain.log
11. Verify that everything is functioning by accessing the Administration Portal and navigating to the Analytics section.
5.1.3.1.3.6. No data displayed in Kibana dashboards
If you are encountering issues with missing dashboards in Elasticsearch, you can use the script elk8_update.sh to attempt troubleshooting.
Ensure the
action.ymlfor Elasticsearch curator is the latest one:
Save the action.yml in a backup file:
mv /etc/elastCurator/action.yaml /etc/elastCurator/action.yaml.bckp
Copy the template from the latest action.yml:
cp /usr/share/opennac/analytics/curator/action.yaml /etc/elastCurator/action.yaml
Ensure that the customized values for each index in the backup file are manually applied to the corresponding indices in the new template.
Edit the file as follows:
vi /etc/elastCurator/action.yaml
Delete the following directory:
rm -rf /tmp/elasticsearch-bckp/*
From the ON Analytics node, execute the following command:
/usr/share/opennac/analytics/scripts/elk8_update.sh -o update
This script initiates an update process that may help in addressing the absence of dashboards.