5.1.3.1.2. ON Core
This section contains the basic troubleshooting for ON Core devices. It verifies the internal resources. It is also recommended to follow the trending guide in Opennac Administration Portal.
The main services in ON Core devices are:
Opennac service
Httpd service
Radius service
Mysqld service
Dhcp helper reader service
Gearmand service
Snmpd service
Collectd service
Redis service
Rsyslogd service
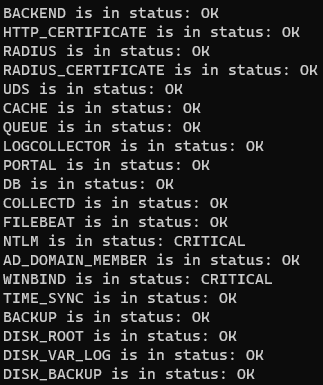
You can execute a complete review in this directory /usr/share/opennac/healthcheck using the command php healthcheck.php
cd /usr/share/opennac/healthcheck
php healthcheck.php
5.1.3.1.2.1. Opennac Service
Managing service Opennac:
systemctl (start|stop|restart|status) opennac
Check opennac workers log:
tail -f /var/log/opennac/opennac-job.log
Process running:
ps -ef | grep "worker.php"
5.1.3.1.2.1.1. Opennac API
Check API logs:
tail -f /var/log/opennac/opennac-analytics.log
tail -f /var/log/opennac/opennac-api.log
Enable debug mode in API:
vi /usr/share/opennac/api/application/configs/api.ini
resources.log.syslog.filterParams.priority = 7
Disable debug mode in API:
vi /usr/share/opennac/api/application/configs/api.ini
resources.log.syslog.filterParams.priority = 6
Relevant API configuration files:
vi /usr/share/opennac/api/application/configs/application.ini
<API configuration properties>
5.1.3.1.2.2. Httpd Service
Managing service HTTP:
systemctl (start|stop|restart|status) httpd
Check HTTP logs:
tail -f /var/log/httpd/opennac-access_log
tail -f /var/log/httpd/opennac-error_log
tail -f /var/log/httpd/opennac-https-access_log
tail -f /var/log/httpd/opennac-https-error_log
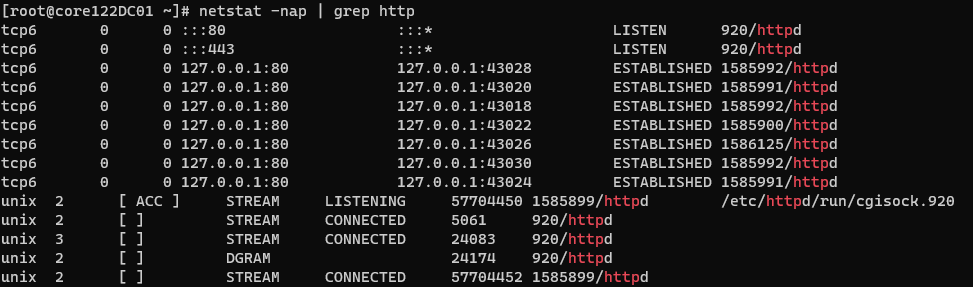
Verify HTTP(80)/HTTPS(443) ports:
netstat -nap | grep http
Process running:
ps -ef | grep "http"
5.1.3.1.2.3. RADIUS Service
Managing service RADIUS:
systemctl (start|stop|restart|status) radiusd
Check RADIUS log:
tail -f /var/log/radius/radius.log
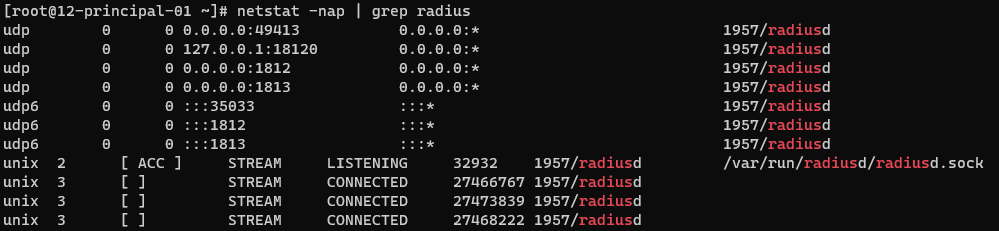
Verify RADIUS ports (1812/UDP -> authentication, 1813/UDP -> accounting):
netstat -nap | grep radius
Process running:
ps -ef | grep "radius"
Activate Debug service:
First stop radiusd service.
systemctl stop radiusd
Turn on the debug mode using:
radiusd -X
(or raddebug, adjusting "/etc/raddb/sites-available/control-socket")
5.1.3.1.2.4. MySQL Service
Managing service MySQL:
systemctl (start|stop|restart|status) mysqld
Check MySQL log:
tail -f /var/log/mysql/mysqld.log
Data location:
cd /var/lib/mysql/
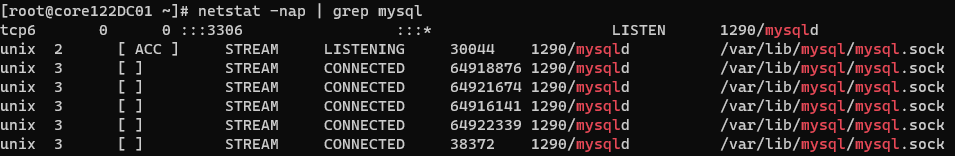
Verify MySQL ports (3306/TCP):
netstat -nap | grep mysql
Process running:
ps -ef | grep "mysql"
Console access:
mysql -u admin -p opennac
5.1.3.1.2.4.1. Replicating database
To check the database status, first of all we need to access to it.
mysql -u root -p opennac
Replication status in principal:
SHOW MASTER STATUS;
Replication status in worker:
SHOW SLAVE STATUS\G;
When replication problem in worker:
STOP SLAVE;
START SLAVE;
5.1.3.1.2.5. DHCP Helper Reader service
Verify if the service is disable, and enable it as you consider using the following commands:
systemctl (start|stop|restart|status|enable|disable) dhcp-helper-reader
You can modify or add the interface from where the ON Sensor receives packets:
vim /etc/sysconfig/dhcp-helper-reader
Running on ON Core, the OPTIONS variable needs to be empty, so it will listen on port 67 on all interfaces and connect to redis and gearmand on localhost.
#OPTIONS=
Restart dhcp-helper-reader service:
systemctl restart dhcp-helper-reader
Review the traffic on local interface using the tcpdump service. In this case we are using the core IP address:
tcpdump -Nnl -i eth0 host 172.16.3.4
5.1.3.1.2.6. Gearmand Service
Managing service Gearman:
systemctl (start|stop|restart|status) gearmand
Check Gearman log:
tail -f /var/log/gearmand.log
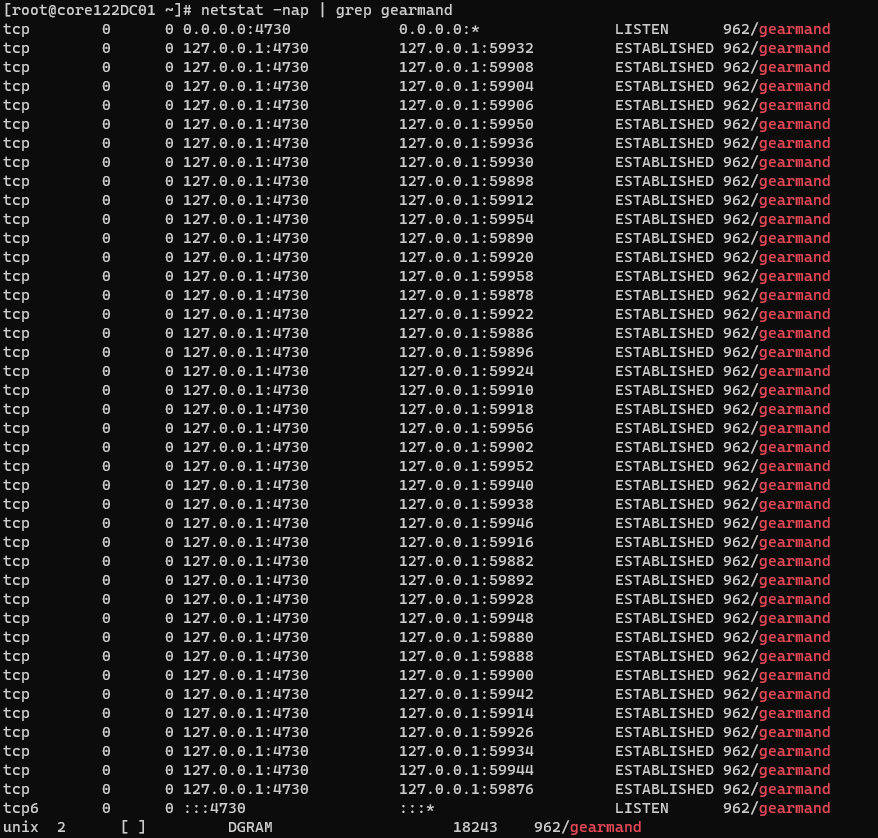
Verify Gearman ports:
Open ports in principal (4730/TCP):
netstat -nap | grep gearmand
Process running:
ps -ef | grep "gearmand"
5.1.3.1.2.7. SNMP Service
Managing service Collectd:
systemctl (start|stop|restart|status) snmptrapd
Check Snmptrapd log:
tail -f /var/log/messages | grep snmptrapd
tail -f /var/log/opennac/opennac-job.log | grep -i snmp
tail -f /var/log/opennac/opennac-poleval.log | grep -i SnmpMac
Verify snmp ports (162/UDP):
netstat -nap | grep snmp
Check that snmp traps are being received:
tcpdump -i eth0 port 162
Process running:
ps -ef | grep "snmp"
5.1.3.1.2.8. Collectd service
Managing service Collectd:
systemctl (start|stop|restart|status) collectd
Check Collectd log:
tail -f /var/log/messages
Data location:
ls /var/lib/collectd/
Verify Collectd ports in onprincipal (25826/UDP):
netstat -nap | grep collectd
Process running:
ps -ef | grep "collectd"
5.1.3.1.2.9. Redis Service
Managing service Redis:
systemctl (start|stop|restart|status) redis
Check Redis log:
tail -f /var/log/redis/redis.log
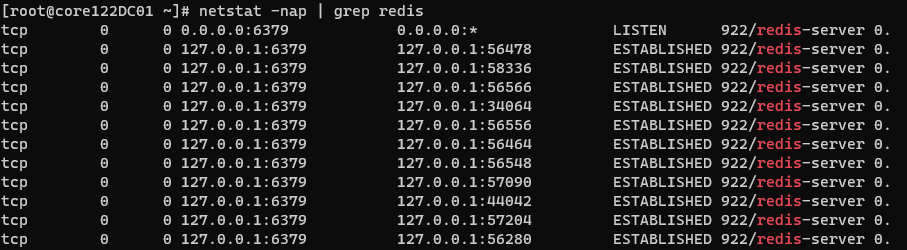
Verify Redis ports (6379/TCP):
netstat -nap | grep redis
Process running:
ps -ef | grep "redis"
5.1.3.1.2.10. Rsyslog Service
Managing service Rsyslog:
systemctl (start|stop|restart|status) rsyslog
Check Rsyslog logs:
tail -f /var/log/messages
or /var/log/opennac/…
Verify Rsyslog send data to Analytics on port 5000/TCP
tcpdump -nn port 5000
Note
tcpdump to be executed where Logstash is running
Process running:
ps -ef | grep "rsyslog"