4.2.6. Operation
This section aims to show the workflow of the UNAC module basic operation.
The implementation of the UNAC module can include functionalities such as network segmentation (Segmentation module) and end device compliance (End Point Compliance module) to improve the security of the network environment.
The Basic Operation module will detail all those dashboards that, from a basic operation point of view, will provide us with useful information on the operation and UNAC registration of our network.
The Administration module will detail the steps to follow to configure the system and make it ready to operate its UNAC functionality together with all its functionalities, network access, segmentation, compliance, etc.
Note
Before proceeding with the operation section, make sure you have completed the administration configurations to prepare the system for basic operations.
Basic Operation:
Analyze the information contained in the Business Profiles.
Understand the information available in the solution’s dashboards.
Make reconnections from the system (Toggle Port).
Quarantine devices.
Learn to filter the information within the dashboards.
4.2.6.1. Business Profiles
The Business Profiles section provides comprehensive, feature-rich views where you can see the latest status of connections made on the network and detected by the system. For each of these connections, OpenNAC displays information related to the device and the connection itself, such as status, source, policy, and more.
4.2.6.1.1. Default View
The Default View window can display several Profiles, where each one of them can group the connection states depending on the Policy in which they have entered.
Note
You can create as many Business Profiles as you need; there is no limit.
These groups are created to structure and organize these connections in environments where there may be a large number of devices and connections, thus facilitating the queries in this section.
To access the Default View navigate to ON NAC > Business Profiles > Default View.
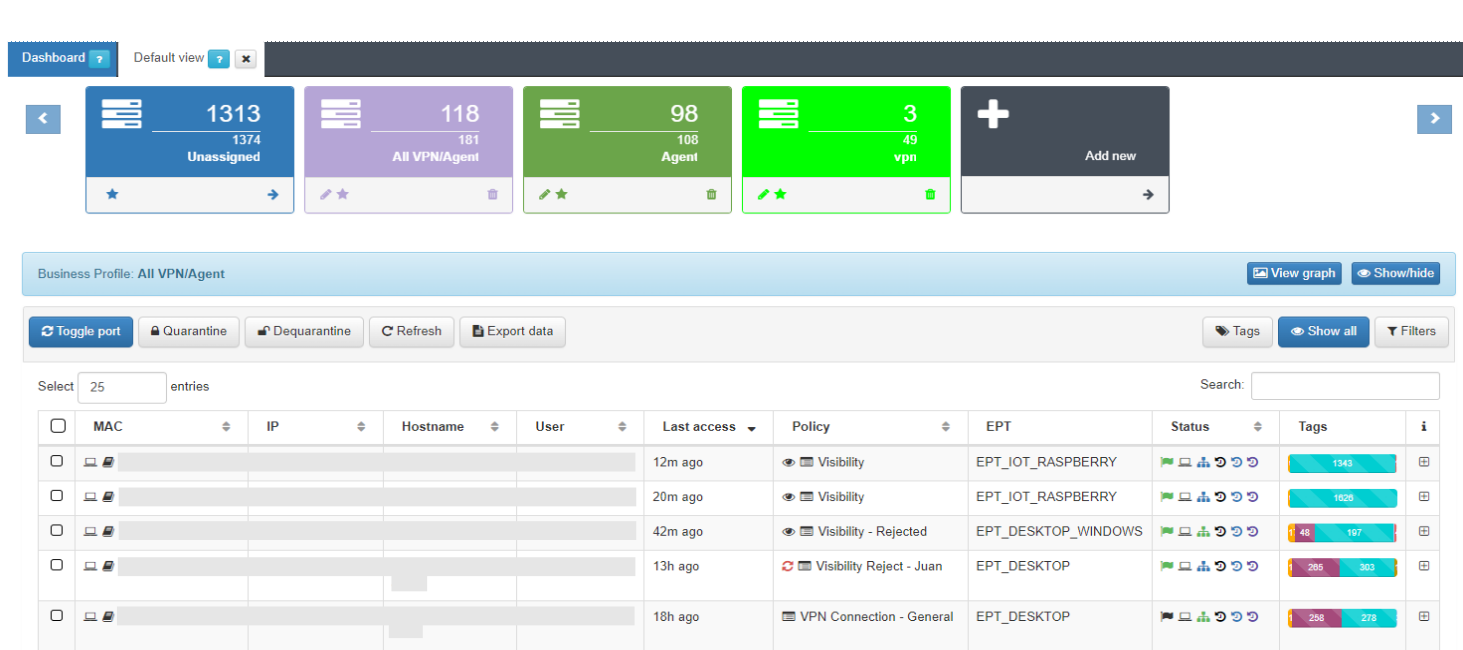
The table displays the details of the latest connections to the network. The information of each connection is grouped in the following columns:
MAC: MAC address of the device.
IP: IP assigned to the device.
IP Switch: IP of the switch to which the device has been connected.
Hostname: Hostname of the device in case it is discovered.
User: User with which the device authenticates.
Last Access: Time elapsed since the last event related to the user.
Policy: Policy with which the device has fallen. (Section 3.1.1)
Vlan: VLAN that has been assigned to the device by evaluating the policies.
Source: Order and type of connection source (802.1x, Visibility, VPN, etc.)
EPT: Tag* referring to the type of device (End Point Type).
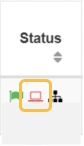
Status: Status of the connection (Active/Disconnected, assigned VLAN, etc.).
Tags: Numerical representation of the Tags* assigned to the device.
Tip
Learn all operational capabilities of this view within the Business profiles Overview section.
Expand the information of each connection by clicking on +, located at the right end of each connection row:
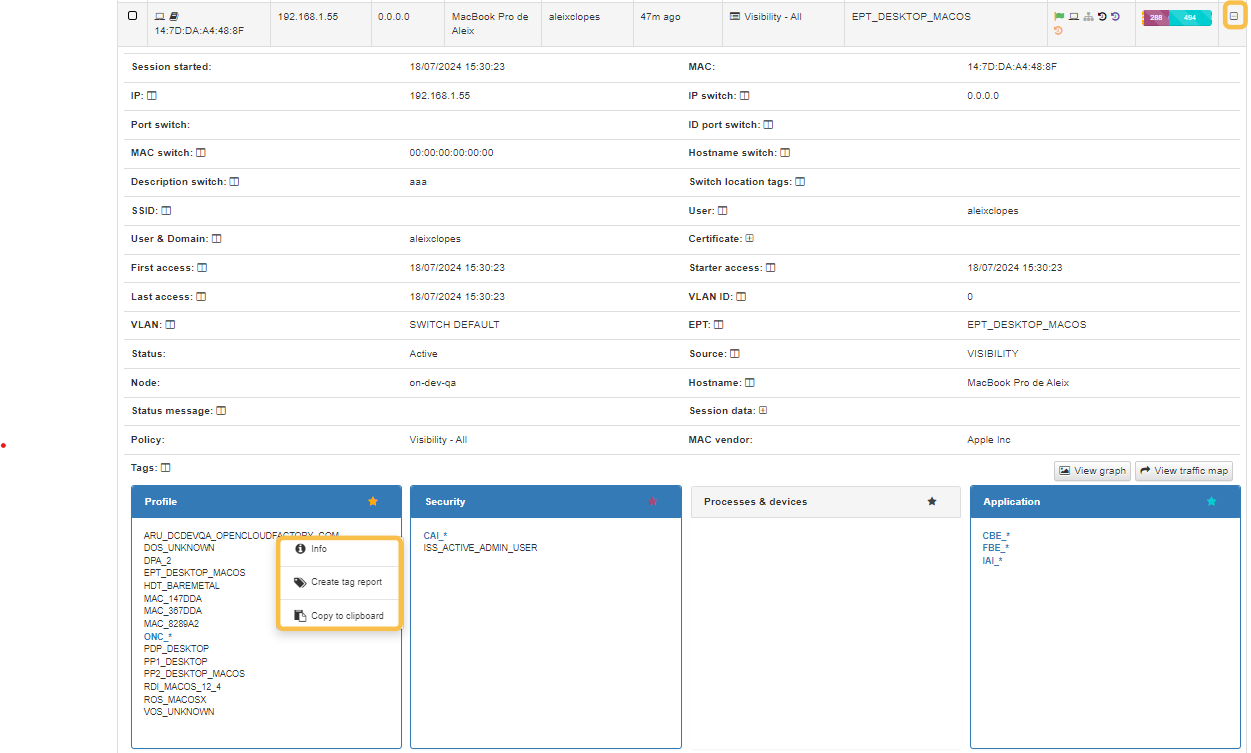
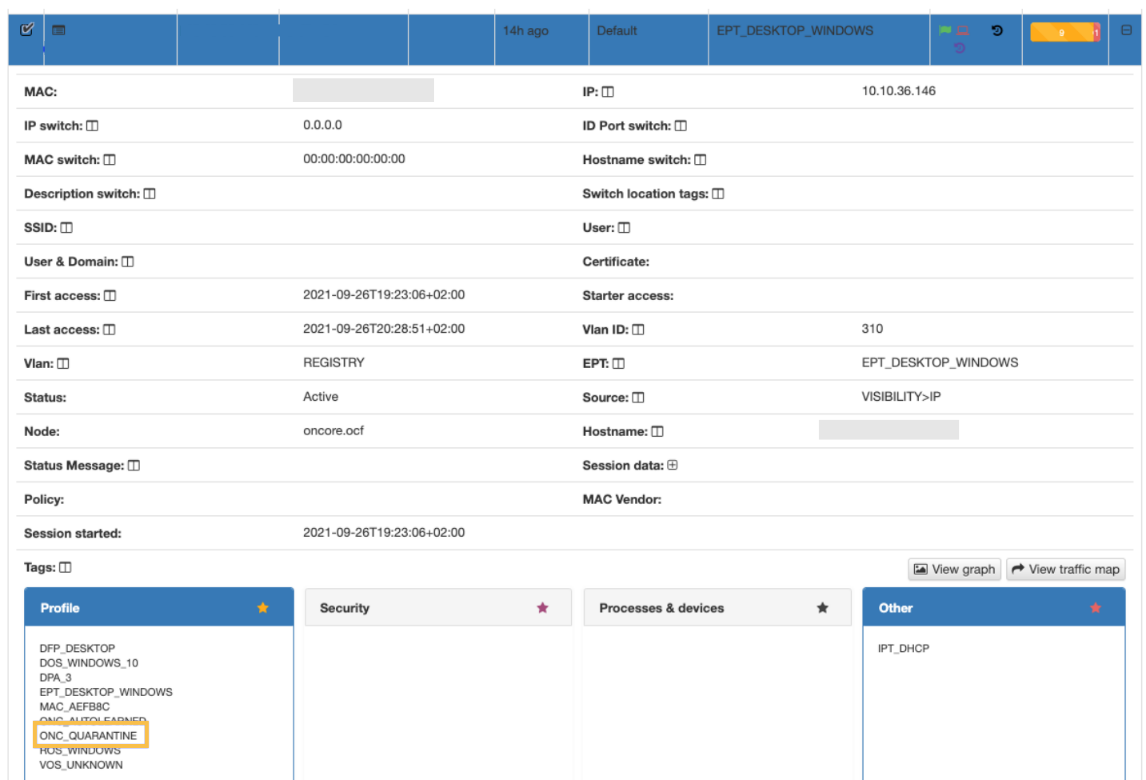
This expanded drop-down includes all relevant information about the devices and the established connections:
The upper section presents essential details of the connection, such as MAC address, hostname, user, policy, and connection source.
The lower section showcases the TAGs, which are labels assigned to devices that provide us with additional information. These tags are categorized by families, represented by three letters at the beginning of the tag, followed by an underscore and the specific characteristic. For instance, the tag “ROS_WINDOWS” stands for Root Operating System of the Windows type.
Refer to the Tags Table for a complete list of Tags prefixes and their description.
4.2.6.1.2. Policy evaluation details
By clicking on the  icon under the “Policy” column of the Business Profiles section, it will display the Policy Evaluation for the events generated in the system.
It will only display the last 10 registered events. The initializing events, that is, those that will cause a policy evaluation (for example, authentication events such as 802.1X or MAB) will appear in blue:
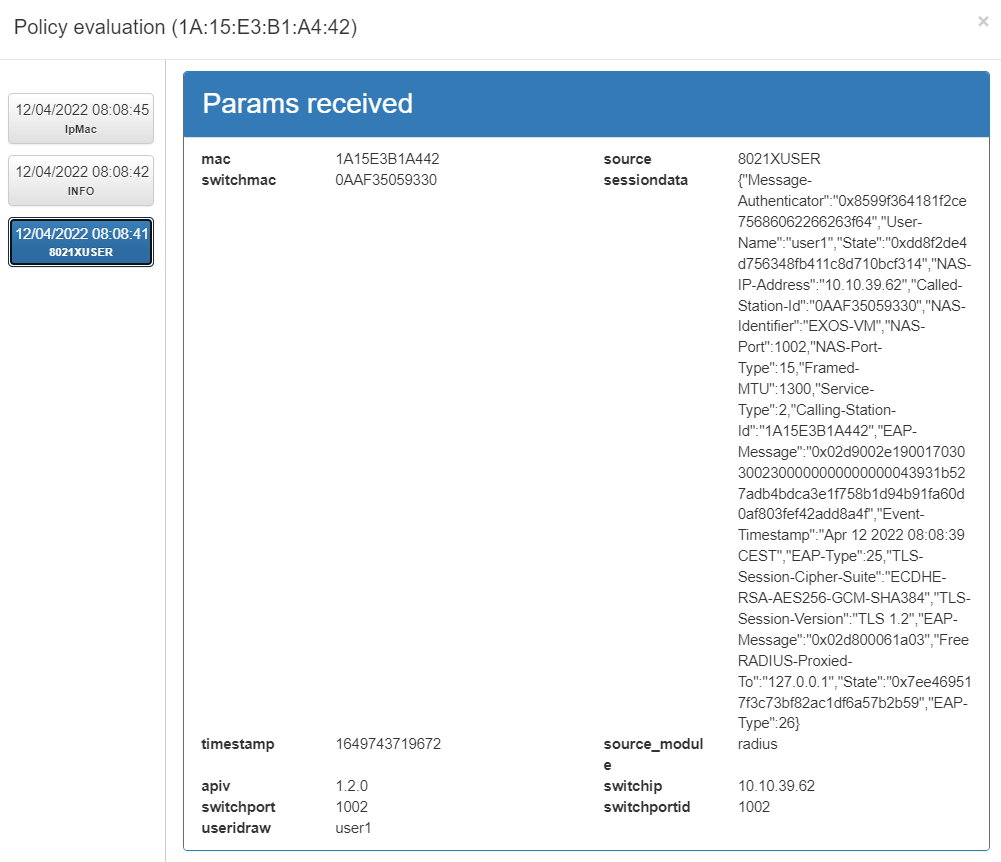
Params received: Parameters that are obtained from the event received in the system. This information includes the MAC of the device (mac), the type of event (source), IP of the switch from which it is received (switchip), etc.
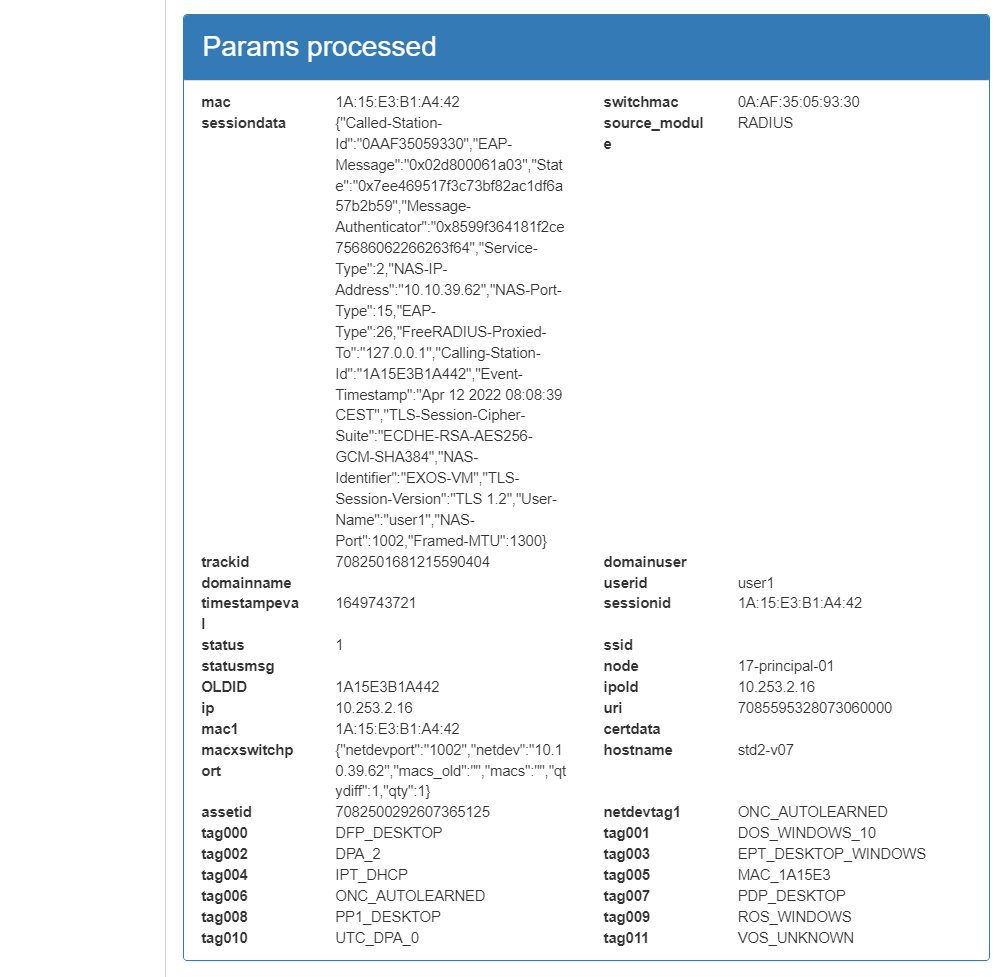
Params processed: These parameters correspond to the information that has been processed by the system and will be stored. This includes information received externally as well as information generated internally, such as device TAGS.
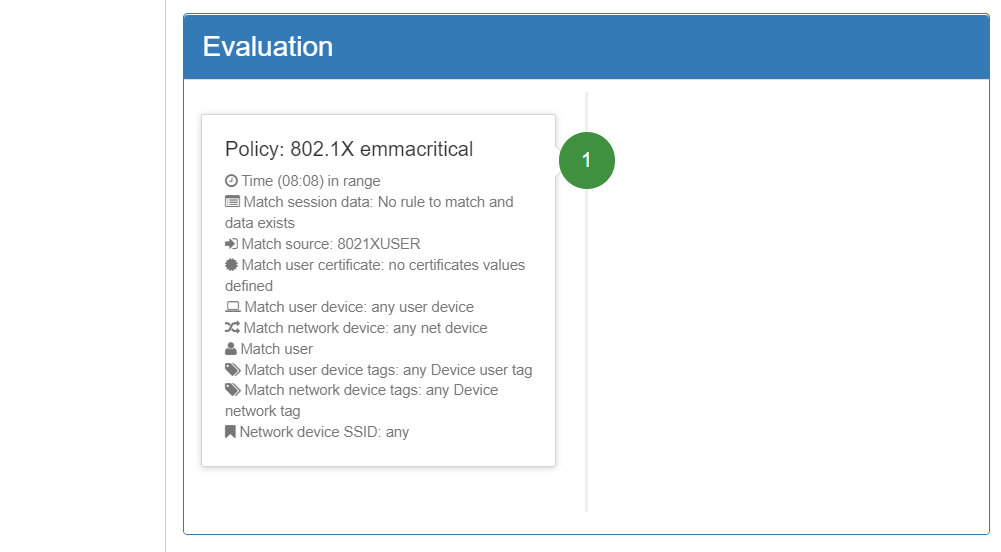
Result: The policy evaluation flow is shown here. Following the order defined in policy creation, the preconditions are evaluated to determine whether or not it should fit the policy. For each evaluated policy, the first precondition that discards it will be shown (in red) until reaching the policy to which it matches. There are events that do not generate a policy evaluation, so this section will not be displayed.
The policy evaluation information helps to understand why a device matched a particular policy and allows visibility into the parameters received, enabling necessary adjustments to be made to the policies.
4.2.6.1.3. Policy Features
By clicking on the ![]() icon under the “policy” column of the Business Profiles section, it will display the connection Policy details:
icon under the “policy” column of the Business Profiles section, it will display the connection Policy details:
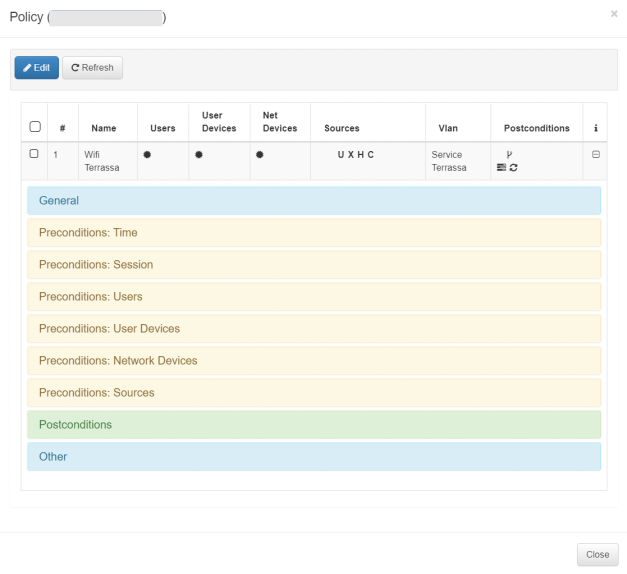
This window will show the configuration of the last policy in which the device has matched. We can see all the configured parameters of said policy:
General: General characteristics of the policy (Name, description, status).
Preconditions: Conditions that must be met for a device to fit into that policy. There are several preconditions with different functionalities.
Postconditions: Actions that will be executed in case a device fits the policy.
If you have administrator permissions, it will also be possible to edit said policy by selecting it and pressing the “Edit” button.
Note
To learn more about the configuration of policies, we can consult Administration.
4.2.6.1.4. Toggle Port
The Toggle Port functionality in Business Profiles allows for policy reassessments when necessary. This feature enables us to apply any policy changes or force a re-authentication for specific sessions as needed.
If we want to perform a Toggle Port to any of the sessions that exist in the Business Profiles, we simply have to select the session and click the Toggle Port button.

It will send a request to the network device where the client has been authenticated to perform a disconnection and a subsequent connection. It will force a re-authentication and re-evaluation of the policies.
Note
The Toggle Port functionality must be previously configured for the network device.
4.2.6.2. Quarantine/Dequarantine
Devices can be isolated or moved to “Quarantine” through the Business Profiles section.
Note
This functionality is requires the Segmentation module license and its proper configuration.
To quarantine any session within the Business Profiles, simply select the desired session and click the Quarantine button.
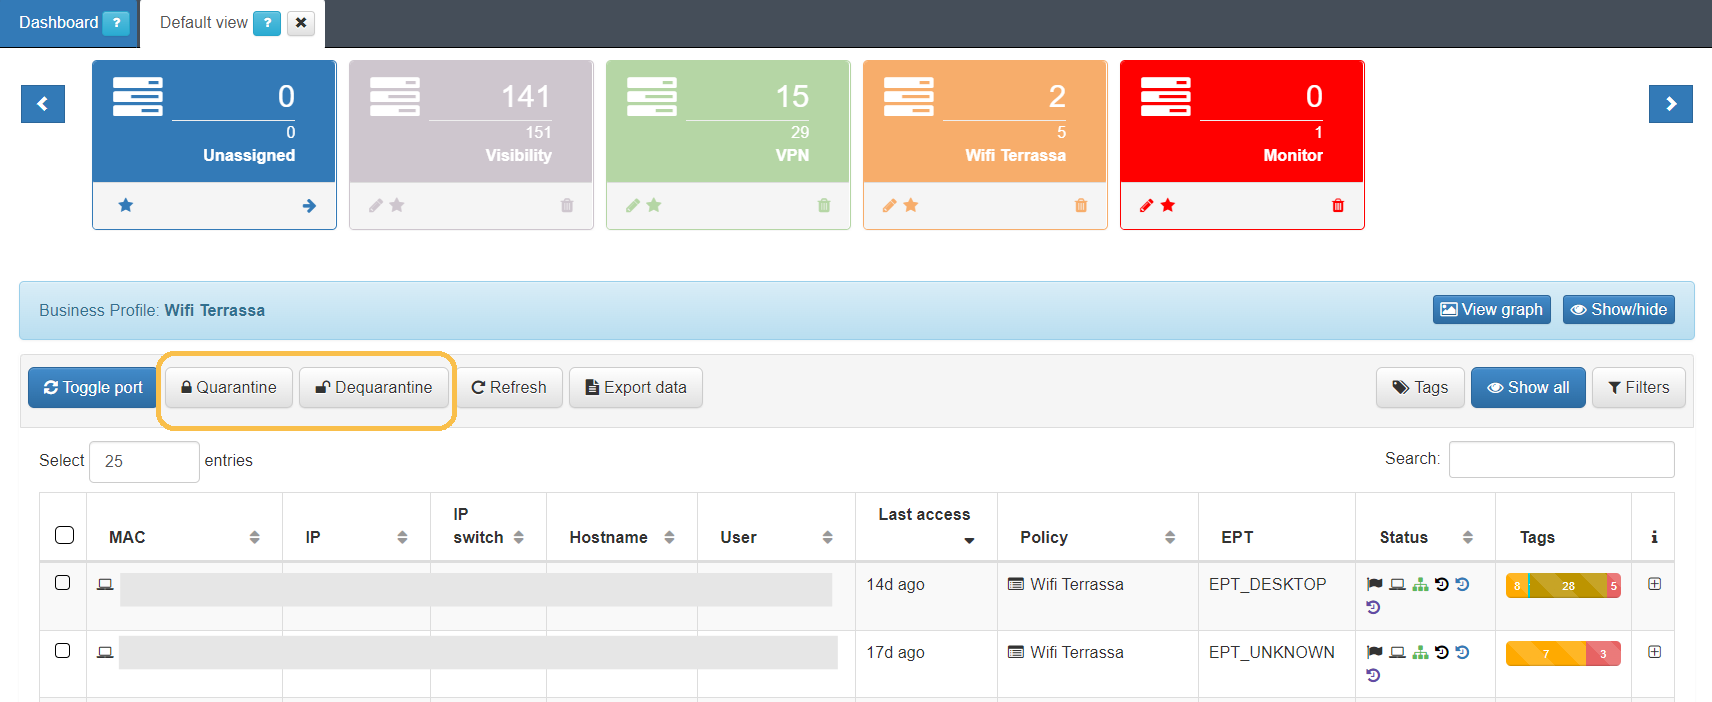
In the status column, it will appear as “User Device in quarantine”:
By expanding the device information, Profile tag group will display the “ONC_QUARANTINE” tag, indicating that this device is in quarantine.
To remove the device from quarantine, select it and click the Dequarentine button.
The correct functioning of the quarantine capability requires a correct configuration of policies “ON NAC > Policies”, where there is a policy for the group of users in quarantine.
4.2.6.3. Filtering Business Profiles
In the Business Profiles section, you can use filters to search for specific information or groups of sessions with similar characteristics.
There are two types of filters:
Filtered by Information: This filter is based on the characteristics of the sessions, including all information collected by the system during each session.
Filtered by Tag: This filter searches for specific Tags associated with devices within the Business Profiles.
Note
It is not possible to filter by information and by Tags simultaneously.
4.2.6.3.1. Filter by Information
To apply an information filter, click on the Filters button to open the drop-down menu:
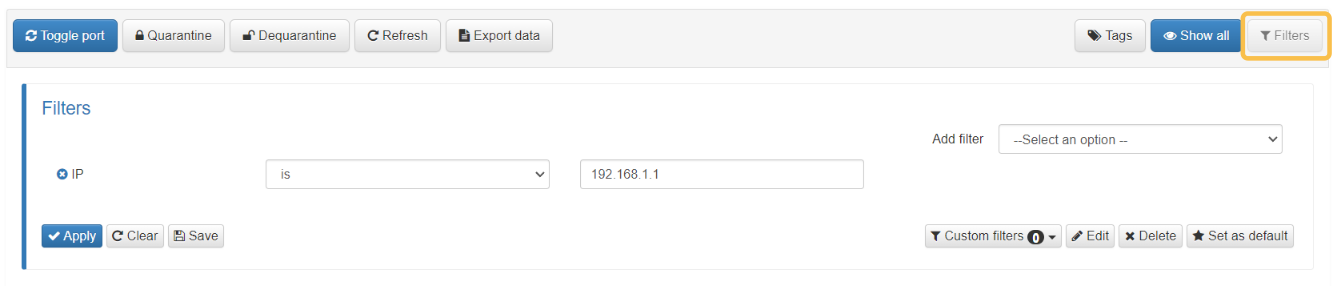
You can add multiple filters by selecting them from the “Add filter” dropdown. These filters will be combined using the AND (&&) logic, meaning all conditions must be met for the results to appear in the Business Profile table.
For each filter added, a list of filters will be displayed, allowing you to select the operator (e.g., “is,” “less than,” “starts with,” etc.) and the value you want to filter by. The available operators will depend on the type of data being filtered.
To apply the filters, click the Apply button so that the Business Profile entries are updated with the filtered data.
To remove the applied filters, click on Clear.
To save a filtering combination, click on the Save button. This filter will then become available within the Custom filters option. You can later edit, delete, or make them the default filter.
4.2.6.3.2. Filter by Tag
To apply a Tag filter, click on the Tags button to open the drop-down menu:
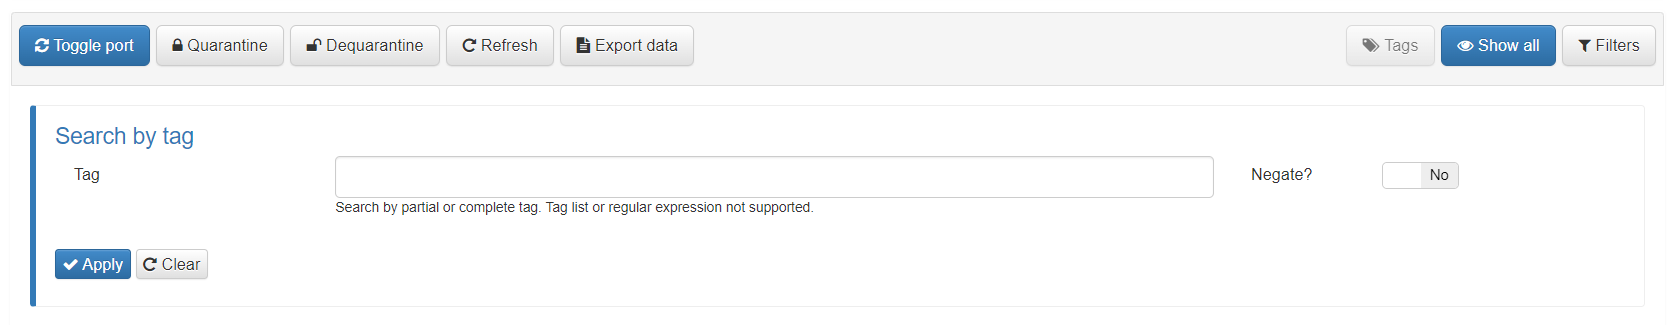
You can search using complete or partial tags. By enabling the “Negate” option, the results will display all entries that do not contain the specified tag.
Tag filtering allows the use of only one tag at a time, and regular expressions are not supported.
To apply the Tag search, click the Apply button so that the Business Profile entries are updated with the filtered data.
To remove the applied Tags, click on Clear.
4.2.6.4. Business Profiles Groups
In addition to the Business Profiles you can create within the Default view to organize your connections, you can create Business Profiles Groups, which will be available in the main menu.
Navigate to the ON NAC > Business Profiles > Business Profiles Configuration section.
This window displays all groups you have created:
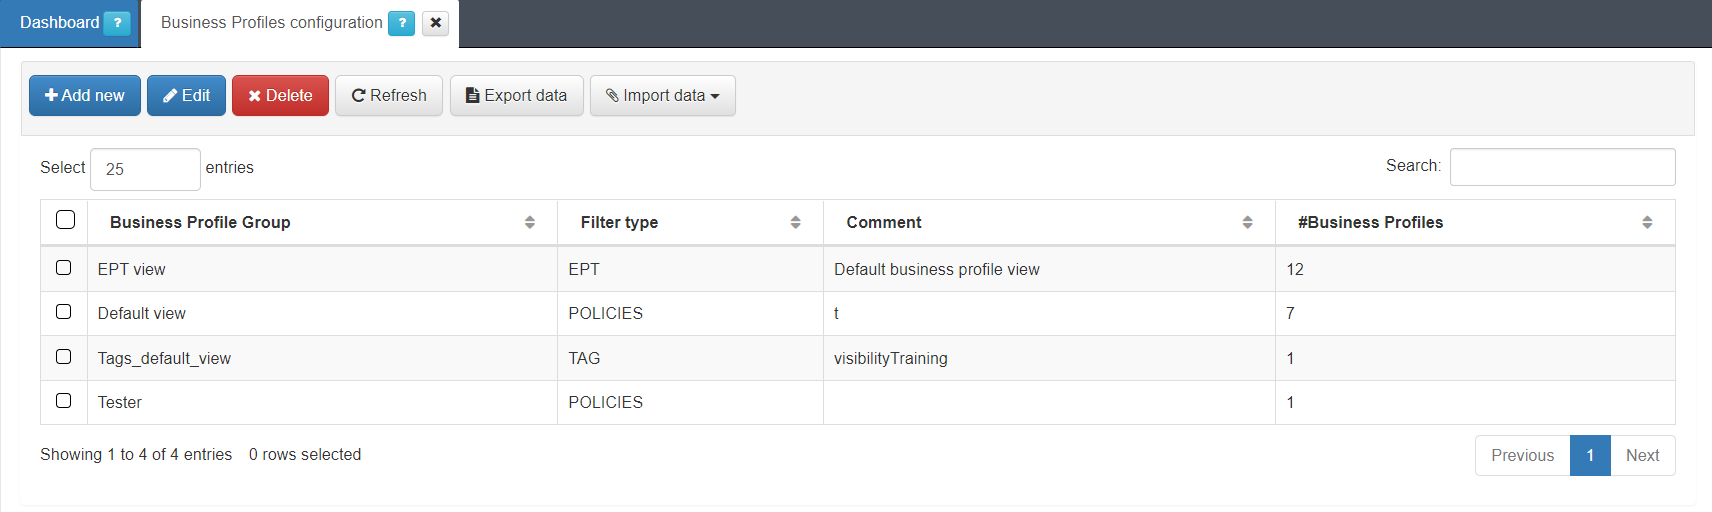
To create a new group, click on Add new to display the following window:
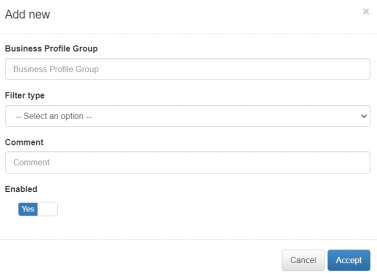
Business Profile Group: Name of the “Business Profile” group.
Filter type: Select the type of filter desired for the group.
POLICE
EPT
TAG
Comment: Description of the group.
Enabled: Flag to enable or disable the group.
Once you click Accept , the Administration Portal will reload and update the main menu to include the new group.
4.2.6.4.1. CMDB - User Devices
Navigate to ON CMDB > User Devices to access the ON Core database, which stores information related to the system, infrastructure, networks, VLANs, security profiles, user devices, network devices, and more.
In this section, you’ll find all the ‘User Devices’ that have accessed the network. This list includes all devices that have ever connected to the network and been discovered by the system.
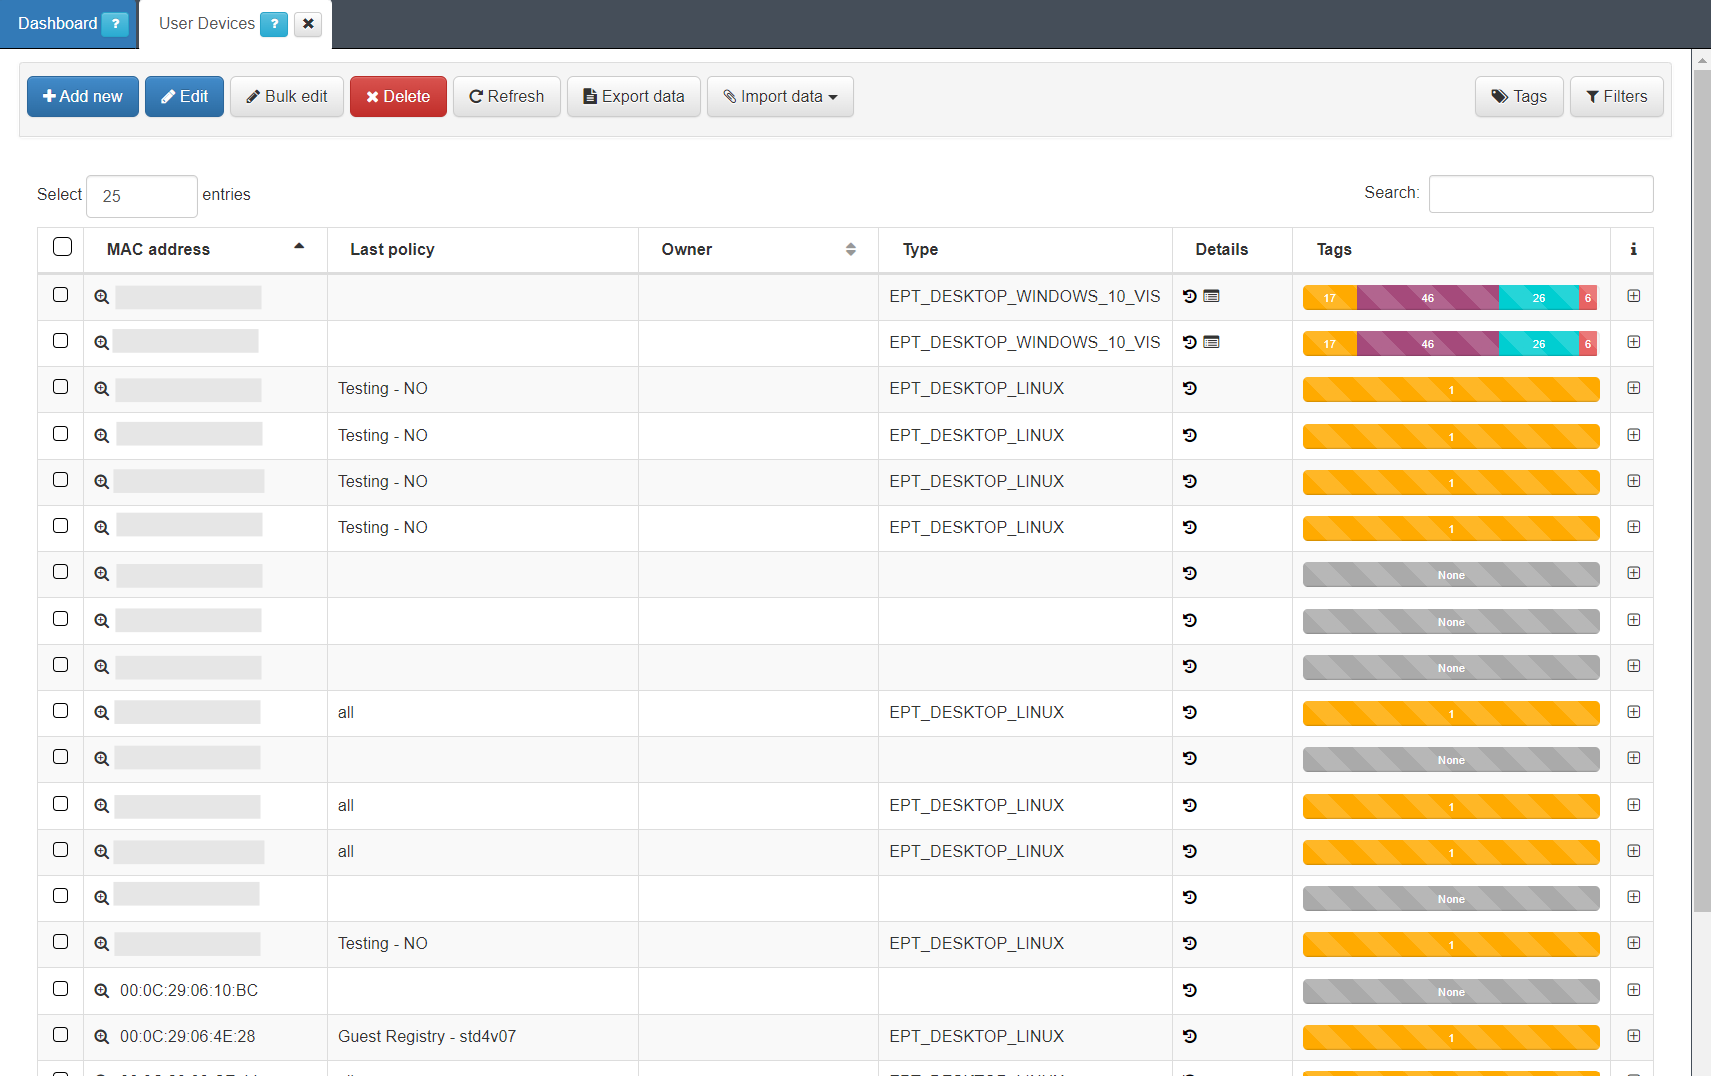
Expand the information for each user device by clicking the + icon at the right end of the device row.
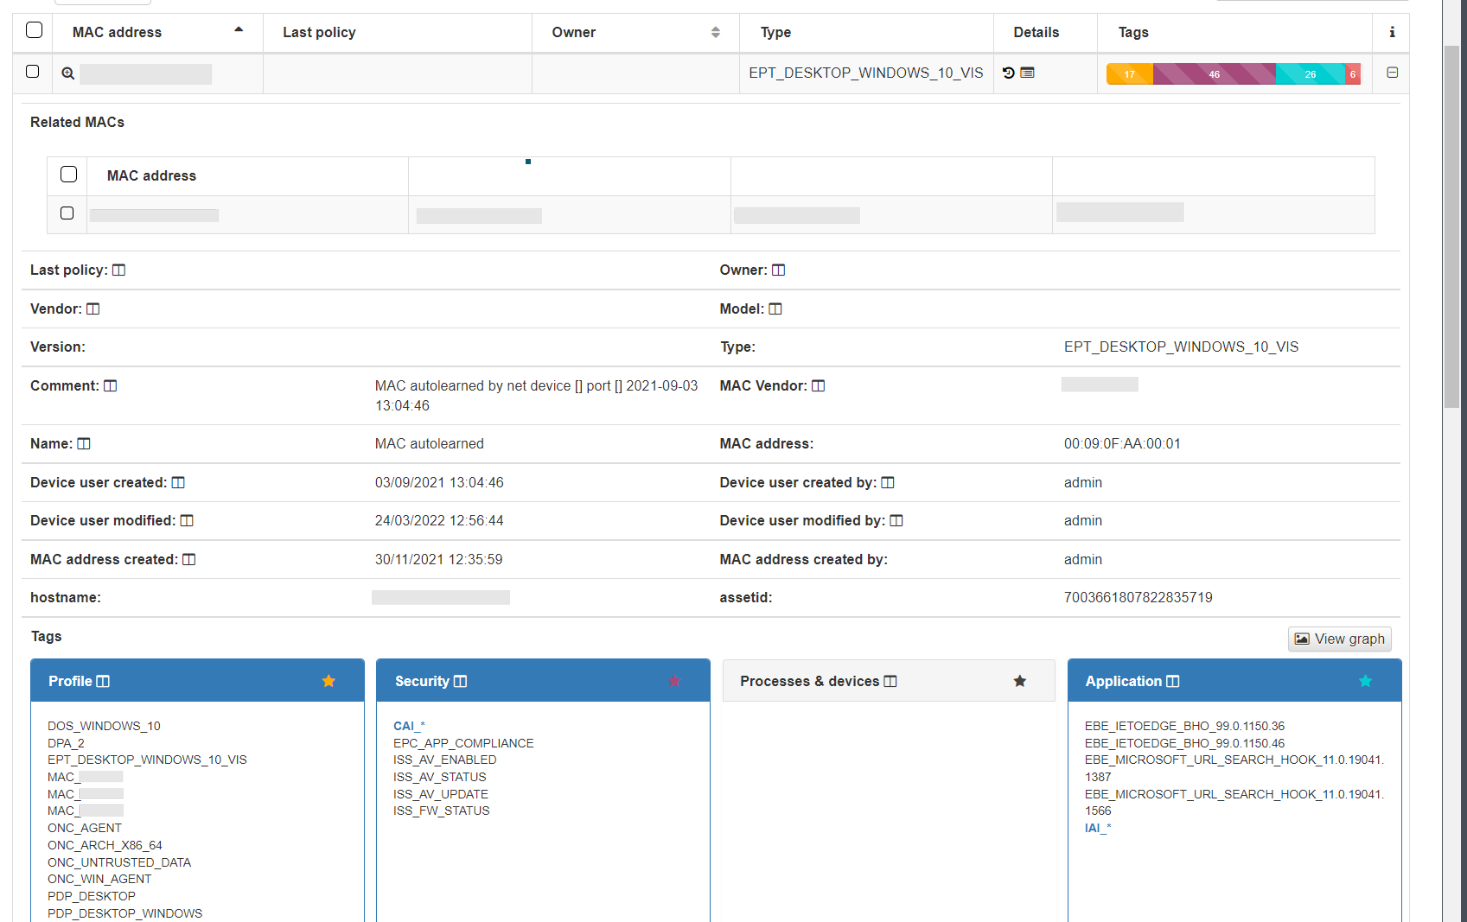
In the dropdown displaying device information, you can view basic details such as MAC address, device type, creation date, hostname, and more. This information is similar to what is available in Business Profiles, but in this case, it only includes details about the device itself, without displaying the connection status. At the bottom, you will find categorized groups showing all the Tags assigned to the device.
You can also apply filters by device information and by Tag as in the Business Profiles section.