4.3.6. Operation
This sections aims to show the workflow of the Segmentation module basic operation.
The Segmentation module allows the user to define a network segmentation and assign assets to segments based on the preconditions defined in the system policy engine (UNAC).
Note
Before proceeding with the operation section, make sure you have completed the administration configurations to prepare the system for basic operations.
4.3.6.1. Operation Overview
The Business Profiles and Policy Evaluation sections enable the performance of the following operation tasks:
Perform policy matching checks.
Verify the correct VLAN association.
Validate plugin execution.
Conduct security profile enforcement checks.
Analyze user device information.
4.3.6.2. Business Profiles
In the Business Profiles section, we will be able to see the latest status of the connections that have been made on the network and have been detected by the system. For each of these connections, we will have information related to the device and the connection itself: status, source, policy, etc.
4.3.6.2.1. Default View
In the Default View window, we see several Business Profiles, where each one of them can group the connection states depending on the policy in which they have entered. These groups are created in order to structure and organize these connections in environments where there may be many devices and connections, thus facilitating the queries in this section. There is no limitation regarding the number of Business Profiles, it is possible to have as many as necessary for the module. To access the Default View we must go to “ON NAC -> Business Profiles -> Default View”
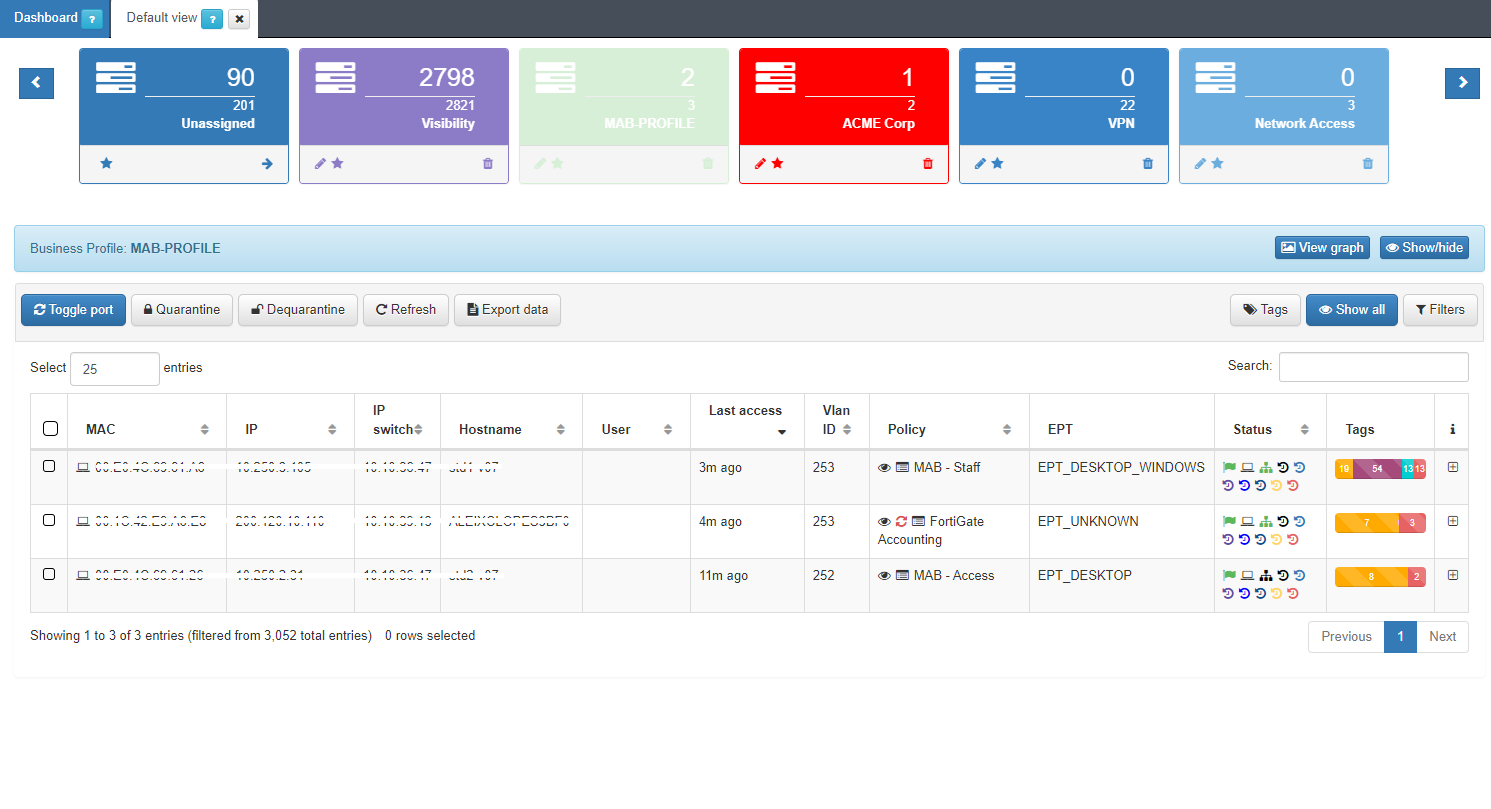
Here we can see the latest states of all those connections to the network. The information of each connection is grouped in the following columns:
MAC: MAC address of the device.
IP: IP assigned to the device.
IP Switch: IP of the switch to which the device has been connected.
Hostname: Hostname of the device in case it is discovered.
User: User with which the device authenticates.
Last Access: Time elapsed since the last event related to the user.
Policy: Policy with which the device has fallen. (Section 3.1.1)
Vlan: VLAN that has been assigned to the device by evaluating the policies.
Source: Order and type of connection source (802.1x, Visibility, VPN, etc.)
EPT: Tag* referring to the type of device (End Point Type).
Status: Status of the connection (Active/Disconnected, assigned VLAN, etc.).
Tags: Numerical representation of the Tags* assigned to the device.
It is possible to access the Sensor and Discover dashboards directly with a filter of the device’s MAC by pressing the icons in the status column for each of the devices.
We can obtain more detailed information on each of the connections For this, we must click the + button at the right end of the row that we want to expand.
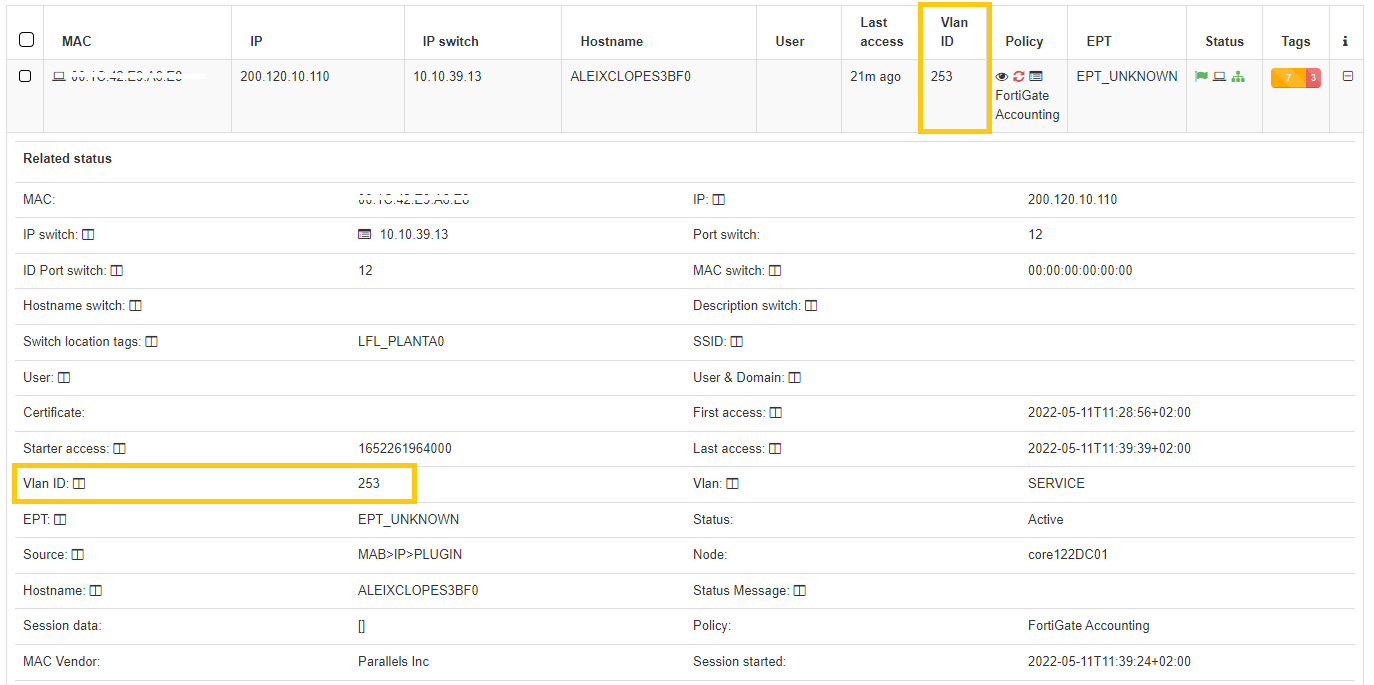
In this drop-down section, we can find all the information related to the device and the connection that has been made. We can also check if the VLAN has been correctly assigned to the user device.
At the top we find all the basic information of the connection, Mac, Hostname, User, policy, connection source, etc.
At the bottom we find the Tags*, which are labels that are assigned to the devices to provide us with information about them. These tags are classified by families represented by three letters at the beginning of the Tag followed by an “_” and the specific characteristic. For example, the Tag “ROS_WINDOWS” indicates a Root Operating System of type Windows.
We can find all the existing Tags and their description in Tags Table.
Based on the previous classification of the Tags, these are segmented into blocks and give us relevant information in relation to the device. These blocks are:
Profile: Profiling tags, device type, operating system, system information, etc.
Security: Tags related to device security such as antivirus or firewall information.
Processes: Processes that are running on the device.
Application: Information about the applications installed on the device, as well as the versions
Network: Network information such as open ports.
Custom: Custom tags.
Other: Other tags with important information, for example, IP obtaining mode (IPT_DHCP).
To improve the information we obtain from the devices, it is possible to implement the Visibiliy module, this will help us obtain more information about the network and its devices. All the fields contained in a Business Profile entry contain the icon “column”, clicking this field will add it as a column to all Business Profile entries.
4.3.6.2.2. Policy evaluation details
For each of the entries in the list of Business Profiles we can find the “eye” icon in the Policy column.
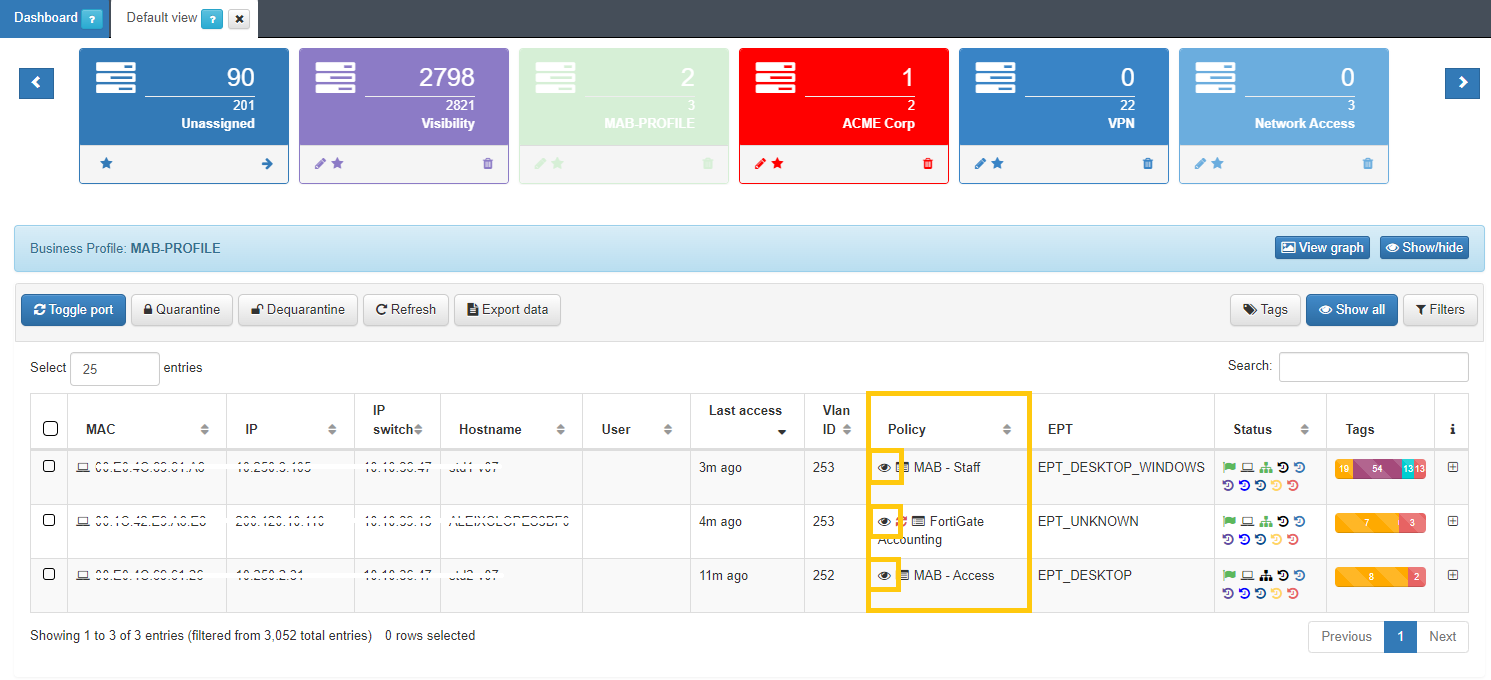
By clicking this icon, a new window will open. In this window we will find all the information related to the evaluation of policies for each of the events generated in the system. On the left side we find the last ten registered events. The initializing events, that is, those that will cause a policy evaluation (for example, authentication events such as 802.1X or MAB) will appear in blue.
In this case, we can use this functionality to check if the plugin that we have configured on the policy has been correctly executed.
Params received: Parameters that are obtained from the event received in the system. This information includes the MAC of the device (mac), the type of event (source), IP of the switch from which it is received (switchip), etc.
Params processed: These parameters correspond to the information that has been processed by the system and will be stored. This includes information received externally as well as information generated internally, such as device TAGS.
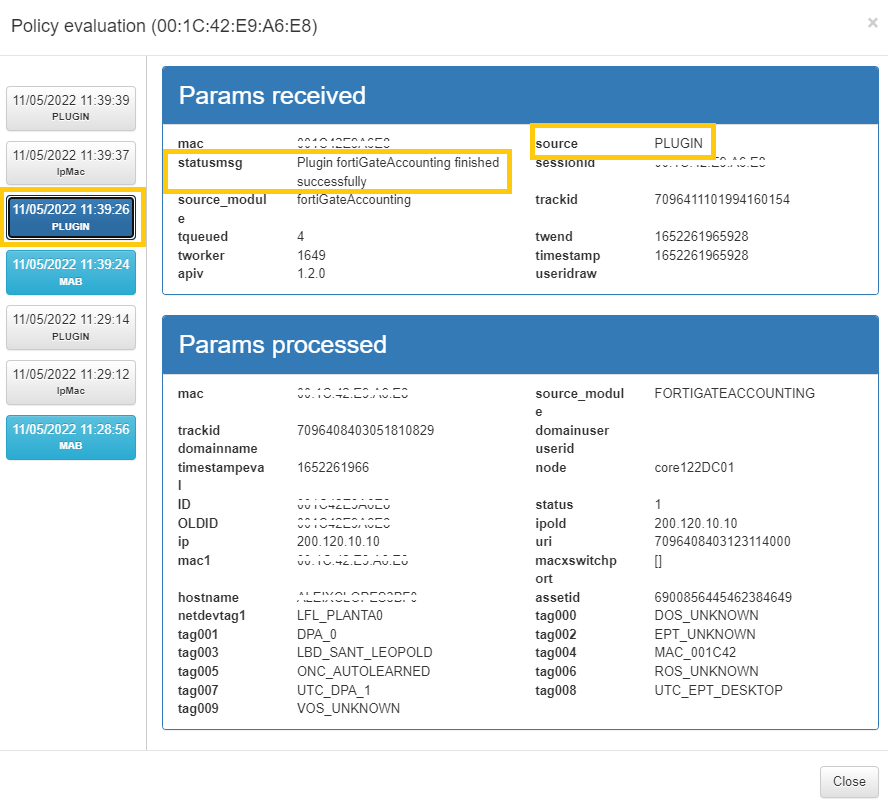
In this case we configured the fortiGateAccounting plugin, so we can see that we have a source event PLUGIN and source_module: fortiGateAccounting , if we click on it, we can see all the information regarding to the event. We can see all the data that the plugin has processed and we see the result in the statusmsg: Plugin fortiGateAccounting finished successfully.
Evaluation: The policy evaluation flow is shown here. Following the order defined in policy creation, the preconditions are evaluated to determine whether or not it should fit the policy. For each evaluated policy, the first precondition that discards it will be shown (in red) until reaching the policy to which it matches. There are events that do not generate a policy evaluation, so this section will not be displayed.
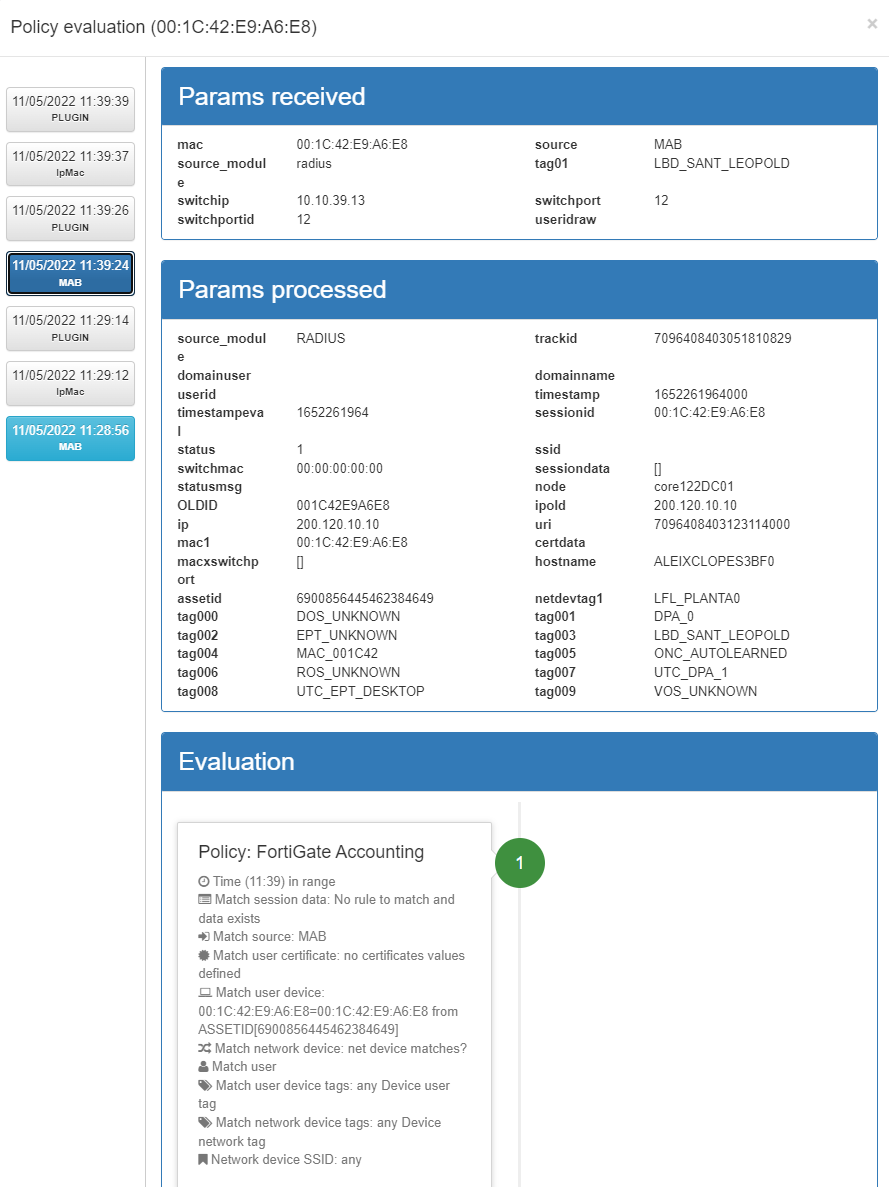
The information that this window offers us is useful to understand why a device is entering a specific policy, and to be able to see the parameters received in order to make the necessary adjustments to the policies.
4.3.6.3. CMDB - User Devices
The CMDB is the ON Core database, in this database we find information related to the system, infrastructure, networks, VLANs, Security Profiles, user devices, network devices, etc. In this section we will find all the “User Devices” that have accessed the network.
To access this section, go to “ON CMDB -> User Devices”. Here, we will find a list with all those devices that have ever been connected to the network and have been discovered by the system.
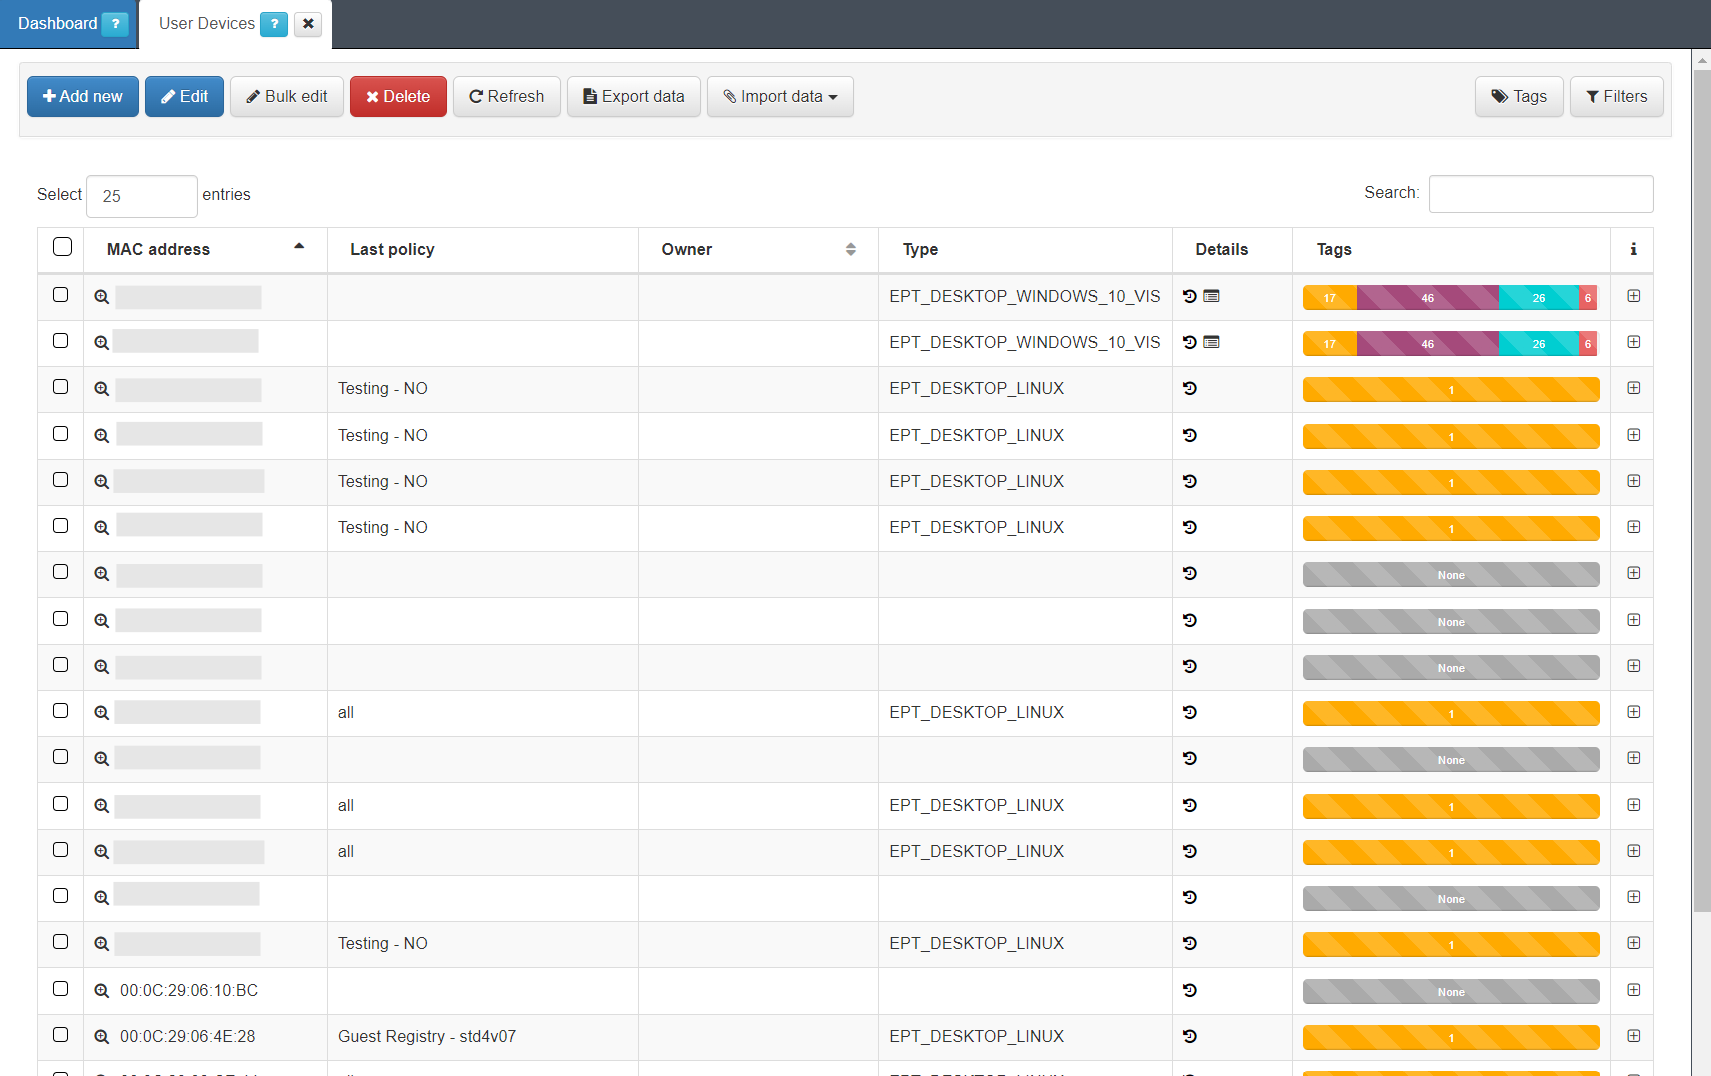
Each of the columns tells us certain information about the device. We can expand this information by clicking the “+” on the right end of each of the devices row.
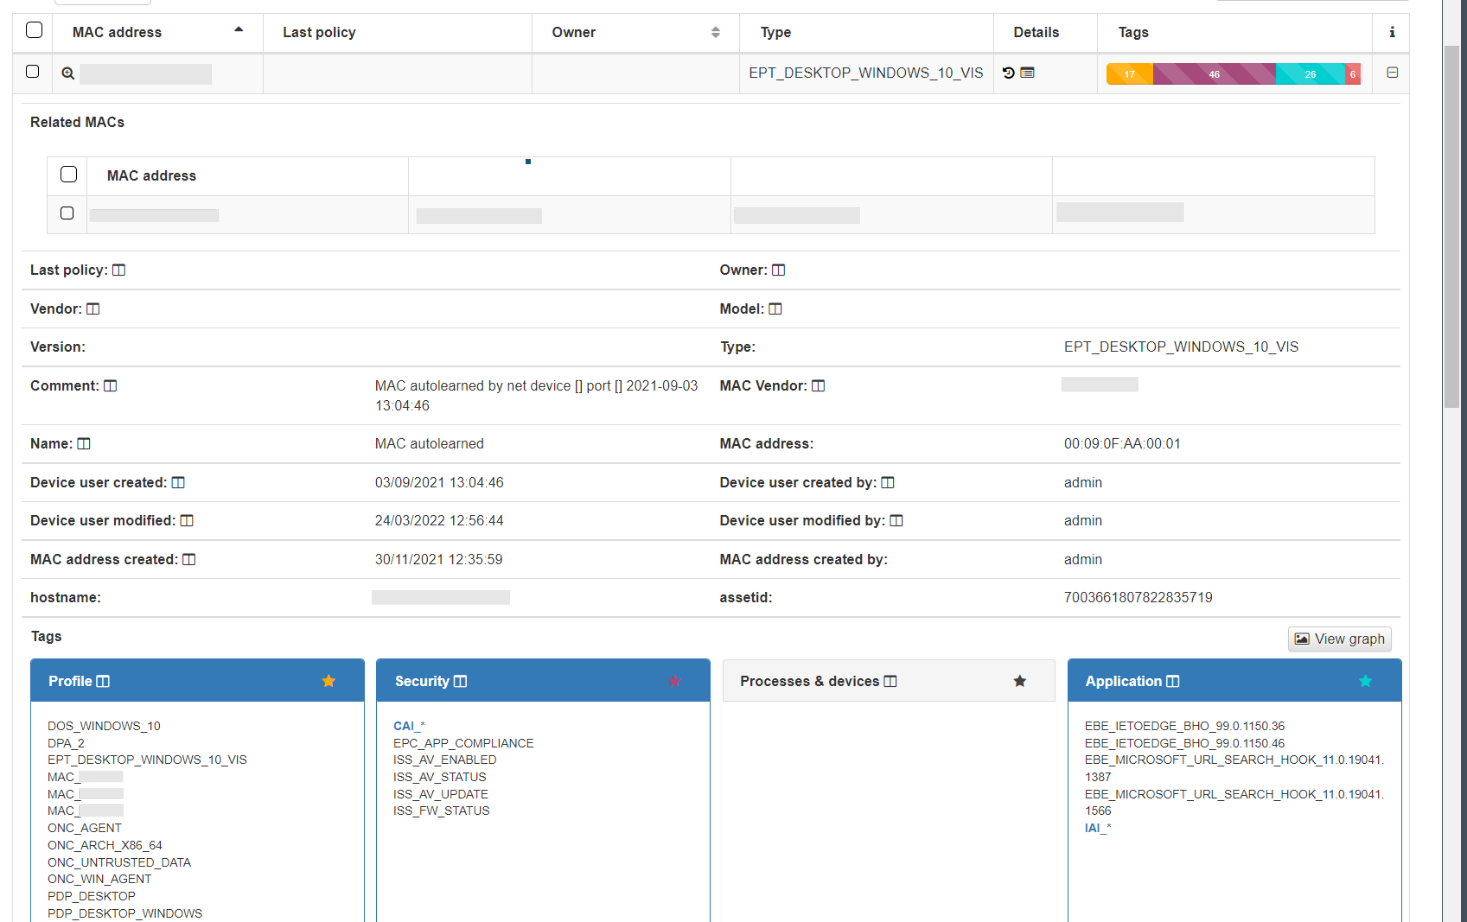
In the dropdown with the device information, we can see the basic information, MAC, Type, creation date, Hostname, etc. This information is similar to what we can have in the Business Profiles, but in this case, information about the status of the connection is not displayed, only information related to the characteristics of the device. At the bottom, we find the blocks, sorted by categories, where all those Tags* assigned to this device are specified.
4.3.6.4. Security profiles enforcement check
Even with all the information displayed on the business profile and in the policy evaluation windows, we will not be able to check if the ACLs that we have created or assigned in the policy are accurately applied to the user device or transmitted to the network device for implementation.
To determine if they have been correctly applied, we can employ the following methods:
Inspect the network device to see whether the ACL configured in the policy has been applied to any of the network device ports.
Use the user device to check if the restrictions have been applied correctly.
Check the RADIUS logs to see if the rules are being correctly sent to the network device as RADIUS authorization parameters. For more help, check the Troubleshooting section.