4.3.7. Monitoring
With all the information related to the Segmentation network module that the system collects, it generates dashboards so that this information can be read and interpreted quickly and easily by the user. As a large volume of data of different types and sources is generated, different dashboards have been defined that group this information through graphs and tables.
All Dashboards have filters that allow us to define what parameters to show and what time period of the data will be used to generate said dashboards. Keep in mind that, if in the indicated period of time there has been no update on a specific device, through an event, this device will not appear.
4.3.7.1. Segmentation Overview
The Segmentation Overview displays all the events related to the segmentation use case. These events are categorized in three different windows:
4.3.7.1.1. Header
The three available views in the Segmentation Overview section show different information. However, they have a common header, which refers to a consistent section at the top of each view that contains shared information.
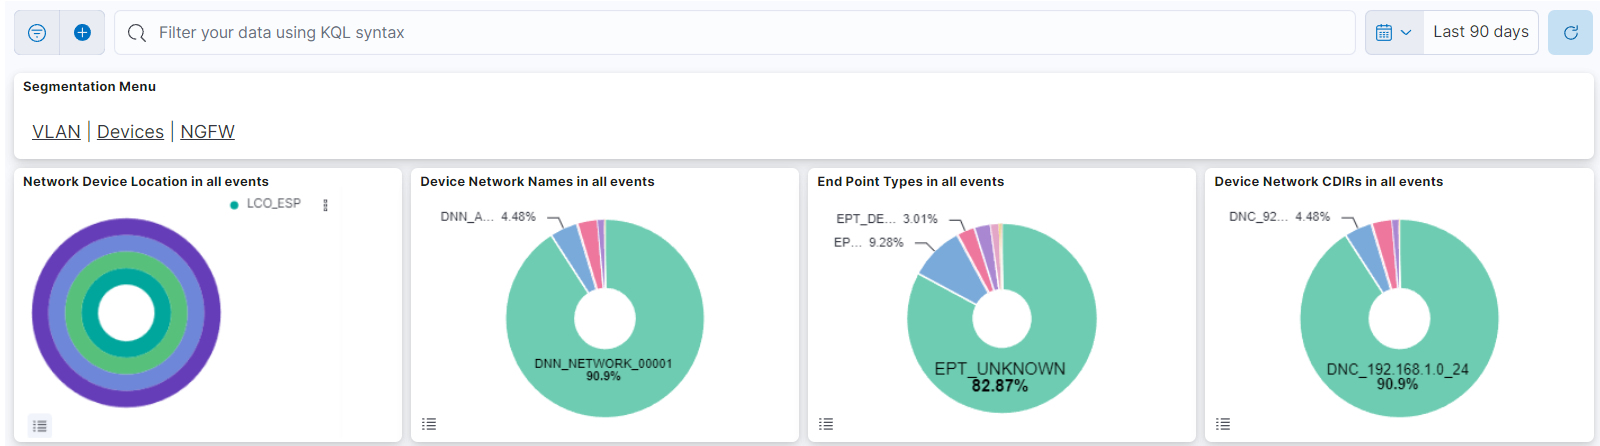
Menu
The menu features different windows: VLAN, Devices, and NGFW (Next-Generation Firewall). Each window offers distinct dashboard views, allowing you to navigate between these sections. The following topics will explore these menu options in detail.
This header composed of four dashboards allows filtering by Network Device Location, Device Network Name, Device Network CDIRs, Endpoint Types. It will always look for the temporary index that is regenerated every day. In this toolbar, filter your data using KQL syntax.
4.3.7.1.2. VLAN
The VLAN window displays information about the VLANs and its users and devices.
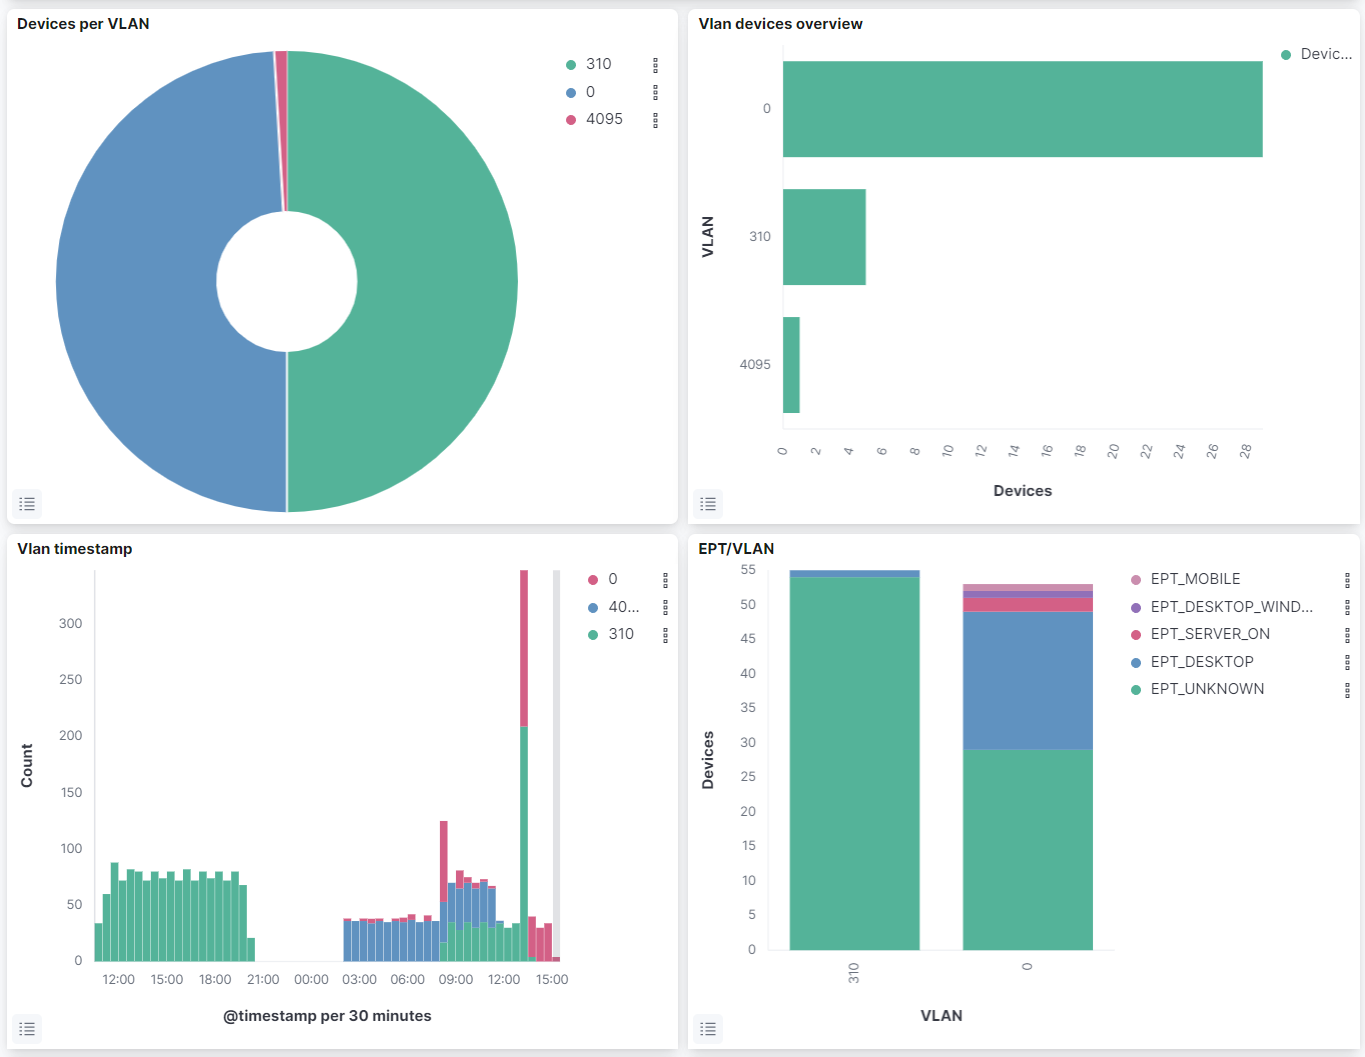
Devices per VLAN: Represents the percentage of devices per VLAN.
VLAN devices overview: Shows the different VLANs with the event count.
VLAN timestamp: Shows the VLAN devices events, separated by VLAN on a timeline.
EPT/VLAN: Shows the different VLANs with the event count for each one, separated by the endpoint type.
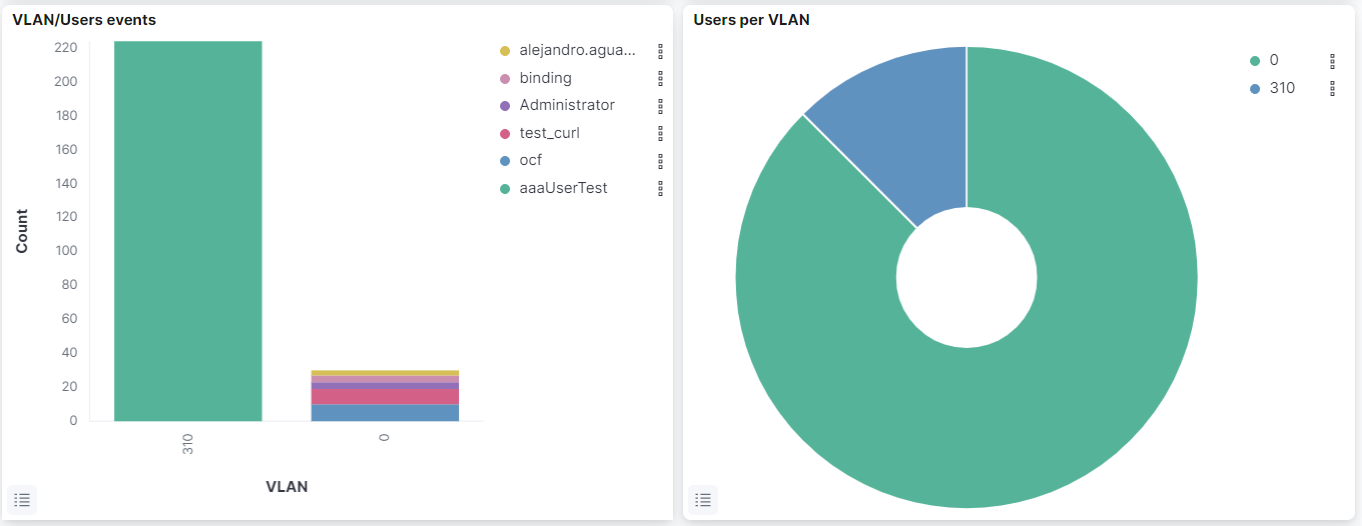
VLAN/Users events: Shows the different VLANs with the event count for each one, separated by the users.
Users per VLAN: Represents the percentage of user per VLAN.
4.3.7.1.3. Devices
The Devices window displays information about the network devices authentications and the ACLs.
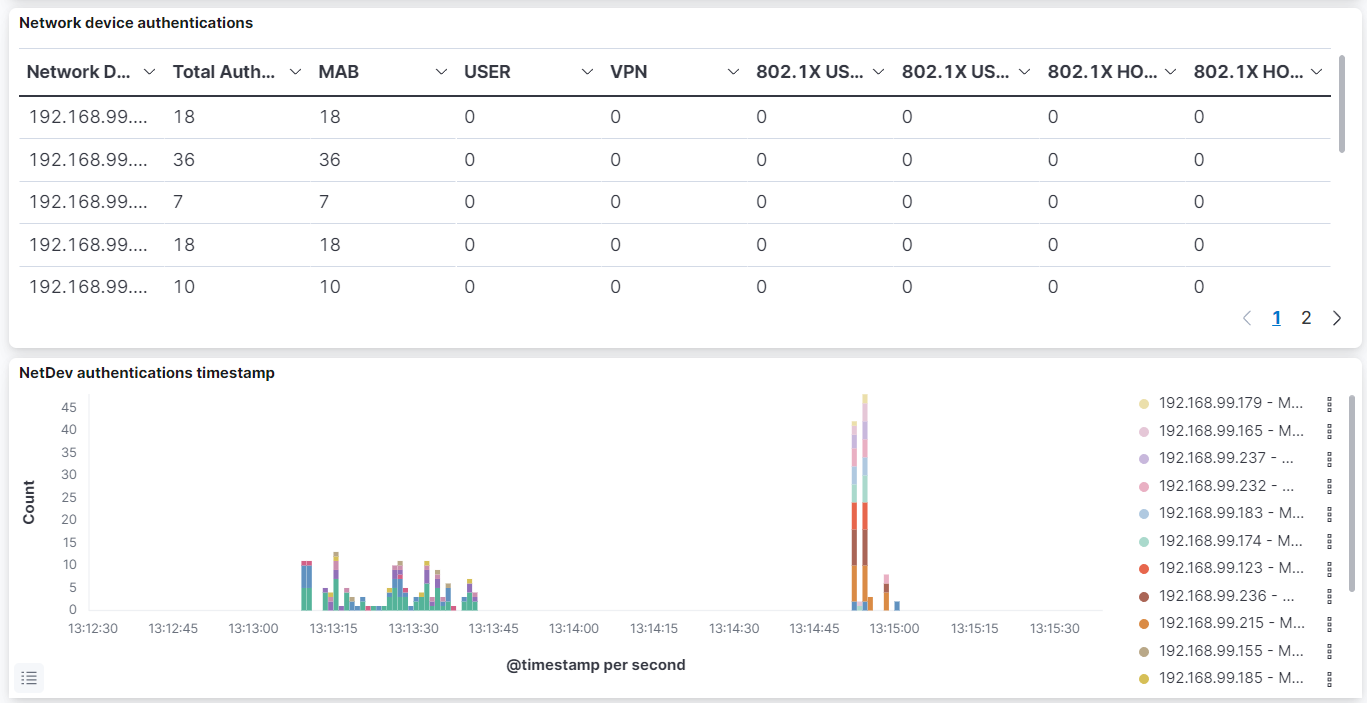
Network device authentications: Shows a table with the network device authentications. In this table, the network device IP is represented, as well as the total of authentications, the MAB authentications, the USER authentications, the VPN authentications, the 802.1X USER authentications, the 802.1X USER CERT authentications, the 802.1X HOST authentications and the 802.1X HOST CERT authentications.
NetDev authentications timestamp: Shows the network device authentication events, separated by network device IP and authentication type on a timeline.
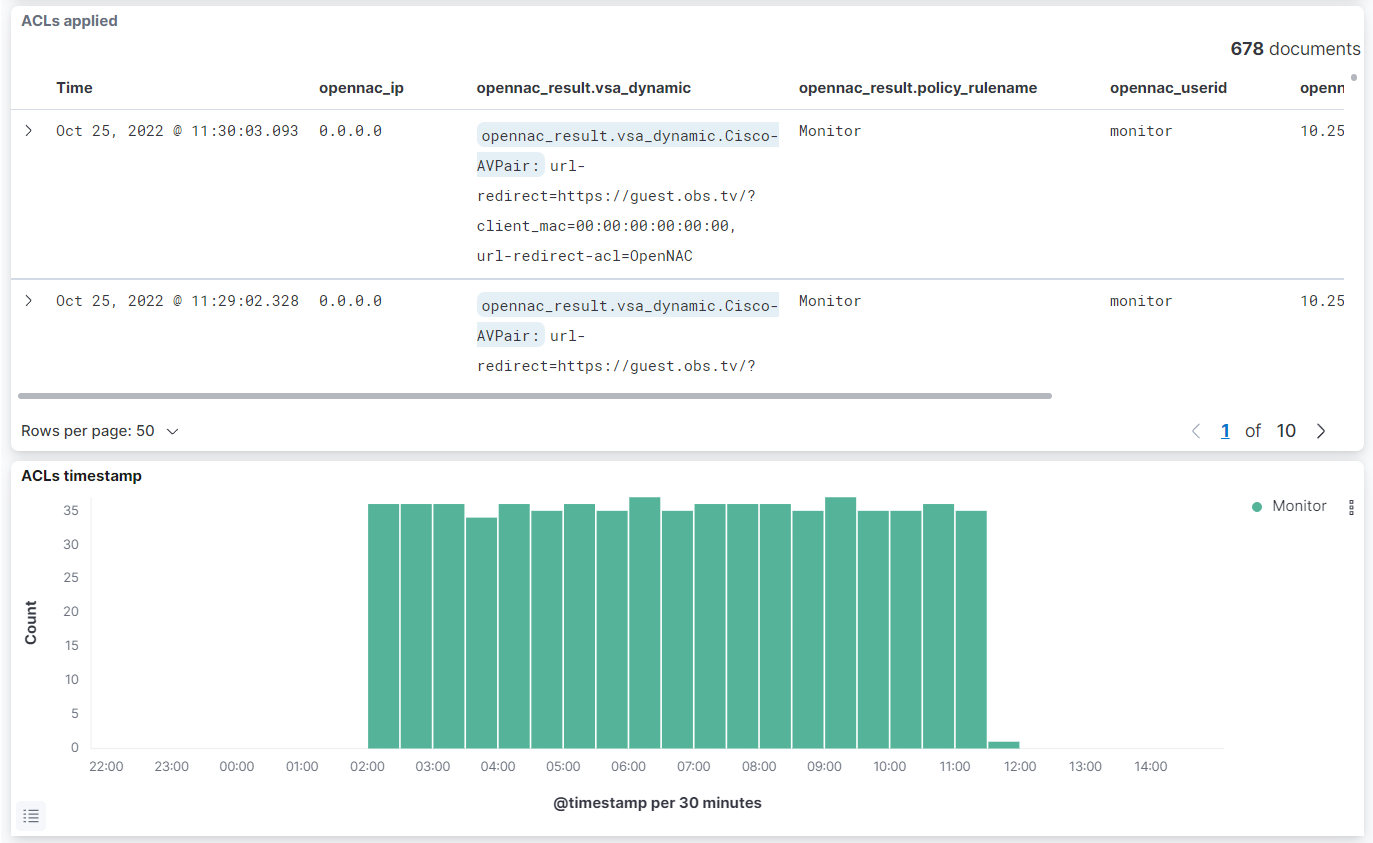
ACLs applied: Shows a table with the ACL events. In this table, the timestamp is represented, as well as the user device IP, the ACL matched, the policy passed, the user ID, the network device IP and the vlan assigned.
ACLs timestamp: Shows the ACLs events, separated by policy matched on a timeline.
4.3.7.1.4. NGFW
The NGFW window displays information about the Next-Generation Firewalls, which are FortiGate and PaloAlto.
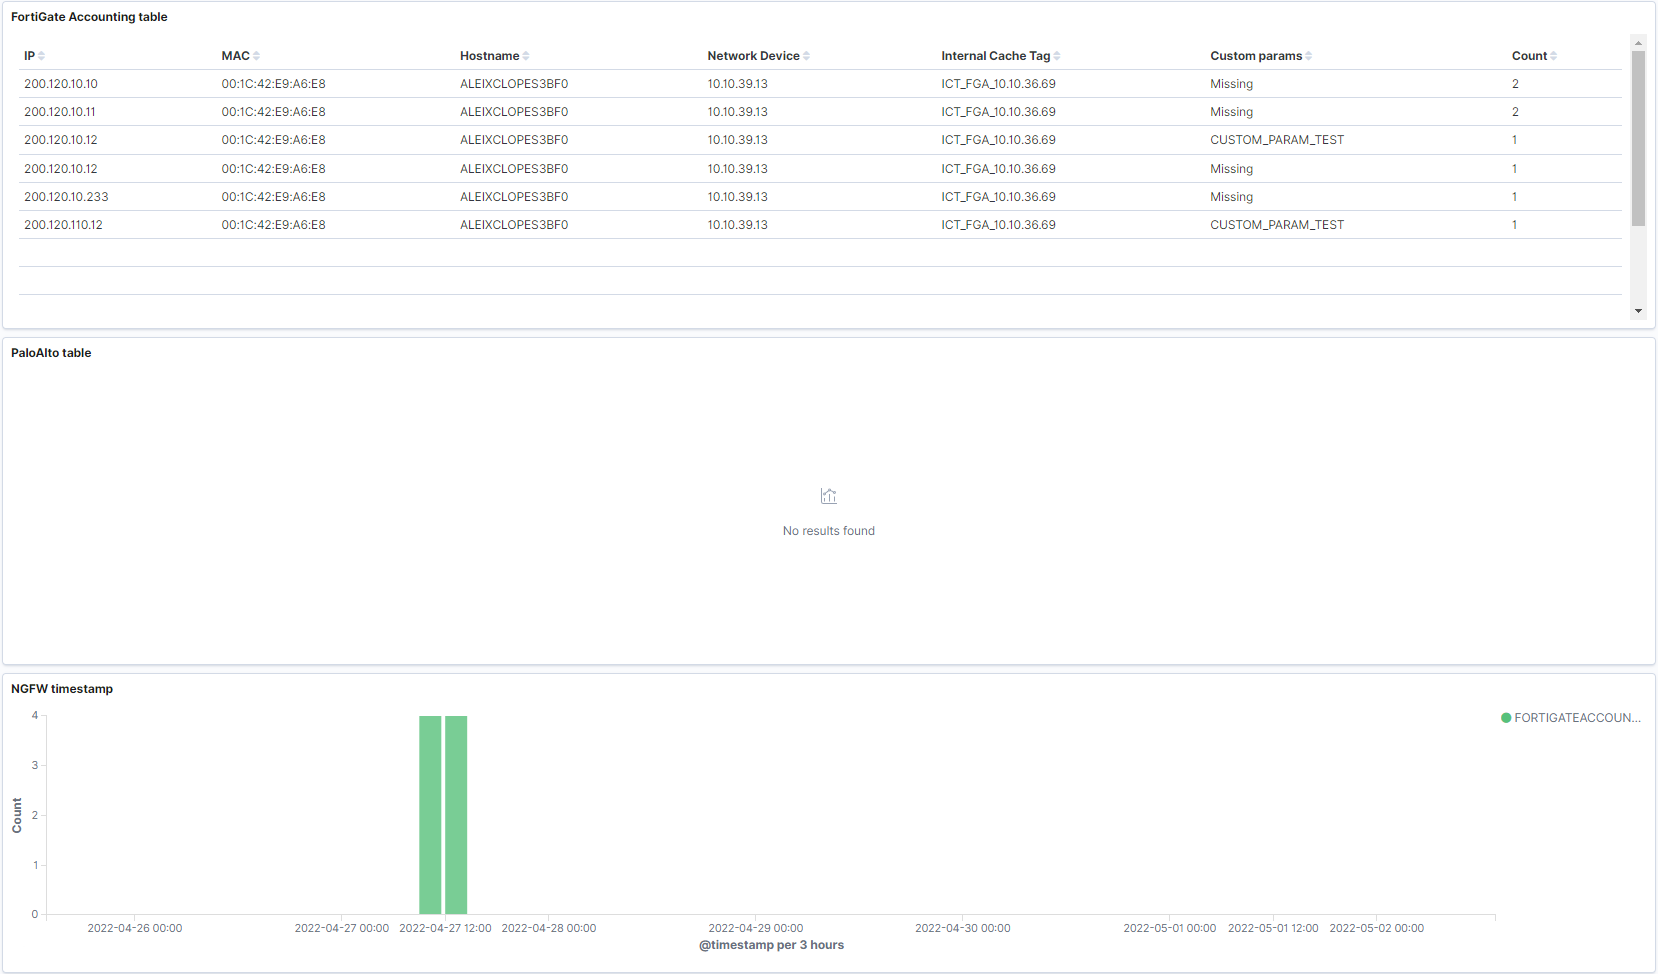
FortiGate Accounting table: Shows a table with the FortiGate events. This table represents, the user device IP, as well as the user device MAC, the hostname, the network device IP, the internal cache tag, the custom parameters and how many times this event is repeated.
PaloAlto table: Shows a table with the PaloAlto events. This table represents the user device IP, as well as the user device MAC, the hostname, the network device IP, the PaloAlto tag, the custom parameters and how many times this event is repeated.
NGFW timestamp: Shows the next generation firewall events, separated by PaloAlto and FortiGate on a timeline.
4.3.7.2. Segmentation Metrics
The Segmentation Metrics dashboard displays information about RADIUS requests. We can see the following views on this dashboard:
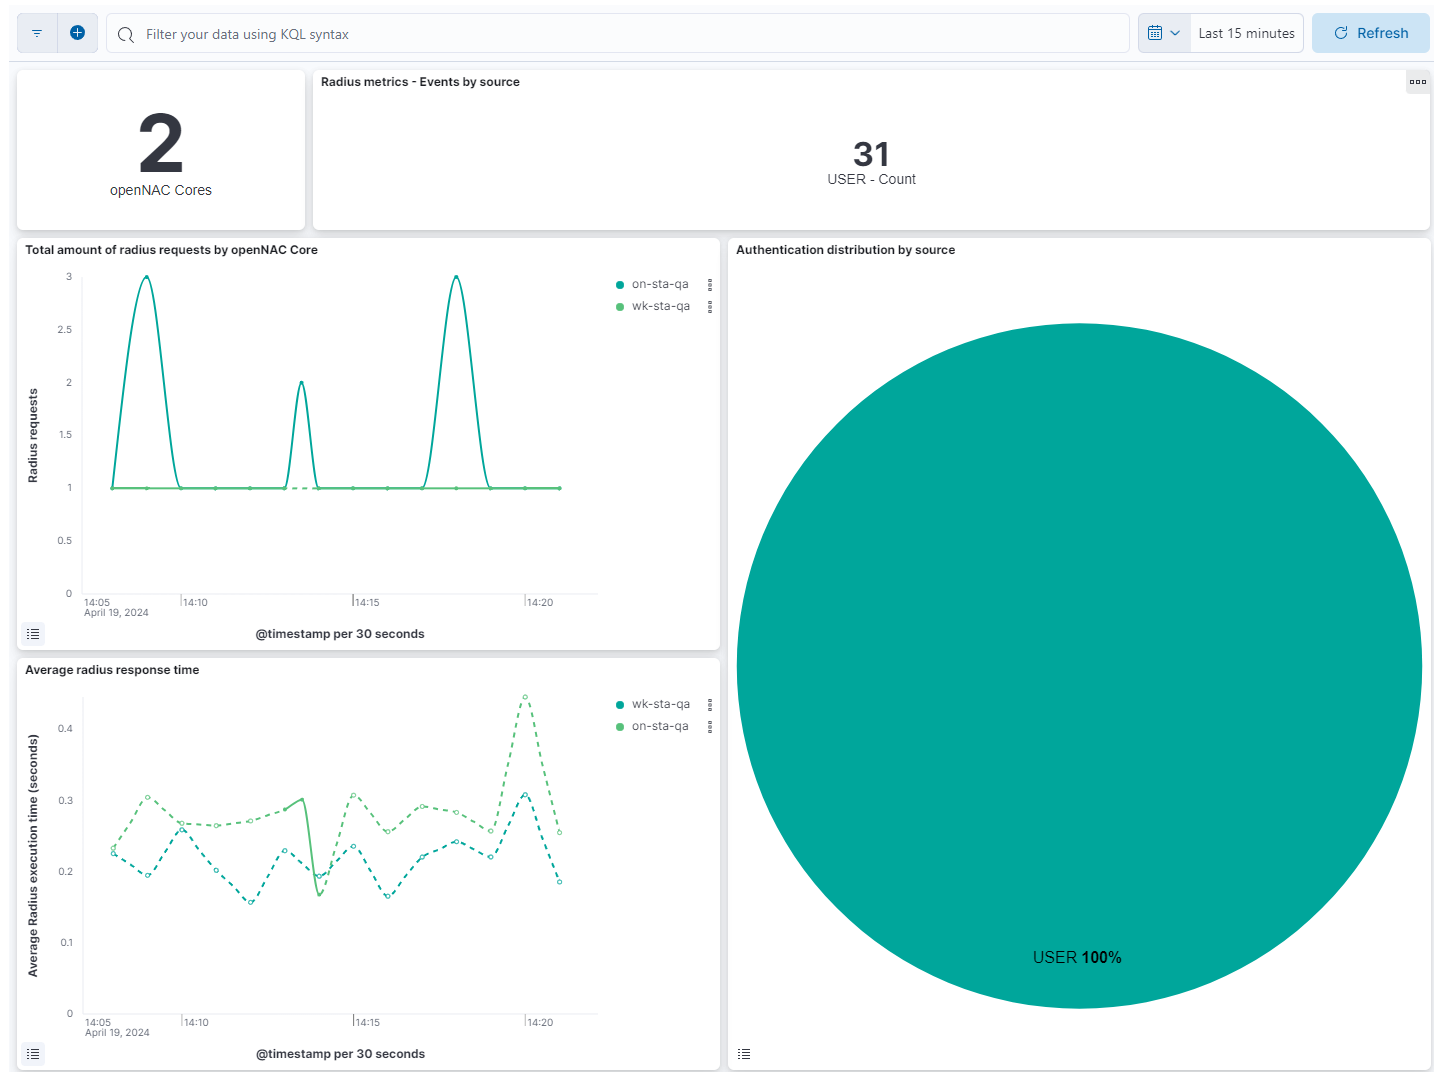
openNAC Cores: Shows the number of openNAC cores.
Metrics - Events by type: Shows the number of each openNAC source.
Total amount of radius requests by openNAC Core: Displays the total radius events for every host on a timeline.
Authentication distribution by type: Represents the percentage of the different radius sources.
Average radius response time - Seconds: Displays the average of execution time for radius events for every host on a timeline.
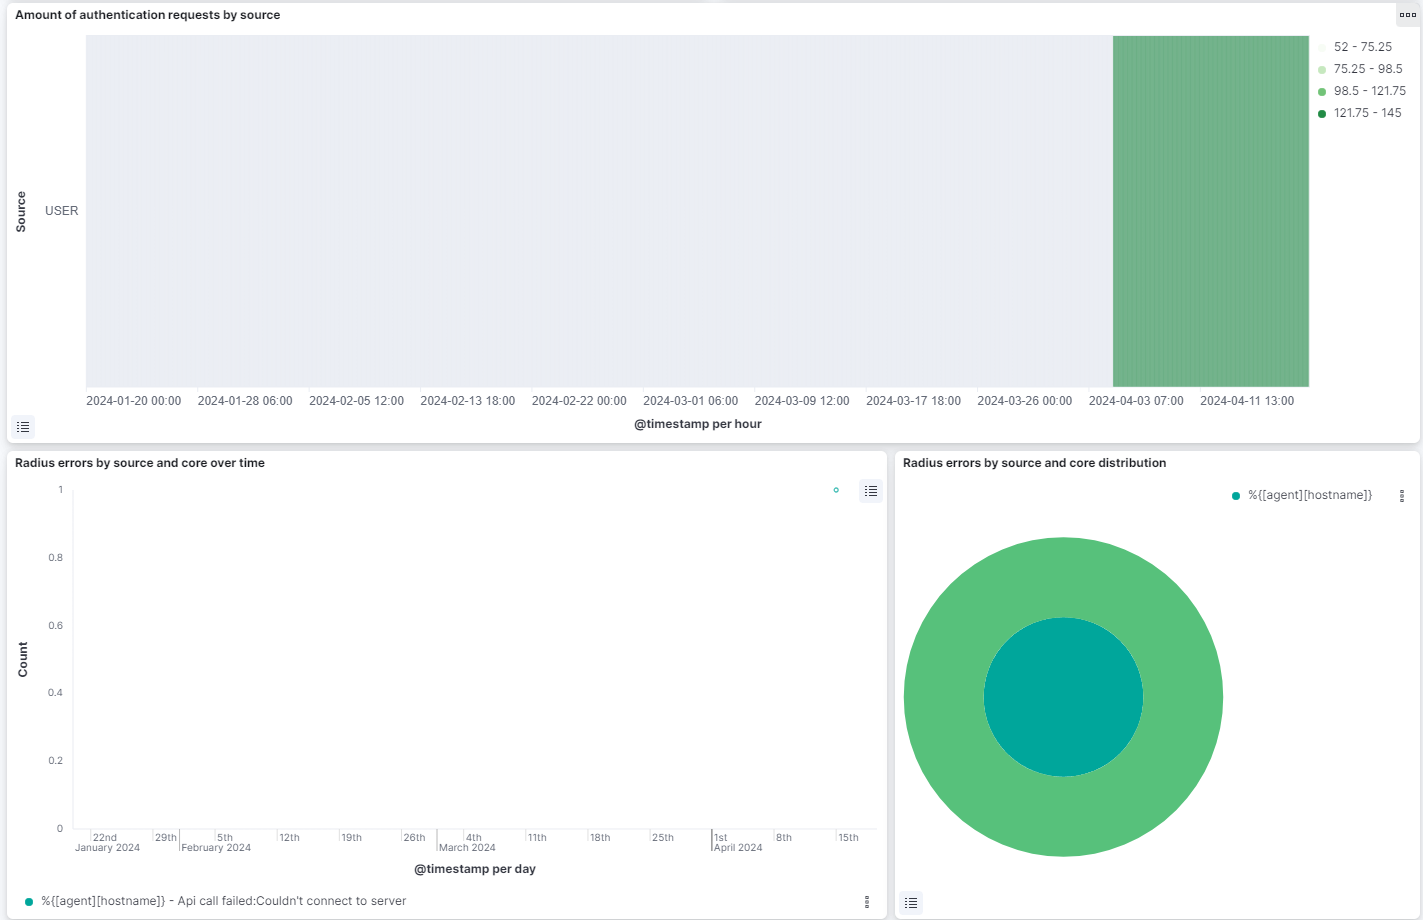
Heat Map - Amount of authentication requests by type: Shows a heatmap relating the radius source with hourly radius events count.
Radius errors by type and core over time: Displays the total radius events with error separated by the host and the error message type on a timeline.
Radius errors by type and core - Pie: the internal pie represents the percentage of hosts. The external pie represents the percentage of the radius error message types.
You can also navigate to Administration Portal > Analytics > Segmentation to find information about the dashboards available for this use case.