5.2.3.2.1.2. SNMP Traps
For troubleshooting the SNMP traps we need to check the following:
5.2.3.2.1.2.1. Switch
Check that the SNMP packets have been generated by the switch:
debug snmp packets
show debbuging
terminal monitor
Connect and disconnect a device to switch port and check the switch console.
5.2.3.2.1.2.2. ON Core
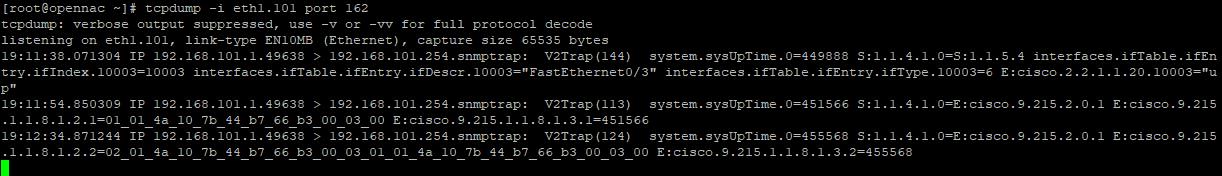
Using tcpdump command, check if the SNMP traps have been received by the ON Core.
tcpdump -i eth0 port 162
Check if the SNMP trap service is up and running.
service snmptrapd status
If is not running start it.
service snmptrapd start
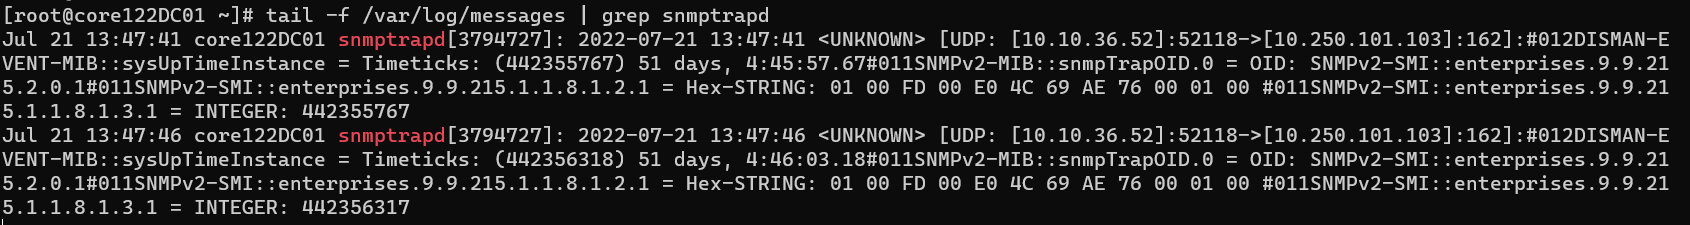
Go to /var/log/messages, check if the log file has been written, and check the timestamp of SNMP trap log
tail -f /var/log/messages | grep snmptrapd
Check if the gearmand queues service is up and running.
service gearmand status
If is not running start it.
service gearmand start
Go to /var/log/opennac, check if the opennac-job.log file has been written.
tail -f /var/log/opennac/opennac-job.log | grep -i snmp
Go to /var/log/opennac-poleval.log and check if the OpenNAC Enterprise poleval events file has been written with a SNMPMacUp or SNMPMacDown.
tail -f /var/log/opennac/opennac-poleval.log
Go to /var/log/httpd/opennac-*_log and check if OpenNAC Enterprise http/https events file has been written.
<MAC ADDRESS> identify the physical address, verify the response http code, you can verify some API error like database issue or similar.
tail -f /var/log/httpd/opennac-*_log | grep -i <MAC ADDRESS>
In the Administration Portal, go to Operate > NAC > Sessions.
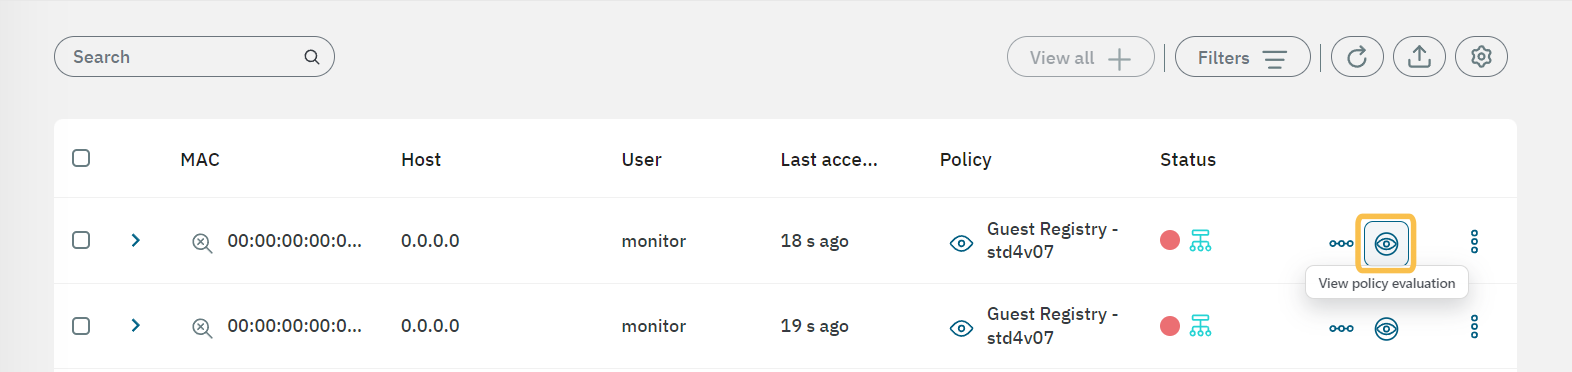
Click on the eye icon to open “view policy evaluation” and verify the MAC address.
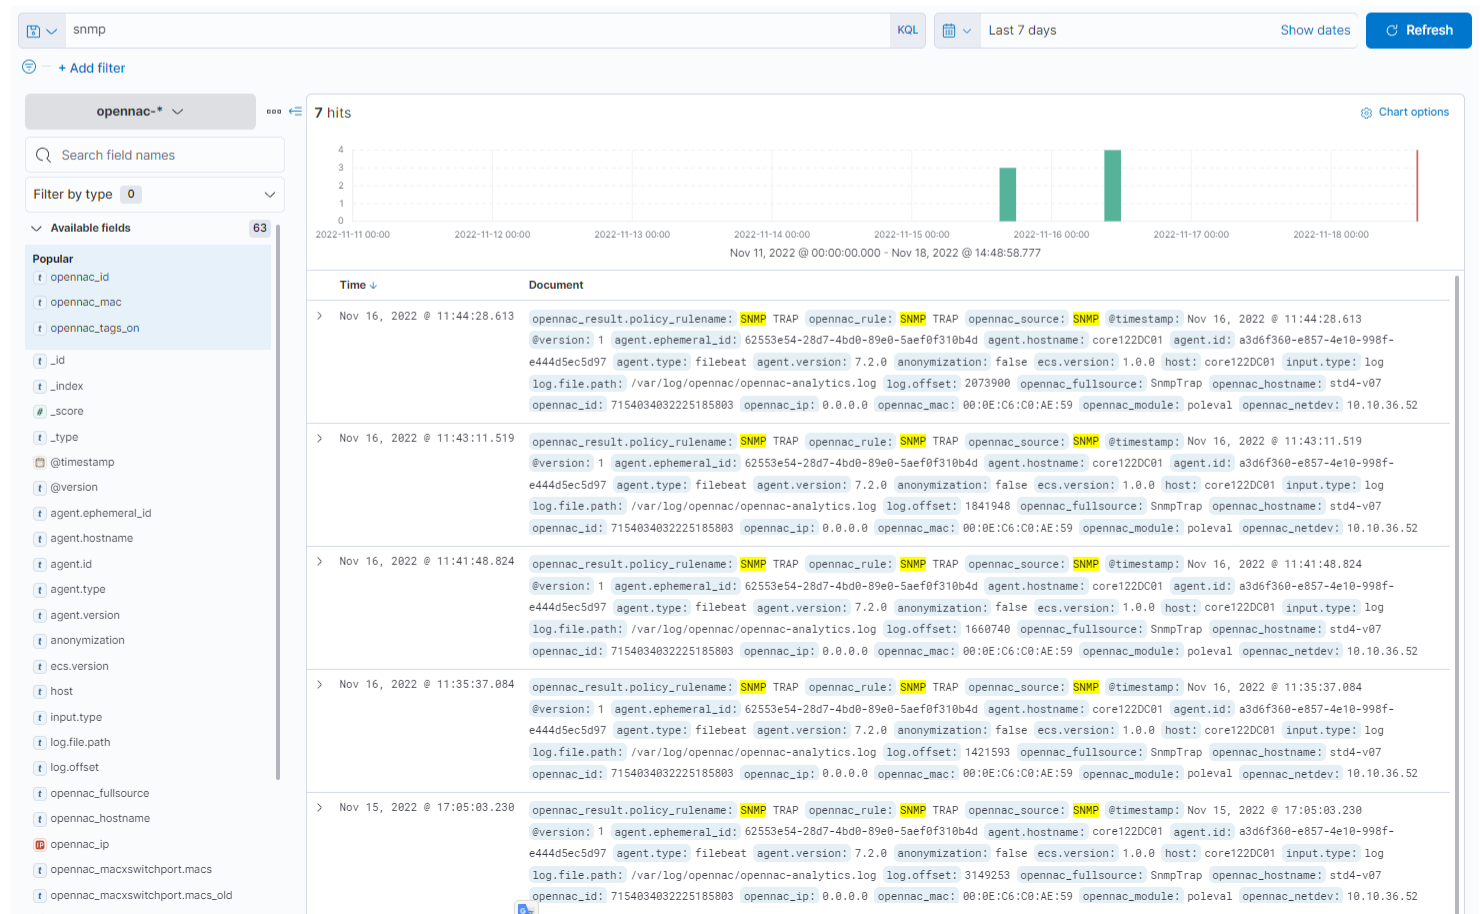
The log that contains the information printed in the Analytics > Discover option is collected in the file opennac-analytics.log. You can check this log executing the following command in the ON Core CLI:
tail -f /var/log/opennac/opennac-analytics.log