openNAC Analitycs Cluster Setup
This is a guide for configuring the components of the Opennac Analytics in order to build a functional cluster that will receive and process log events, forwarded from one or more Opennac Core servers, for later visualization in form of dashboards and also making it possible to use search capabilities for direct visualization of processed events containing meaningful information.
Opennac Analytics Components
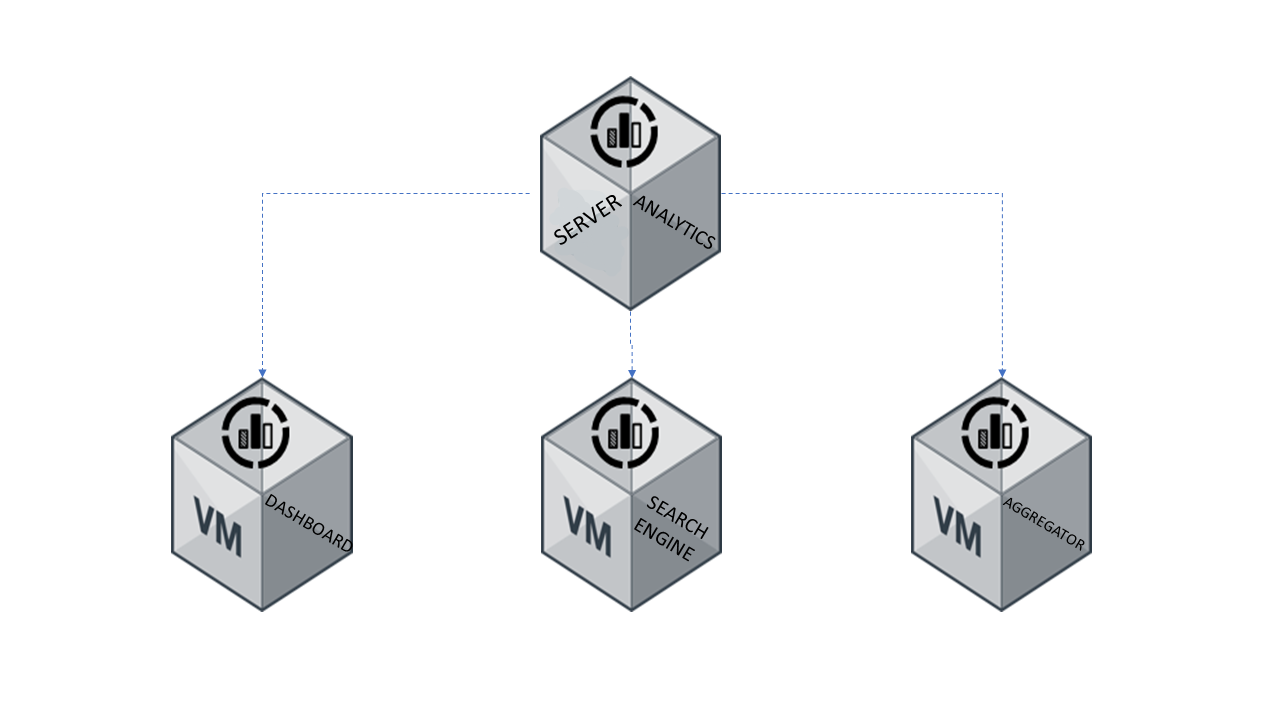
On Aggregator
Server running Logstash as main service, which receive high volume of data directly from one or more Opennac Core servers. The incoming data is then manipulated and transformed by a set of filters which help to extract the information from the log events and give them context. The processing output is forwarded to other servers and then persisted.
On Analytics (Search Engine)
This component run Elasticsearch, the full text search and analytic engine. On Analytics servers receive data (documents) from On Aggregators, index and persist it in a distributed way, allowing the information be queried and further presented in form of graphics or reports.
Dashboards (Kibana)
The visual presentation of information in form of dashboards or reports is performed by Kibana. The Opennac Core servers are able to direct connect with Kibana and display the dashboards via Web administration interface.
There are a number of tasks to be performed in each component of Opennac Analytics in order to get a functional clustered solution. Although the solution components can run on a single server, this is not the ideal strategy when we are dealing with a corporate production environment. For performance and fault tolerance reasons, the On Analytics and On Aggregator components will be configured on separate server pools.
The steps are described below in a very straight way.
Note
This document use example IP addresses and hostnames in the configurations described. On real environments please replace them with the correct addresses and names for your installation.
You can configure analytics clusters with two servers each one running the three analytics components; however is strongly recommended that Elasticsearch use as least 3 servers and each one running kibana, for aggregators servers use as least two, so the minimum servers using into analytics cluster is five.
- Three servers running Elasticsearch + Kibana
- Two servers as Aggregator
Note
The amount of servers is going to be strongly linked to the amount of network traffic processed. 5 is an usual recommendation to deploy.
Note
For each server deploy Analytics server Analytics Installation
On Analytics Cluster Configuration
The configuration tasks and tests must be performed on each of the servers that will be the nodes of the Elasticsearch cluster.
Disable Unecessary Services
The following are unecesary services please disable them.
systemctl stop logstash
systemctl stop redis
systemctl stop ntopng
systemctl stop bro
systemctl stop filebeat
systemctl stop memcached
systemctl disable logstash
systemctl disable redis
systemctl disable ntopng
systemctl disable bro
systemctl disable filebeat
systemctl disable memcached
Iptables Firewall Configuration
A standard On Analytics installation already have a pre-configured set of iptables Firewall rules necessary to allow connection to the provided services. However, additional rules are necessary according to the component being configured on the servers. In addition to the pre-configured firewall rule, the cluster nodes need to communicate with each other for cluster operation, connecting to the port TCP/9300. For example, if the cluster nodes have the following IP addresses and hostnames:
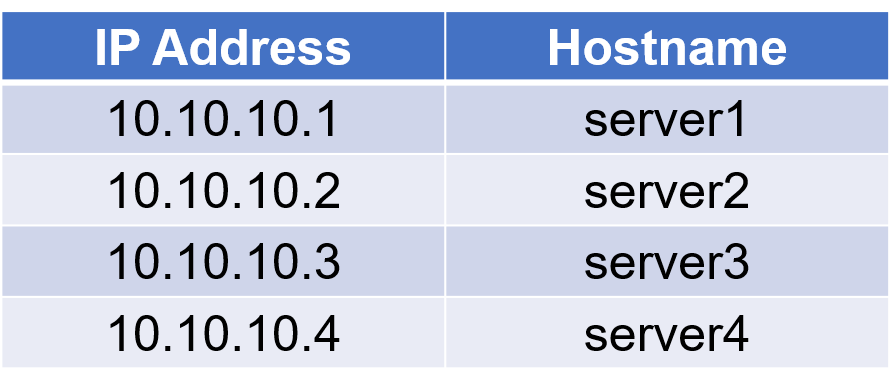
Note
The settings include in this section use IP addresses to refer the servers, but you can add the server name and ip address to hosts file /etc/hosts
Edit the file iptables in path /etc/sysconfig/
Vim /etc/sysconfig/iptables
-s 10.10.10.1 -A INPUT -p tcp -m state --state NEW -m tcp --dport 9300-j ACCEPT
-s 10.10.10.2 -A INPUT -p tcp -m state --state NEW -m tcp --dport 9300 -j ACCEPT
-s 10.10.10.3 -A INPUT -p tcp -m state --state NEW -m tcp --dport 9300 -j ACCEPT
-s 10.10.10.4 -A INPUT -p tcp -m state --state NEW -m tcp --dport 9300 -j ACCEP
Note
These lines must be inserted before the line -A INPUT -j REJECT –reject-with icmp-host-prohibited
Otherwise the REJECT rule will prevent the connection to the port TCP/9300 work properly.
Thus, following our example, the file /etc/sysconfig/iptables must be at the end of this modification:
# sample configuration for iptables service
# you can edit this manually or use system-config-firewall
# please do not ask us to add additional ports/services to this default configuration
*filter
:INPUT ACCEPT [0:0]
:FORWARD ACCEPT [0:0]
:OUTPUT ACCEPT [0:0]
-A INPUT -m state --state RELATED,ESTABLISHED -j ACCEPT
-A INPUT -p icmp -j ACCEPT
-A INPUT -i lo -j ACCEPT
-A INPUT -p tcp -m state --state NEW -m tcp --dport 22 -j ACCEPT
-A INPUT -p tcp -m state --state NEW -m tcp --dport 5000 -j ACCEPT
-A INPUT -p tcp -m state --state NEW -m tcp --dport 5001 -j ACCEPT
-A INPUT -p tcp -m state --state NEW -m tcp --dport 5002 -j ACCEPT
-A INPUT -p tcp -m state --state NEW -m tcp --dport 5601 -j ACCEPT
-A INPUT -p tcp -m state --state NEW -m tcp --dport 9200 -j ACCEPT
-A INPUT -s 10.10.10.1 -p tcp -m state --state NEW -m tcp --dport 9300 -j ACCEPT
-A INPUT -s 10.10.10.2 -p tcp -m state --state NEW -m tcp --dport 9300 -j ACCEPT
-A INPUT -s 10.10.10.3 -p tcp -m state --state NEW -m tcp --dport 9300 -j ACCEPT
-A INPUT -s 10.10.10.4 -p tcp -m state --state NEW -m tcp --dport 9300 -j ACCEPT
-A INPUT -j REJECT --reject-with icmp-host-prohibited
-A FORWARD -j REJECT --reject-with icmp-host-prohibited
COMMIT
To apply the changes restart the iptables service
systemctl restart iptables
To confirm the rules are applied, the command iptables can be issued and have its output filtered:
iptables -L -n | grep 9300
ACCEPT     tcp  --  10.10.10.1       0.0.0.0/0            state NEW tcp dpt:9300
ACCEPT     tcp  --  10.10.10.2       0.0.0.0/0            state NEW tcp dpt:9300
ACCEPT     tcp  --  10.10.10.3       0.0.0.0/0            state NEW tcp dpt:9300
ACCEPT     tcp  --  10.10.10.4       0.0.0.0/0            state NEW tcp dpt:9300
Elasticsearch Cluster Configuration
On each node of the cluster, edit the file /etc/elasticsearch/elasticsearch.yml. Within the file there are three parameter that must be changed:
- cluster.name - The name for the cluster. Must be the same at all nodes.
- network.host - The name for this node of the cluster. This name is useful to identify each node individually.
- network.host - The bind IP addresses of the node.
- discovery.zen.ping.unicast.hosts - The initial list of hosts to perform discovery when this particular node is started. On each node this list must contain the IP addresses of the other nodes.
The sections of the configuration file corresponding the parameters explained above for the host 10.10.10.1 should be like
# ---------------------------------- Cluster -----------------------------------
#
# Use a descriptive name for your cluster:
#
cluster.name: corporate-cluster
#
# ------------------------------------ Node ------------------------------------
#
# Use a descriptive name for the node:
#
node.name: server1
#
# ---------------------------------- Network -----------------------------------
#
# Set the bind address to a specific IP (IPv4 or IPv6):
#
network.host: 10.10.10.1
# --------------------------------- Discovery ----------------------------------
#
# Pass an initial list of hosts to perform discovery when new node is started:
# The default list of hosts is ["127.0.0.1", "[::1]"]
#
discovery.zen.ping.unicast.hosts: ["10.10.10.2", "10.10.10.3", "10.10.10.4"]
Note
The parameter “discovery.zen.ping.unicast.hosts:” also accepts hostnames in addition to IP addresses, but before put a name it is important assure if it can be resolved.
Other important configuration, which must be performed on all nodes, is the adjust of the JVM heap size setting according to the amount of RAM memory available and the requirements of the specific scenario where the On Analytics cluster is being deployed. For example, if the nodes have 32GB of RAM, the initial size and the maximum size can be 16GB, 50% of the total RAM memory. This change is performed in the file /etc/elasticsearch/jvm.options:
################################################################
## IMPORTANT: JVM heap size
################################################################
##
## You should always set the min and max JVM heap
## size to the same value. For example, to set
## the heap to 4 GB, set:
##
## -Xms4g
## -Xmx4g
##
## See https://www.elastic.co/guide/en/elasticsearch/reference \
## /current/heap-size.html
## for more information
##
################################################################
# Xms represents the initial size of total heap space
# Xmx represents the maximum size of total heap space
-Xms16g
-Xmx16g
To apply the changes restart the elasticsearch service
systemctl restart elasticsearch
Again the systemctl command can be invoked to check the status of the service after the restart.
systemctl status elasticsearch
The output should be like:
elasticsearch.service - Elasticsearch
Loaded: loaded (/usr/lib/systemd/system/elasticsearch.service; enabled; vendor preset: disabled)
Active: active (running) since Qua 2018-08-15 11:12:56 -03; 1 day 21h ago
Docs: http://www.elastic.co
Main PID: 15532 (java)
CGroup: /system.slice/elasticsearch.service
└─15532 /bin/java -Xms16g -Xmx16g -XX:+UseConcMarkSweepGC \
-XX:CMSInitiatingOccupancyFraction=75 -XX:+UseCMSInitiatingOccu...
Ago 15 11:12:56 server1 systemd[1]: Started Elasticsearch.
Ago 15 11:12:56 server1 systemd[1]: Starting Elasticsearch…
With the service up and running, the next step is to split the indexes into four shards and one replica. This procedure must be executed once only in one node of the cluster. Run the command:
curl --noproxy "*" -XPUT http://10.10.10.1:9200/_template/all -H 'Content-Type: application/json' -d '{
"template": "*",
"settings": {
        "number_of_shards": 3,
        "number_of_replicas": 1
        }
}'
One replica is ok, no more needed, number of shards is linked to number of elasticsearch nodes.
Configure Kibana
This step is simple and consists of change the configuration file /etc/kibana/kibana.yml and restart the kibana service.
The setting to be changed is that one corresponding to the Elasticsearch instance URL where the Kibana will connect to do all queries. This section of the configuration file must be like:
# The URL of the Elasticsearch instance to use for all your queries.
elasticsearch.url: "http://10.10.10.1:9200"
To apply the changes restart the kibana service
systemctl restart kibana
Again the systemctl command can be invoked to check the status of the service after the restart.
systemctl status kibana
The output should be like:
kibana.service - Kibana
Loaded: loaded (/etc/systemd/system/kibana.service; enabled; vendor preset: \
disabled)
Active: active (running) since Ter 2018-08-14 13:36:05 -03; 3 days ago
Main PID: 8634 (node)
CGroup: /system.slice/kibana.service
└─8634 /usr/share/kibana/bin/../node/bin/node --no-warnings \
/usr/share/kibana/bin/../src/cli -c /etc/kibana/kibana.yml
Now it is necessary configure the healthcheck of the cluster nodes
The directory /usr/share/opennac/healtcheck contain several templates of configuration files corresponding to the role of the server. For the On Analytics cluster nodes, copy the template healtcheck file and replace the default healthcheck.ini file:
For more information about healthcheck review HealthCheck Configuration
cd /usr/share/opennac/healthcheck/
cp healthcheck.ini.analytics healthcheck.ini
Since the Elasticsearch bind address was previously configured, the shell script that is invoked to do the healthcheck for this service also must to be changed to allow the correct healthcheck execution.
Edit the file check_elasticsearch.sh in /usr/share/opennac/healthcheck/libexec/ directory and change the values of the variable hostname=”localhost” with the Elasticsearch bind IP address of the node. In our example, the configuration of the server 10.10.10.1 should be:
vim /usr/share/opennac/healthcheck/libexec/check_elasticsearch.sh
hostname="10.10.10.1"
After the healthcheck configuration changes it is possible to run the healthcheck and look at the output to ensure if everything is OK:
php /usr/share/opennac/healthcheck/healthcheck.php
If everything is ok, the output of this command should be like:
deleting lockfile!...
CACHE is in status: OK
LOGCOLLECTOR is in status: OK
ELASTICSEARCH is in status: OK
KIBANA is in status: OK
On Aggregators Cluster Configuration
The configuration tasks and tests must be performed on each of the servers that will act as aggregators, receiving log events from the Opennac Core farm.
Disable Unecessary Services
As the Opennac Analytics nodes, the aggregators also have a set of services enabled, which will not be used. The Unnecessary services can be disable by the commands:
systemctl stop ntopng
systemctl stop bro
systemctl stop filebeat
systemctl stop memcached
systemctl stop elasticsearch
systemctl stop kibana
systemctl sisable ntopng
systemctl disable bro
systemctl disable filebeat
systemctl disable memcached
systemctl disable elasticsearch
systemctl disable kibana
Configure Logstash
The first step in configure Logstash and make it able to correct receive and handle the log events is to edit the file /etc/default/opennac and change the variable OPENNAC_ES_HOSTS replacing the default value ‘“onanalytics:9200”’ by the IP addresses or names of the Elasticsearch cluster nodes.
And also change the variable OPENNAC_NETDEV_IP assigning to it the IP address of the Aggregator being configured, for example, 10.10.10.5. This IP is the one that will be used to carry out the polevals and therefore the one that will appear in the Business Profiles.
vim /etc/default/opennac
After the change, the Configuration file must be like:
JAVACMD="/usr/bin/java"
LS_HOME="/usr/share/logstash"
LS_SETTINGS_DIR="/etc/logstash"
LS_PIDFILE="/var/run/logstash.pid"
LS_USER="logstash"
LS_GROUP="logstash"
LS_GC_LOG_FILE="/var/log/logstash/gc.log"
LS_OPEN_FILES="16384"
LS_NICE="19"
SERVICE_NAME="logstash"
SERVICE_DESCRIPTION="logstash"
OPENNAC_API_KEY="8a380abc-9a92-11e8-a9e9-6e6163636f72"
OPENNAC_NETDEV_IP="10.10.10.5"
#This parameter is only used on packet updates. The format for multiple hosts is
#'"onanalytics:9200","onanalytics2:9200","etc"'
OPENNAC_ES_HOSTS='"10.10.10.1:9200","10.10.10.2:9200","10.10.10.3:9200","10.10.10.4:9200"'
The next step is change the file /etc/logstash/conf.d/99_output.conf and replace all occurrences of [“onanalytics:9200”] whith the IP addrsses or hostnames of the Elasticsearch cluster nodes.
vim /etc/logstash/conf.d/99_output.conf
which for example should be:
["10.10.10.1:9200","10.10.10.2:9200","10.10.10.3:9200","10.10.10.4:9200"]
Logstash also needs the adjust of the JVM heap size setting according to the amount of RAM memory available and the requirements of the specific scenario. For example, if the aggregators have 32GB of RAM, the initial size and the maximum size can be 16GB, 50% of the total RAM memory. This change is performed in the file /etc/logstash/jvm.options
## JVM configuration
# Xms represents the initial size of total heap space
# Xmx represents the maximum size of total heap space
-Xms16g
-Xmx16g
To apply the changes restart the logstash service
systemctl restart logstash
Again the systemctl command can be invoked to check the status of the service after the restart.
systemctl status logstash
The output should be like:
logstash.service - logstash
Loaded: loaded (/etc/systemd/system/logstash.service; enabled; vendor preset: disabled)
Active: active (running) since Qua 2018-08-15 13:39:34 -03; 4 days ago
Main PID: 23452 (java)
CGroup: /system.slice/logstash.service
└─23452 /bin/java -Xms16g -Xmx16g -XX:+UseParNewGC -XX:+UseConcMarkSweepGC -XX : CMSInitiatingOccupancyFraction=75 -XX : +Use...
Ago 15 13:39:34 server5 systemd[1]: Started logstash.
Ago 15 13:39:34 server5 systemd[1]: Starting logstash...
Ago 15 13:39:51 server5 logstash[23452]: Sending Logstash's logs to /var/log/logstash which is now configured via log4...erties
Hint: Some lines were ellipsized, use -l to show in full.
Now it is necessary configure the healthcheck of the Aggregators.
For the Aggregators copy the template healtcheck file and replace the default healthcheck.ini file:
cd /usr/share/opennac/healthcheck/
cp healthcheck.ini.aggregator healthcheck.ini
After the healthcheck configuration changes it is possible to run the healthcheck and look at the output to ensure if everything is OK:
php /usr/share/opennac/healthcheck/healthcheck.php
If everything is ok, the output of this command should be like:
CACHE is in status: OK
LOGCOLLECTOR is in status: OK
LOGSTASH is in status: OK
RAM is in status: OK
SWAP is in status: OK
MEMCACHED is in status: OK
Configure Opennac Core To Send Logs
With the cluster infrastructure done, the Opennac core servers must be configured to send the logs for the Aggregators. On all Opennac Core servers of the farm, change the /etc/filebeat/filebeat.yml in order to adjust the filebeat prospectors (if applicable) and the output hosts:
The default logfile prospected by filebeat is /var/log/opennac/opennac-analytics.log and it should be changed only if the events to be sent to Opennac Anaytics are being recorded into a different file.
The most important change is the configuration of the addresses of the Aggregators. In the section corresponding to the filebeat output to Logstash, the default configuration normally is hosts: [“onaggregator:5000”] and here the example IP addresses of the logstash – 10.10.10.5, 10.10.10.6, 10.10.10.7 and 10.10.10.8 - will be used. After the configuration done, the corresponding sections of the filebeat.yml file should be:
#=========================== Filebeat prospectors =============================
filebeat.prospectors:
# Each - is a prospector. Most options can be set at the prospector level, so
# you can use different prospectors for various configurations.
# Below are the prospector specific configurations.
- type: log
# Change to true to enable this prospector configuration.
enabled: true
# Paths that should be crawled and fetched. Glob based paths.
paths:
- /var/log/opennac/opennac-analytics.log
#----------------------------- Logstash output --------------------------------
output.logstash:
# The Logstash hosts
hosts: ["10.10.10.5:5000","10.10.10.6:5000","10.10.10.7:5000","10.10.10.8:5000"]
To apply the changes restart the filebeat service
systemctl restart filebeat
Again the systemctl command can be invoked to check the status of the service after the restart.
systemctl status filebeat
The output should be like:
filebeat-god (pid 8003) is running…
From now on, it is possible to confirm the Opennac Core server sending logs to Aggregators, just running the netstat command and looking for active connections on the destination port 5000:
netstat -anp | grep 5000
The netstat output command will display the established connection between the Opennac Core server and the Aggregator:
tcp 0 0 10.10.10.200:53292 10.10.10.5:5000 ESTABLISHED 8004/filebeat
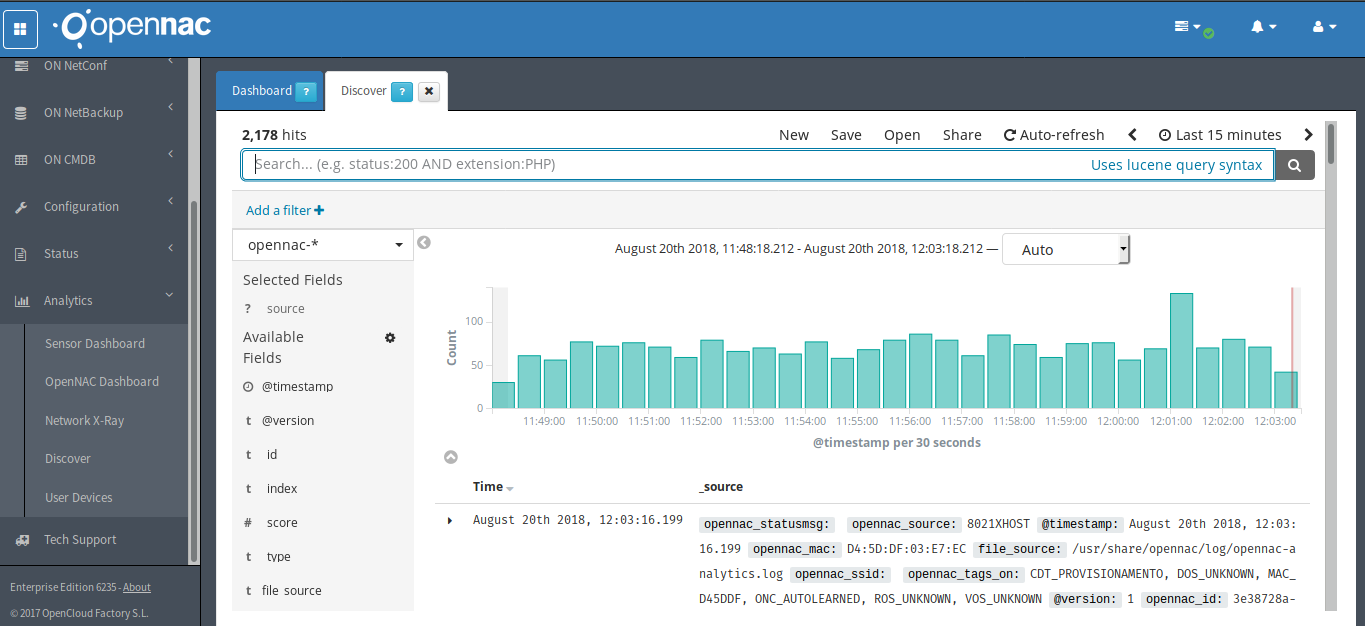
From Opennac Core web administration interface is possible start to see the events being graphically displayed on the Dashboard
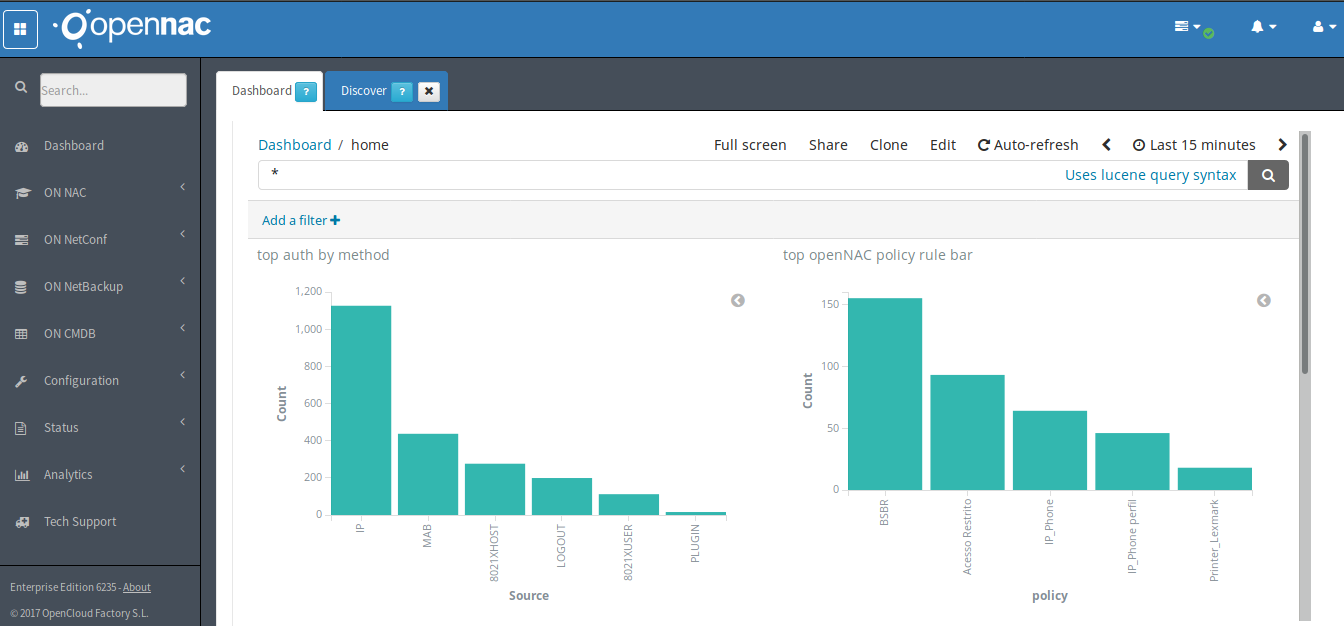
Administrators can also verify the events on Analytics –> Discover