HealthCheck
The healthcheck is an openNAC’s monitoring module. It has the service checks that can guarantee that all of openNAC’s needed services are up and running.
It works also for cluster in each server of the openNAC’s.
Setup
In an openNAC’s fresh install, the first step is to check if the package is installed:
rpm -qa | grep opennac-healthcheck
If it is not installed, we need to install it:
yum install opennac-healthcheck -y
After installing it, we need to configure it. The steps will differ a bit depending on the server’s role, so here is the step by step:
Core Master
Enable this when the role is openNAC Core Master in single deplyment or cluster.
cd /usr/share/opennac/healthcheck/
cp -rfv healthcheck.ini.master healthcheck.ini
Core Slave
Enable this when the role is openNAC Core Slave in cluster deployment.
cd /usr/share/opennac/healthcheck/
cp -rfv healthcheck.ini.slave healthcheck.ini
mysql -u root -p<mysql_root_password>
GRANT SUPER, REPLICATION CLIENT on *.* to 'nagios'@'localhost' identified by 'Simpl3PaSs';
flush privileges;
Core Proxy
Enable this when the role is openNAC Core Proxy
cd /usr/share/opennac/healthcheck/
cp -rfv healthcheck.ini.proxy healthcheck.ini
Analytics (Not clustered)
Enable this when the role is openNAC Analytics in single deployment.
cd /usr/share/opennac/healthcheck/
cp -rfv healthcheck.ini.analy+agg healthcheck.ini
cp -rfv application.ini.sample application.ini
Analytics (Clustered)
Enable this when the role is openNAC Analytics in cluster deployment.
cd /usr/share/opennac/healthcheck/
cp -rfv healthcheck.ini.analytics healthcheck.ini
cp -rfv application.ini.sample application.ini
Aggregator
Enable this when the role is openNAC Aggregator in cluster deployment.
cd /usr/share/opennac/healthcheck/
cp -rfv healthcheck.ini.aggregator healthcheck.ini
cp -rfv application.ini.sample application.ini
Sensor
Enable this when the role is openNAC Sensor.
cd /usr/share/opennac/healthcheck/
cp -rfv healthcheck.ini.sensor healthcheck.ini
cp -rfv application.ini.sample application.ini
Results
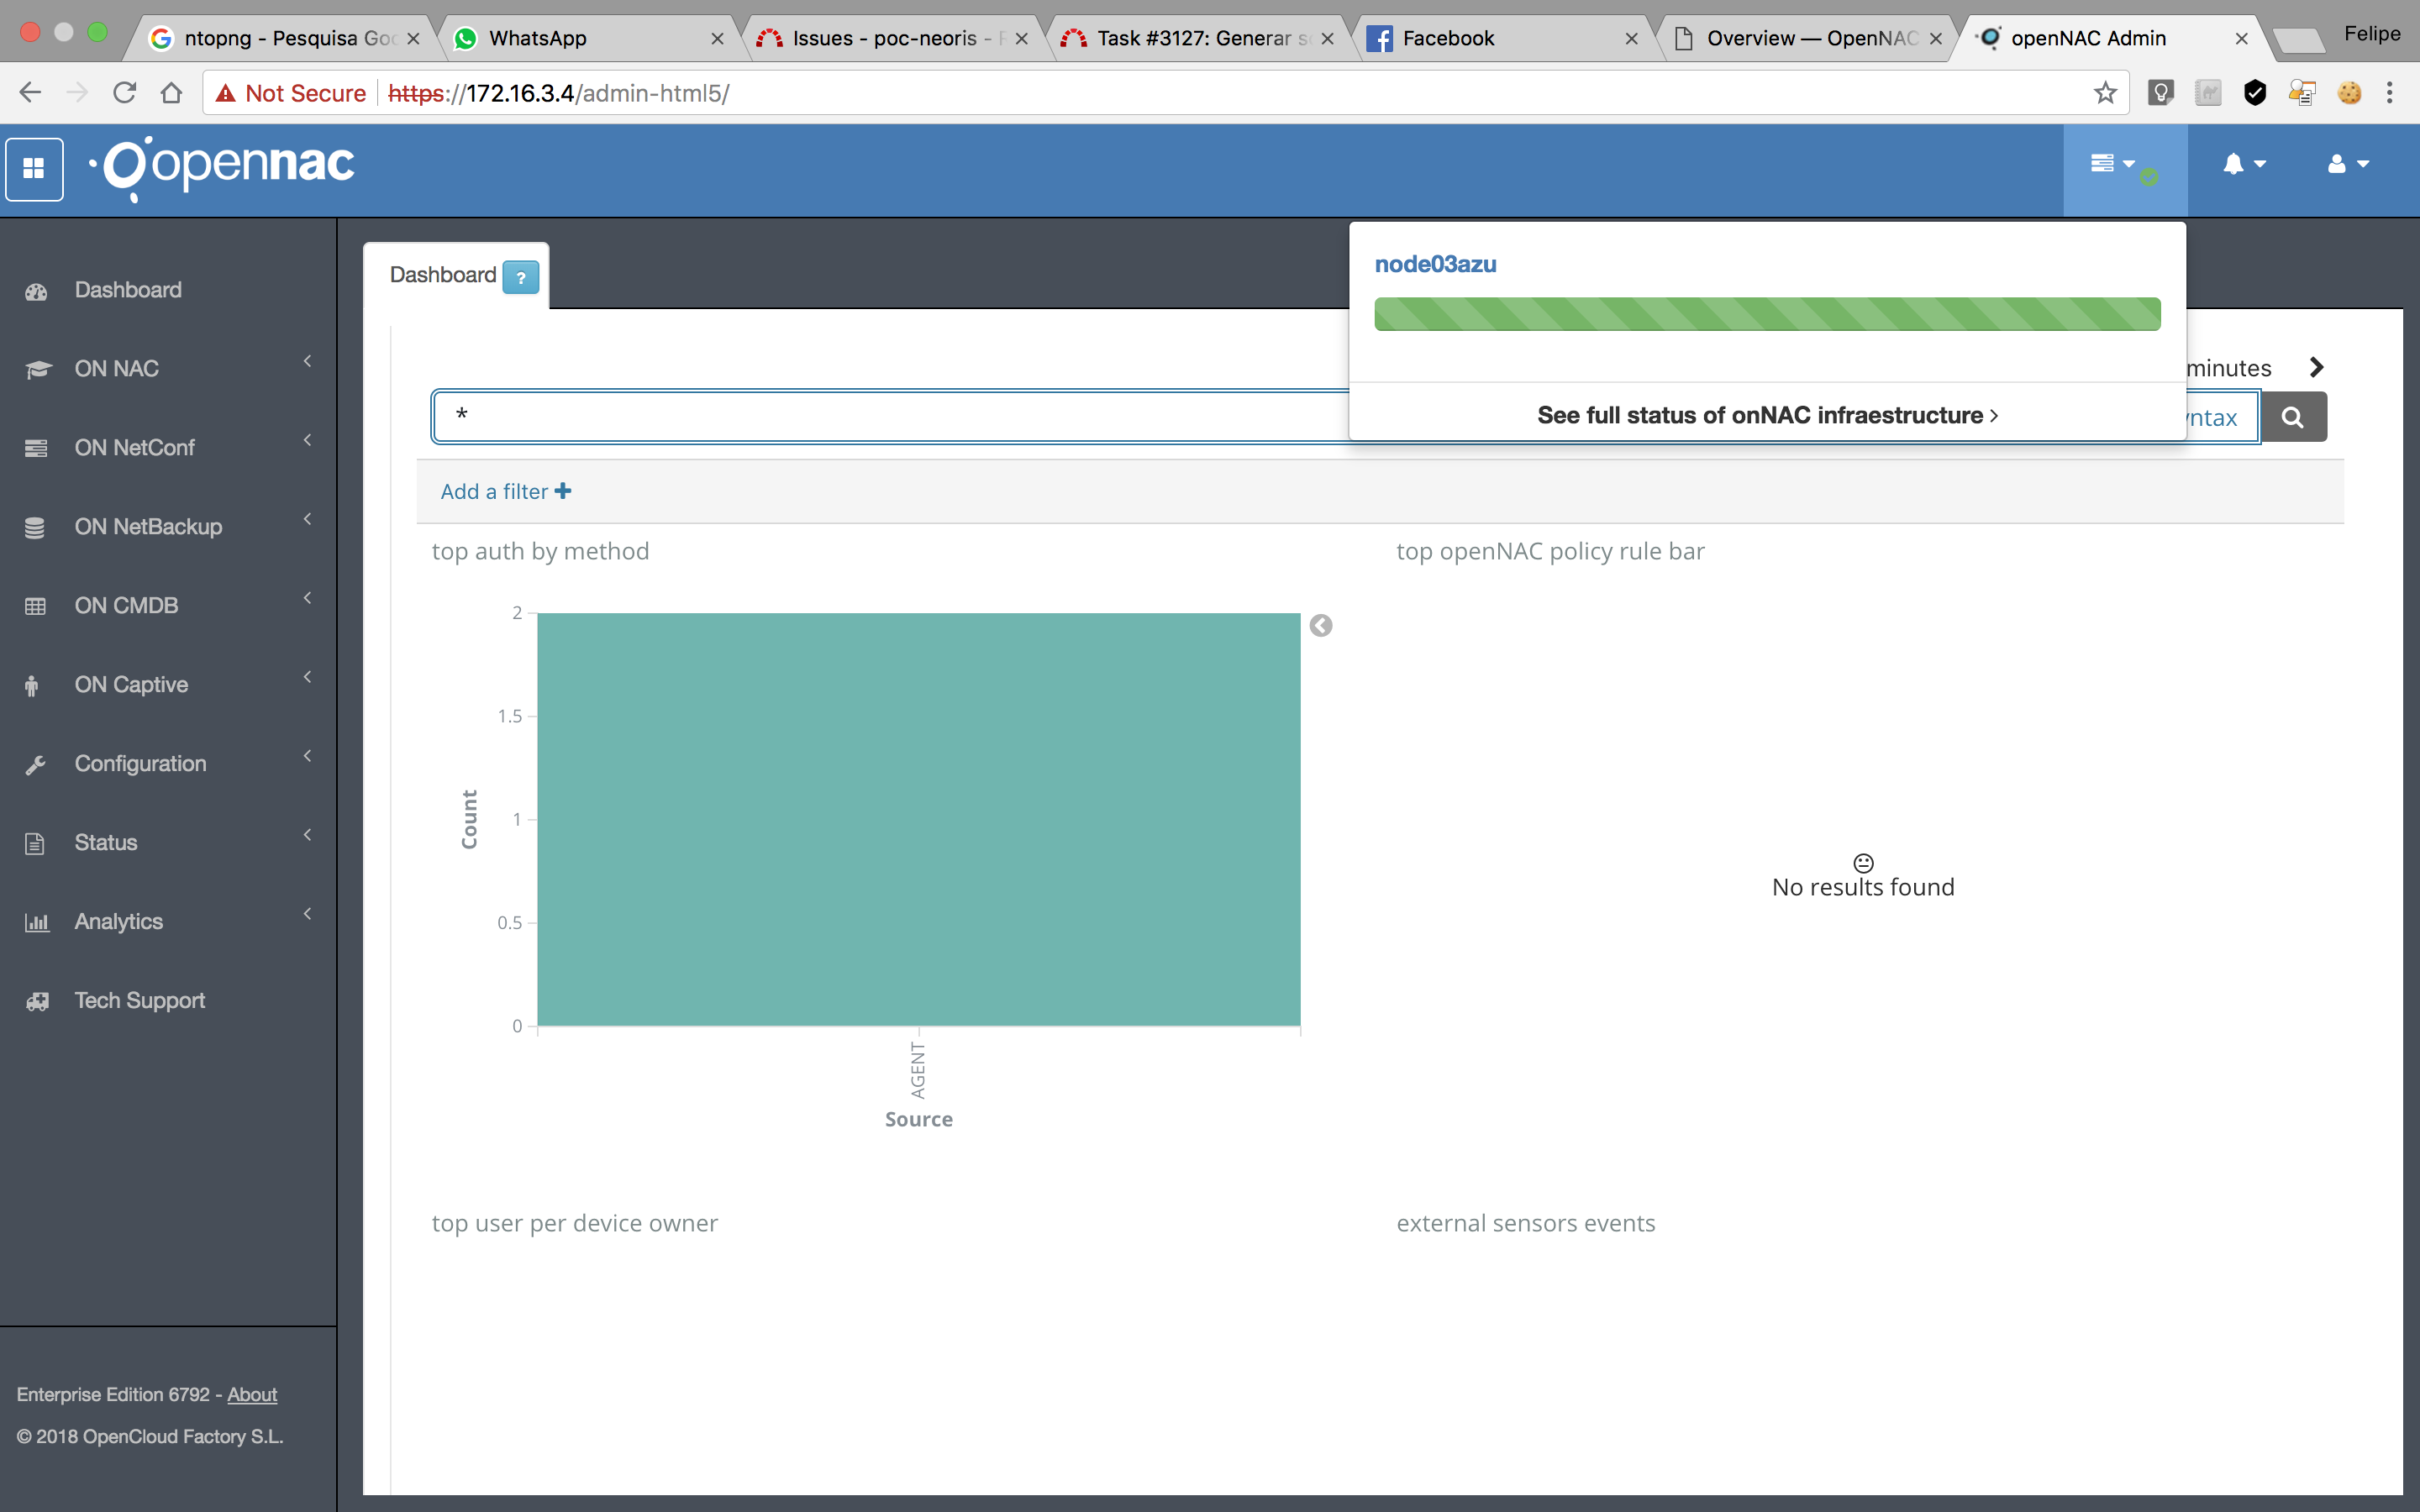
After configure the healthcheck’s inis, the check will be executed again and continuosly, we will be able to see the results of the checks in the web interface. To do this, log in to openNAC’s administrative interface and click on the “Status of onNAC Infraestructure”, on the upper right corner of the screen, as the image shows:
If we click on the “See full status of onNAC infrastructure”, we will be able to see all the services’ details, as shown on the next image:
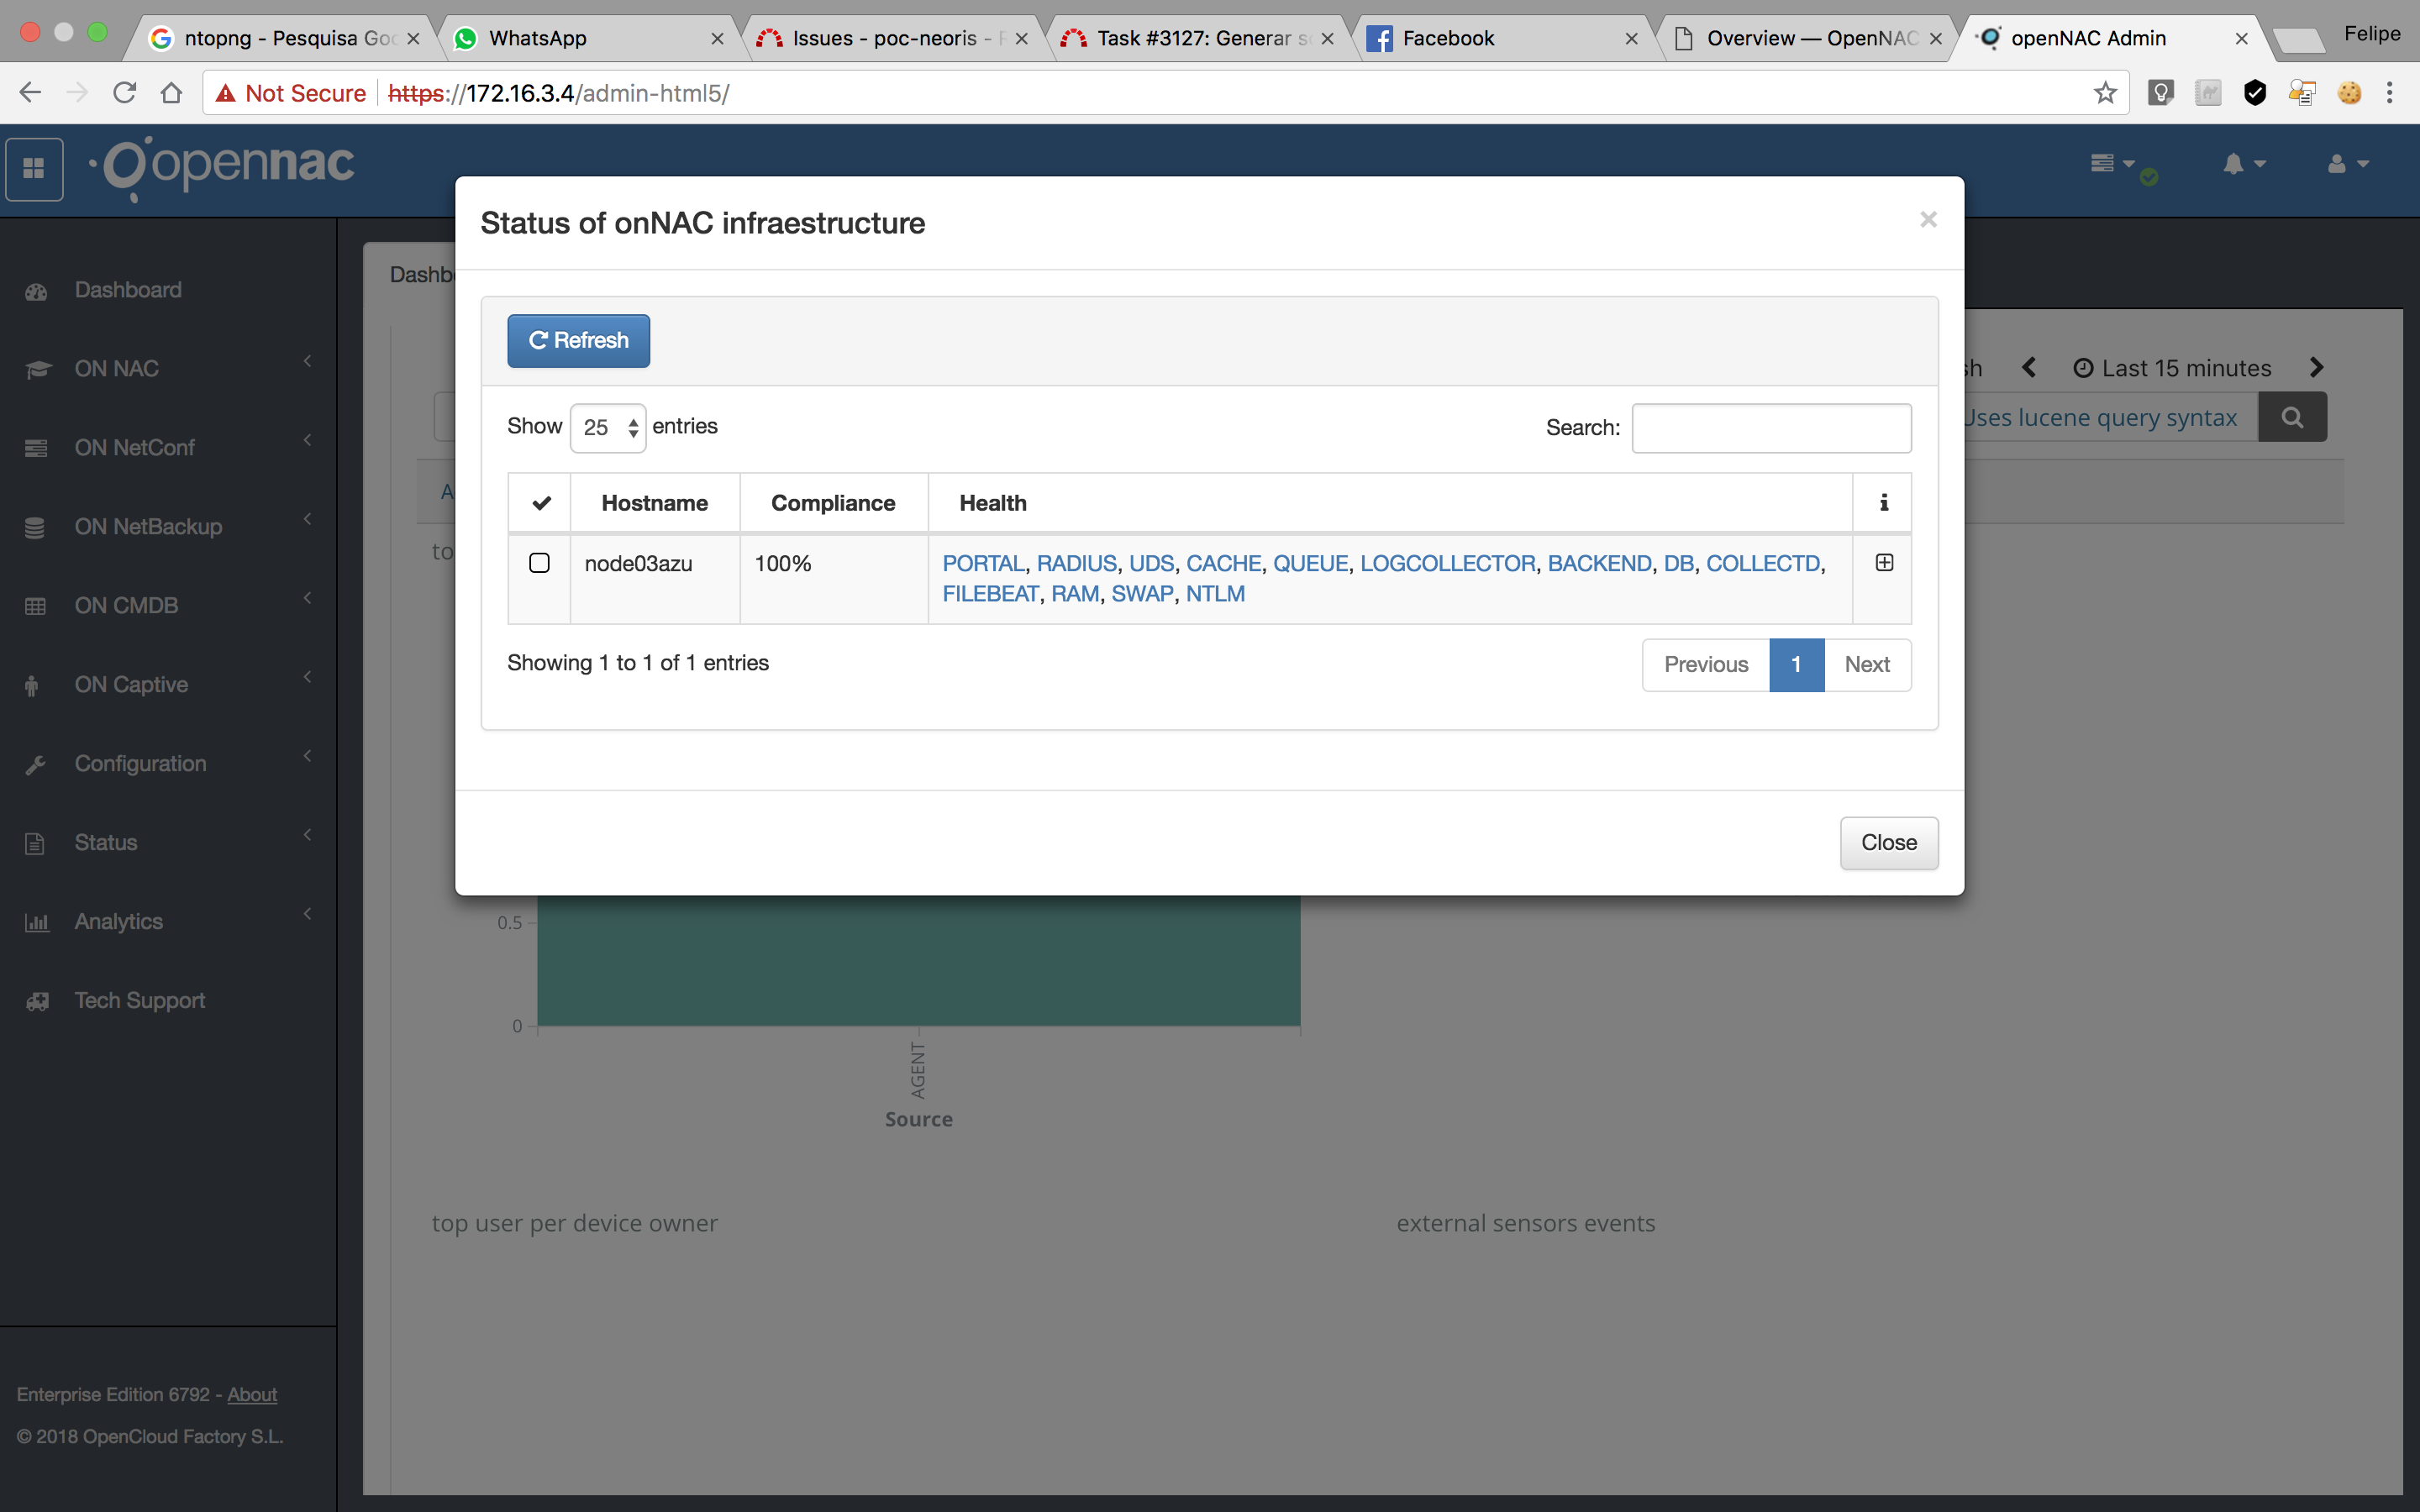
The service names will be shown in one of the three colors:
- Blue: The service status is ok.
- Yellow: The service is in warning status, the authentication service should not be affected by this problem.
- Red: The service is in critical status and it is possible that the authentication service is now being affected by this problem.
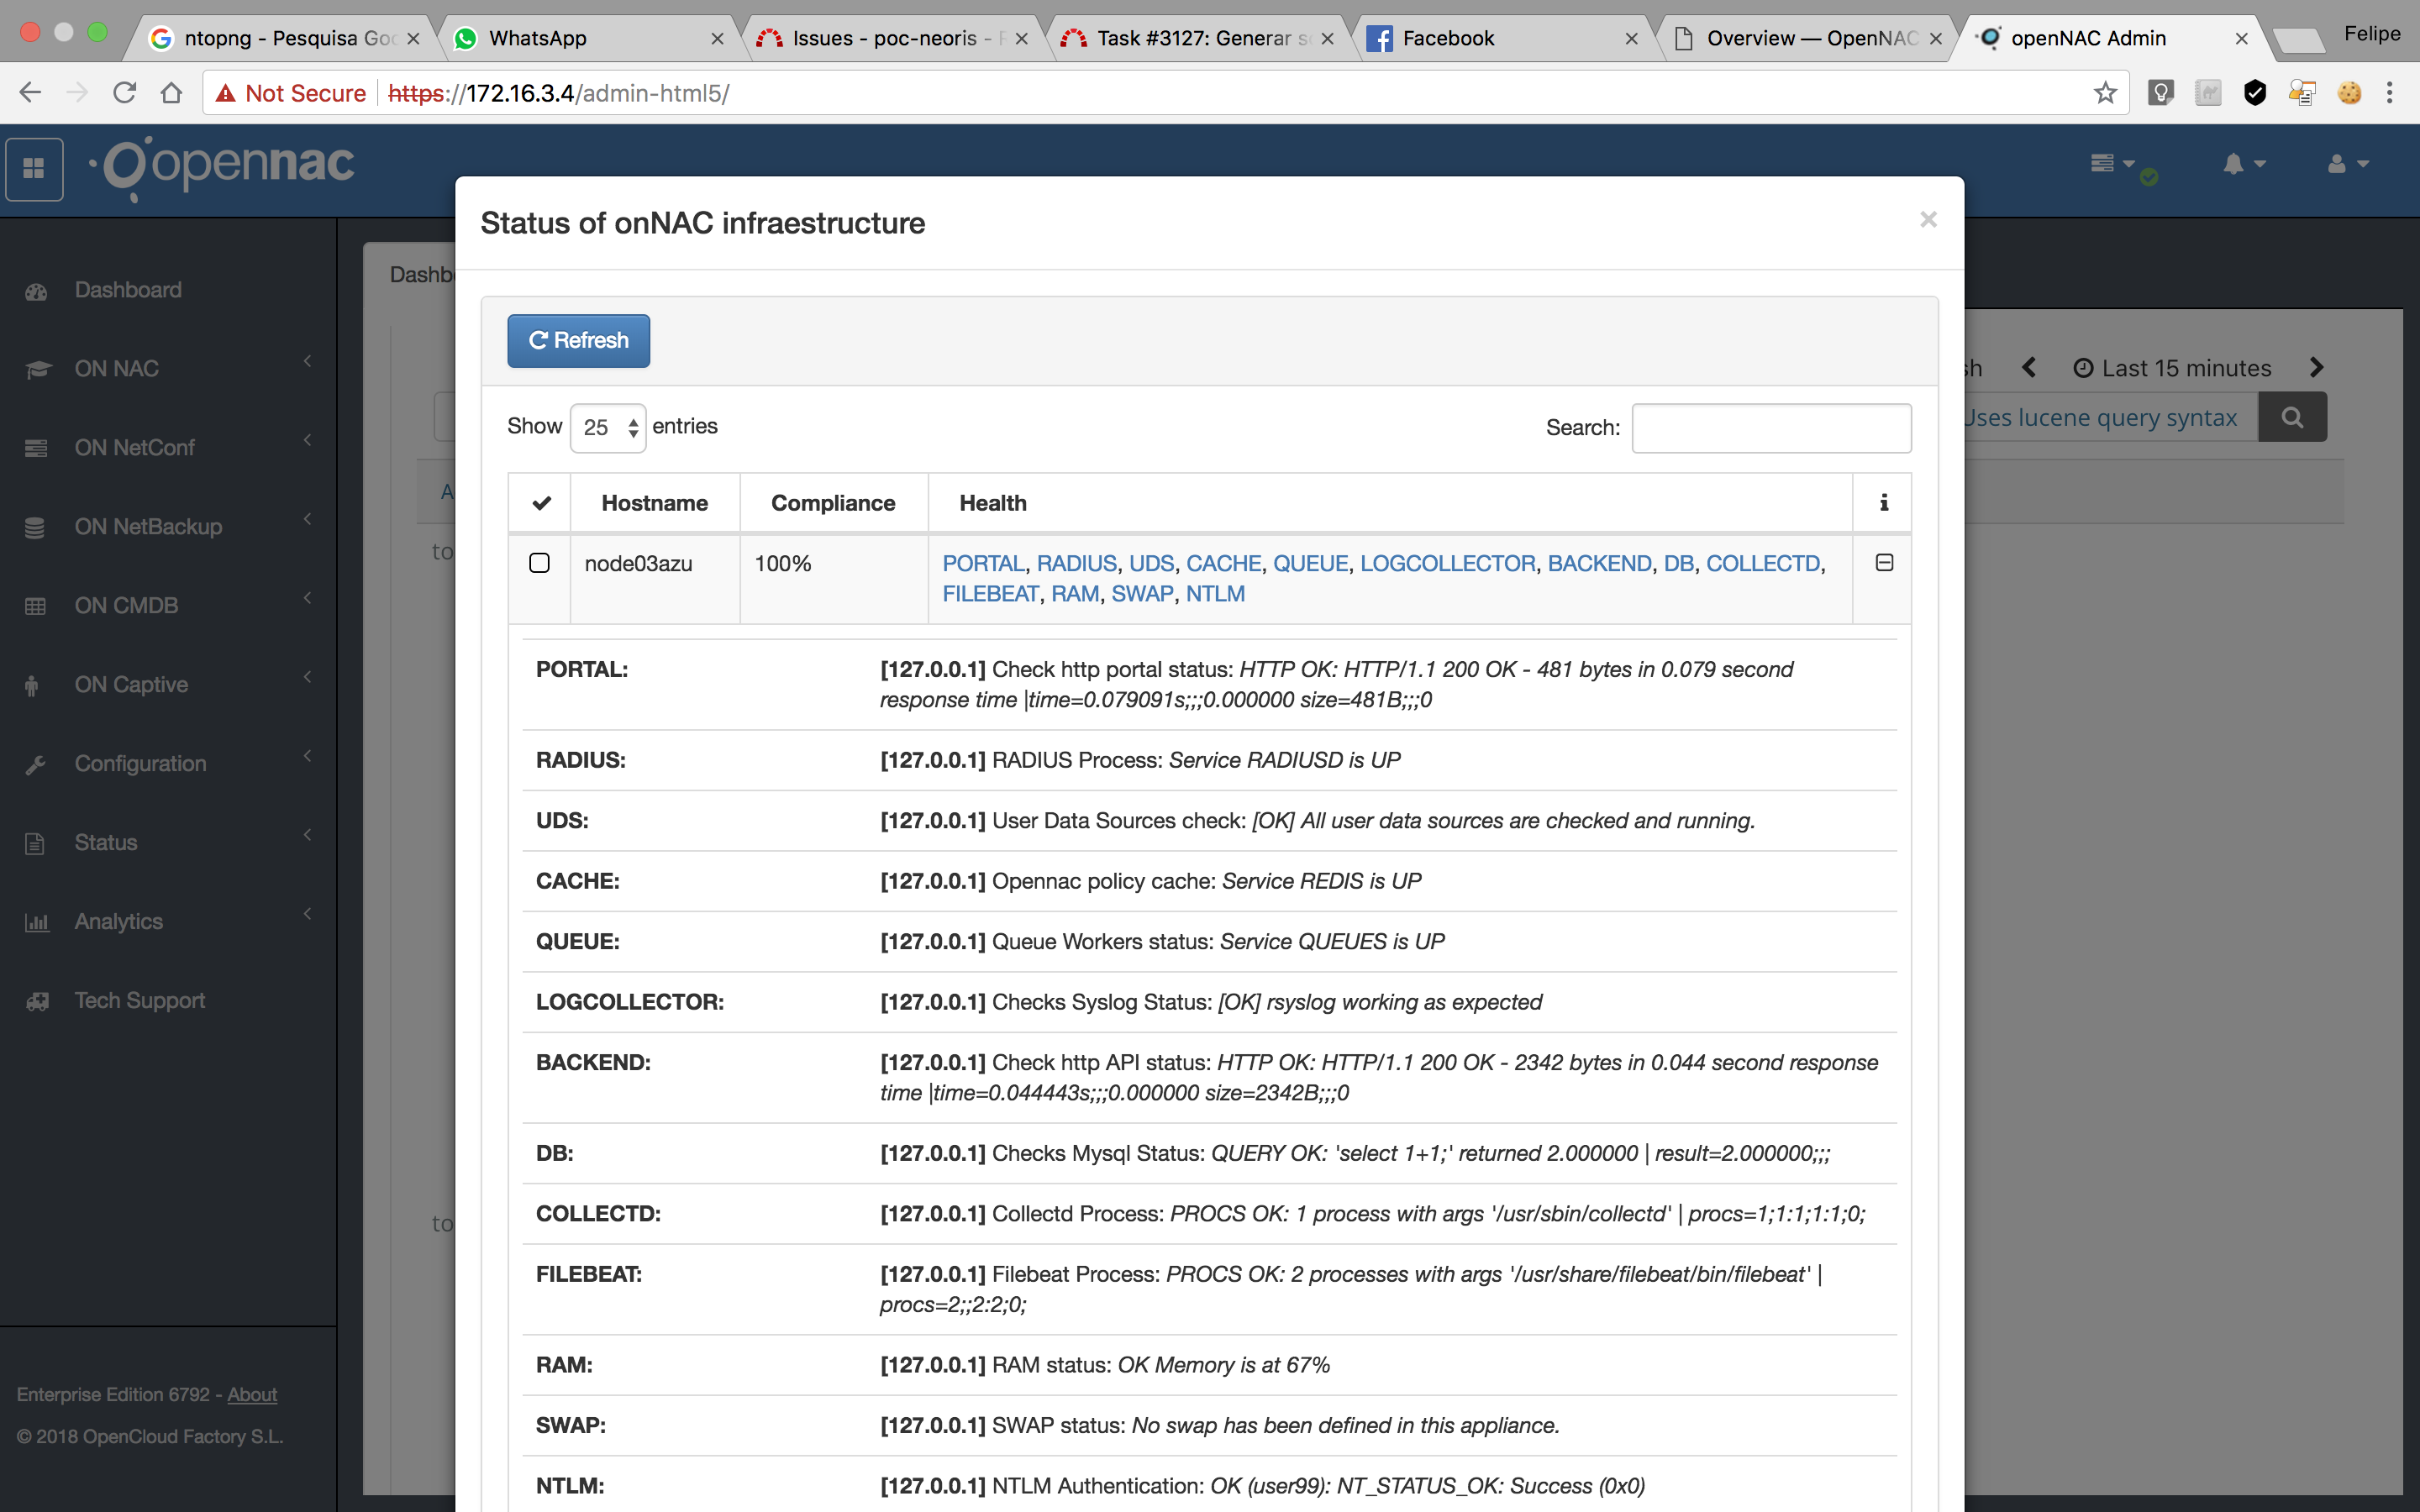
If we click the “+”, we can see the detailed list of checks and each return, as seen below:
List of actual checks (Service States)
- Active Directory Domain Membership
- Backup monitoring nodes
- Bro system
- Cahe memory
- Certificates
- CPU
- DIG (Domain information groper)
- Elasticsearch
- Filesystem
- Http
- Kibana
- Logstahs
- MySQL server connections
- MySQL queries
- MySQL replication
- MySQL service
- NTLM
- Processes
- Queues
- Radius
- Redis
- Remote queues
- Swap memory
- System logs
- System memory
- Time syncronization
- User data sources
- Winbind
Services that are checked can be in one of four different states:
- OK
- WARNING
- UNKNOWN
- CRITICAL
Active Directory Domain Membership
check_ad_domain_membership.sh
This healthcheck basically verifies if a host is properly joined to Active Directory Domain.
It verifies if a server that has joined in the active directory domain, has the keytab file that contains the Master keys for the appropriate service, called the service key. The service key is used by a service to authenticate itself to the KDC, and is known only to Kerberos and the service.
To do this chechk, we will look at the file kerberos_keytab_file (“/etc/krb5.keytab”) and the temporary file (“/tmp/healtcheck_domainmembership.out”) and execute the command net ads testjoin, this command checks whether participation in a domain is still valid.
Backup monitoring nodes
check_backup.sh
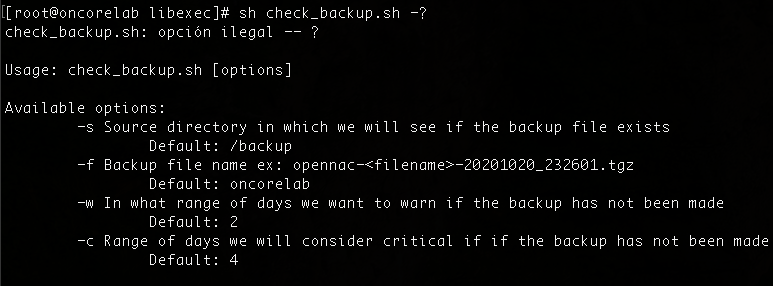
This healthcheck is in charge to check if the last backup located in the /backup directory (the directory could be modified by a parameter), was executed correctly into all workers.
We have to check if there is any file in the /backup folder created in last 48 hours (the time could be modified by a parameter), the backup process is executed each day. We can choose the margin that we think is convenient to give us a warning notice if a few days have passed since the last backup, or a critical if many days have passed. By default, the check_backup will give us a warning if it has been 2 days since the last backup and critical if 4 days have passed, these values are configurable as parameters.
The pattern of selected files have to be checked based on backup process. By default, the name of the file to be checked will follow the format opennac-$(uname -n)-date_hour.tgz, and the default directory will be /backup. Folder and pattern filename could be modified by parameters, too. The healthcheck will check if the directory exists or if is it empty and if the filename exists, if any of the parameters is wrong, we will return error.
To offer help to the user, a help function has been configured, it will offer information about the parameters that we can configure in the check.
Bro system
check_bro.sh
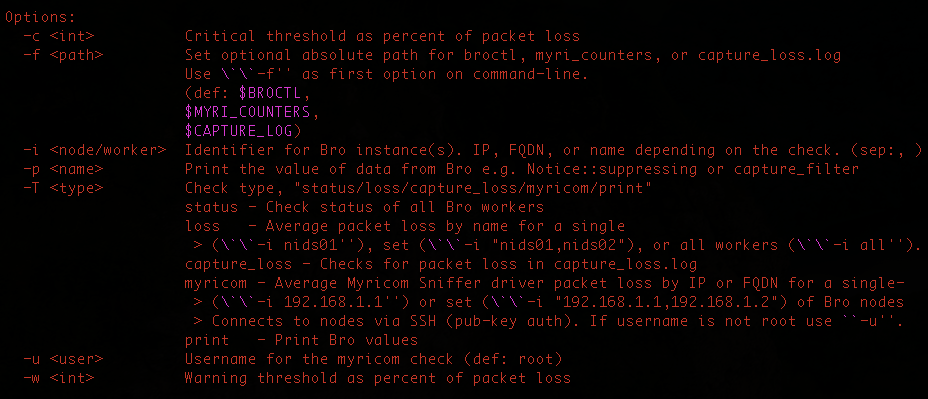
This healthcheck checks the status of Bro and Bro workers. This script should be run on the Bro manager. It has several functions:
Check status of all Bro workers, showing if has stopped, crashed, is running or if it has an unknown status. If any has stopped, crashed or has unknown status, it will show a CRITICAL status,
./check_bro.sh -f /usr/local/bro-2.2/bin/broctl -T status
Return average packet loss for the 3 named bro workers
./check_bro.sh -T loss -i "nids0,nids1,nids2"
Check average packet loss of all bro workers against warning and critical thresholds i.e > 10% or 20% packet loss. If the average packet loss it above the stablished parameters, we will send a CRITICAL or a WARNING message.
./check_bro.sh -T loss -i all -w 10 -c 20
Check packet loss percentage for the last most recent interval from Bro’s capture_loss.log above 10% loss. If it’s above the stablished paramter, we will send a CRITICAL message.
./check_bro.sh -f /usr/local/bro-2.2/logs/current/capture_loss.log -T capture_loss -c 10
Check average packet loss reported by Myricom’s SnifferG driver for each Bro node.
./check_bro.sh -T myricom -i "<ip1,ip2>" -u bro
We can establish several parameters to configure our check, here we have the help function with the different parameters that we can configure in the check:
Cache memory
check_memcached.sh
It give us information about the cache memory that our system, or another that we want to check, is using in the moment that we execute the healthcheck. We can set some parameters as the host and port, the default parameters are the localhost and the port 11211. We can also set critical and warning parameters so as the system gives us an alert if the cache memory is above the range that we set as a parameter, or above the default parameters, 90% for warning and 95% for critical. The script will also check if the parameters introduced have sense, if not, it will give a status UNKNOW. If it cannot connect to the host introduced, it will send a status CRITICAL time out.
Certificates
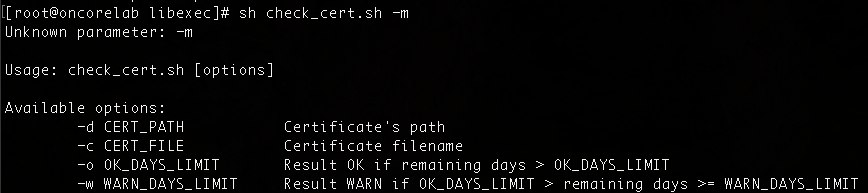
check_cert.sh
This healthcheck will be in charge to check if, given a directory (/etc/raddb/certs) and a filename, it will check if these parameters are valid and exists, if not, it will return a CRITICAL message. If it exists, it will check if the certificate is valid and how many days are left until it expires. We can configure a parameter, in days, to inform us of how many days are left for the certificate to remain valid, and another parameter to send us a warning message when there are certain days left for it to expire.
The default parameters will be, 60 for the OK value, and 30 for the WARNING.
Here we have the help function with the different parameters that we can configure in the check:
CPU
check_cpu.sh
It basically gives information about the CPU stadistics in the moment we execute the check.
DIG (Domain information groper)
check_dig -> /usr/lib64/nagios/plugins/check_dig
This script tests the DNS service on the specified host using the Domain Information Groper. Dig is a command line tool that searches DNS records, through server names, and shows you the result.
By default, dig sends the DNS query to all server names listed in the resolver file (/etc/resolv.conf), unless you are prompted to query against a specific server name.
Elasticsearch
check_elasticsearch.sh
Is a Nagios plugin to check the cluster status of elasticsearch. It also parses the status page to get a few useful variables out, and return them in the output. This plugin also allows to monitor disk or memory usage of Elasticsearch.
First of all, it checks if the credentials to access the service are correct, once verified, it will retrieve the state of the host using wget. With the information retrieved, we can see information regarding different fields, such as name, status, number of nodes, etc.
The field is displayed as Red, Yellow or Green, which refers to OK, WARNING OR CRITICAL, if it is not any of the above, it will return UNKNOWN.
Finally, we will show by console all the information that has been recovered with the wget.
Filesystem
check_filesystem.sh
This healthcheck will be in charge to check the usage of our machine. If the usage is lower than a 85%, the check will return status OK, if it’s between 85-90%, it will return a WARNING, otherwise, it will return status CRITICAL. These parameters can be easily modifyed.
HTTP
check_http -> check_http -> /usr/lib64/nagios/plugins/check_http
This script tests the HTTP service on the specified host. It can test normal (http) and secure (https) servers, follow redirects, search for strings and regular expressions, check connection times, and report on certificate expiration times. It will attempt to open an HTTP connection with the host. Successful connections will return status OK, refusals and timeouts return status CRITICAL, other errors return status UNKNOWN. Successful connects, but incorrect response messages from the host result in status WARNING. If you want to check a virtual server that uses ‘host headers’ you must supply the FQDN (fully qualified domain name) as the [host_name] argument. You may also need to give a FQDN or IP address using -I (or –IP-Address).
Kibana
check_kibana.sh
It makes a GET type Curl to retrieve information about the status of the host, we can easily configure the host and the port from which we want to look at the information. We will show an output informing if the service is up and running or down.
Logstash
check_logstash.sh
This script does two different checks, it makes a GET type Curl to retrieve information about the host, and another one to get if the status code is Internal Server Error (500).
We will show an output informing if the service is up and running or down.
MySQL server connections
check_mysql -> /usr/lib64/nagios/plugins/check_mysql
This script tests connections to a MySQL server. By default, the local database is checked using the default unix socket. You can force TCP on localhost by using an IP address or FQDN (‘localhost’ will use the socket as well).
MYSQL query
check_mysql_query -> /usr/lib64/nagios/plugins/check_mysql_query
This program checks a query result against threshold levels. It checks MySQL arbitrary queries against regex matches or numerical ranges.
MYSQL replication
check_mysql_replication.sh
The healthcheck compares master and slave positions. First of all it checks if the service MYSQL replication is enabled or not, if it is DOWN it will send an status CRITICAL. Then we will check some parameters, checking the replication status:
- Slave_IO_State: gives information abou current status of the slave
- Slave_IO_Running: Whether the I/O thread for reading the source’s binary log is running.
- It will check if the SQL thread is running or not, and if the I/O thread is running or not, this threads basically inform if the worker is connected to the master and getting data, so if there’s a problem in the communication between your worker and the Master, the script will return a CRITICAL message.
- Seconds_Behind_Master: The number of seconds that the slave SQL thread is behind processing the source’s binary log. A high number (or an increasing one) can indicate that the slave is unable to handle events from the source.
- If the worker is more than 60 secods behind the Master, it will show a WARNING reporting how many seconds is the worker behind the master.
- Last_IO_Error, Last_SQL_Error: The last errors registered by the I/O and SQL threads when processing the relay log. Ideally these should be blank, indicating no errors.
MYSQL
checkMysql.sh
This healthcheck basically checks if the MYSQL service is running properly, or if there’s any error and it will return status CRITICAL.
NTLM
heck_ntlm.sh
Check NTLM Authentication against Active Directory where server is joined. To be able to do this check, we must configure a username, a password and a domain, if not, the srcipt will use the default parameters. Other parameters can be also configured as you can see in the image below.
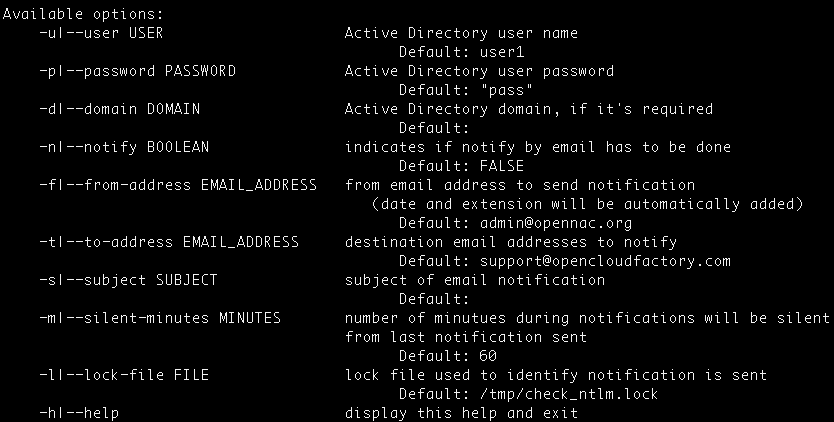
Optinally, you can configure it to give mail notifications, by setting the notify parameter to true an introducing the mail address.
Processes
check_procs -> /usr/lib64/nagios/plugins/check_procs
Checks all processes and generates WARNING or CRITICAL states if the specified metric is outside the required threshold ranges. The metric defaults to number of processes. Search filters can be applied to limit the processes to check. Ranges are specified ‘min:max’ or ‘min:’ or ‘:max’ (or ‘max’). If specified ‘max:min’, a WARNING status will be generated if the count is inside the specified range.
Queues
check_queues.sh
This script will check first if the job “executejob” is working if not, we will return status message informing that que services is DOWN. Then it will check the number of unfinished tasks, number of currently running tasks and the number of workers that can handle that task. If the numeber of tasks is lower than the ones that is supose to support, itl will show a WARNING message.
Radius
check_radius.sh
Tests to see if a RADIUS server is accepting connections. It can be used to test changes you made in the configuration of the radius server, or it can be used to monitor if a radius server is up. Setting parameters as username, password and NAS-IP-Add, we can do the following test:
(echo "User-Name={username},User-Password={password},NAS-IP-Address=${ip}" | /usr/bin/radclient localhost:1812 auth {secret} -s 2>&1
Analyzing the output, we will determine if the Radius service is UP, showing an OK message, or DOWN showing a CRITICAL message
Redis
check_redis.sh
This script will basically test is Redis is UP and we can access it. We will set a timeout, and we will try to stablish a connection, if we do not get a response in that interval, we will show status CRITICAL.
Remote Queues
check_remote_queues.sh
It checks if an specific queue is currently running.
Swap
check_swap.sh
Check swap space on local machine. It will get the total memory space, and the memory used in our machine, if the usage is greater than a 10%, we will send a WARNING message.
Syslog
check_syslog.php
This script will check if the syslog standard is working properly or not.
System Memory
check_memory.sh
This healthcheck will be in charge to check the memory usage of our machine. If the memory usage is lower than a 85%, the check will return status OK, if it’s between 85-93%, it will return a WARNING, otherwise, it will return status CRITICAL. These parameters can be easily modifyed.
Time Syncronization
check_time_sync.sh
This check asks us to set the redis server, if we not introduce any parameters, it will use the default value onmaster. First of all, using the redis server name, and the timeout, it will get the server time, if there’s an error getting the time, it will return status CRITICAL. Once we’ve got the server time, we’ll get the local time, and we will do a subtraction to see if there is a significant delay between redis and our machine. Depending on the parameters that we will have defined as warning and critical (in seconds), and the time difference that we have obtained, the srcipt will return status OK if there’s practically no difference, WARNING if the differences is between two and ten seconds, and CRITICAL if it’s greater than ten seconds.
User Data Source
check_UserDataSources.php
It checks if all user data sources are checked and running.
Winbind
check_winbind.sh
This check uses wbinfo to make queries and returns information created and used by the winbindd daemon. The winbindd daemon must be configured and running for the wbinfo program to be able to return information. This plugin checks the winbind in order to test the connection with Active Directory
The healthcheck verifies if the service is UP and running, or DOWN.
Troubleshooting
If we are having problems with any of the checks or we think that the check result might not be correct, we can run the checks in a standalone way.
To execute this, we just need to see the detail of the check and execute it manually, for example, let’s manually check the radius status:
- The first step is to look in the healthcheck.ini
cd /usr/share/opennac/healthcheck/
cat healthcheck.ini
In the line, after the the “[RADIUS]” section, we will copy the command, after the second “;”, in our case: “/usr/share/opennac/healthcheck/libexec/check_radius.sh”
- Now that we have the command, we execute it the server’s CLI:
/usr/share/opennac/healthcheck/libexec/check_radius.sh
Service RADIUSD is UP
- If the output is not the expected one, we can execute it with shell’s debugging:
sh -x /usr/share/opennac/healthcheck/libexec/check_radius.sh
+ service=RADIUSD
++ echo User-Name=monitor,User-Password=monitor,CAller-ID=00:00:00:00:00:00
++ /usr/bin/radclient localhost:1812 auth testing123 -s
+ output='Received response ID 32, code 3, length = 20
   Total approved auths:  0
     Total denied auths:  1
       Total lost auths:  0'
++ echo 'Received response ID 32, code 3, length = 20
   Total approved auths:  0
     Total denied auths:  1
       Total lost auths:  0'
++ sed 's_ __g'
++ awk -F : '{print $2}'
++ grep approved
+ check1=0
++ echo 'Received response ID 32, code 3, length = 20
   Total approved auths:  0
     Total denied auths:  1
       Total lost auths:  0'
++ awk -F : '{print $2}'
++ sed 's_ __g'
++ grep denied
+ check2=1
++ grep denied
++ awk -F : '{print $2}'
++ sed 's_ __g'
++ echo 'Received response ID 32, code 3, length = 20
   Total approved auths:  0
     Total denied auths:  1
       Total lost auths:  0'
+ check3=1
++ echo 'Received response ID 32, code 3, length = 20
   Total approved auths:  0
     Total denied auths:  1
       Total lost auths:  0'
++ grep -c 'no response'
+ check4=0
+ '[' 0 -eq 1 ']'
+ '[' 1 -eq 1 ']'
+ status=UP
+ echo 'Service RADIUSD is UP'
Service RADIUSD is UP
+ exit 0
Note
For more information regarding monitoring openNAC review Server Monitoring