User Device DashBoards
Regarding User Devices dashboards:
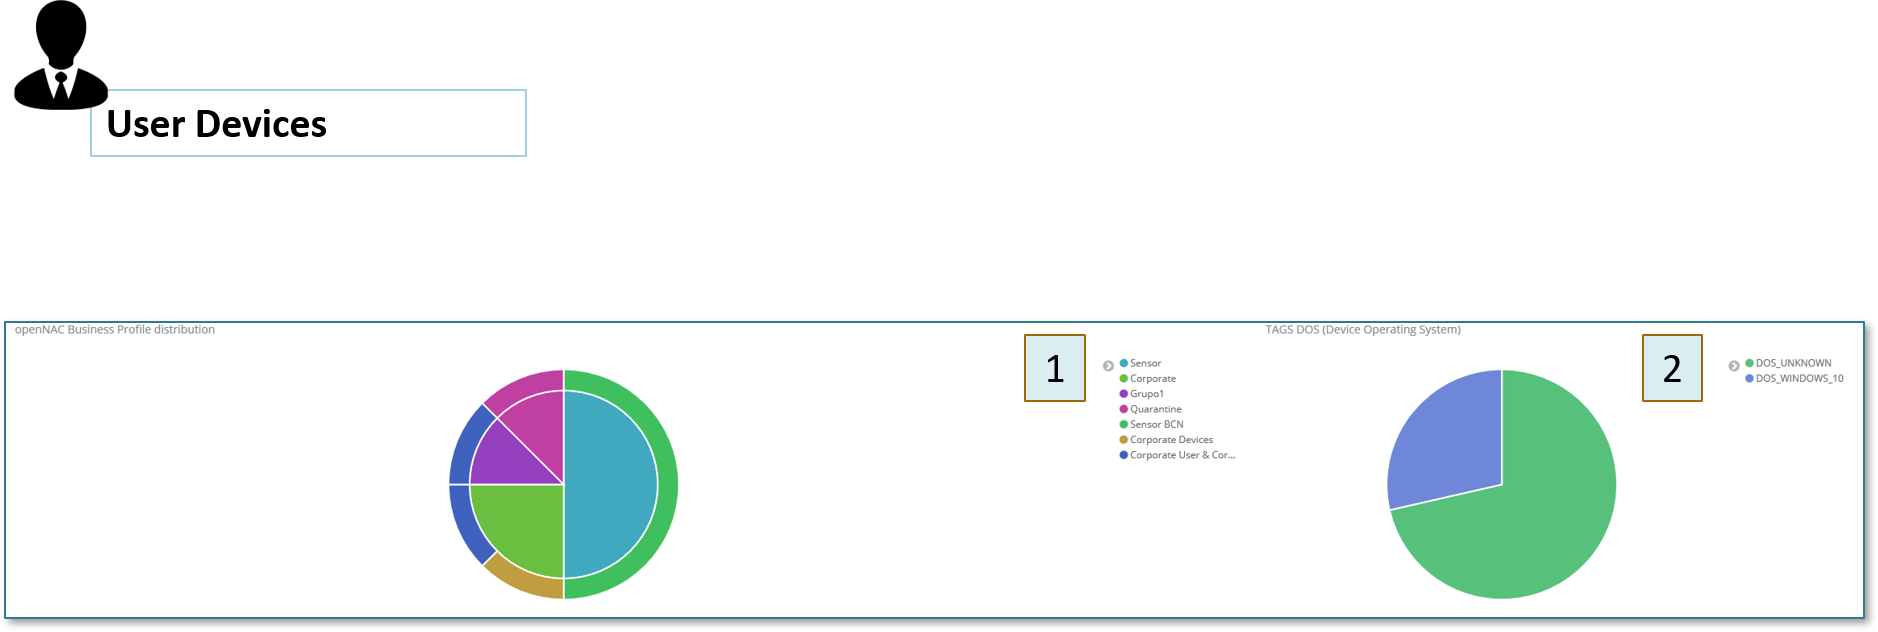
Auto-refresh is enabled by default as shown at the step 1 with a time range of Last 15 minutes.
Auto-refresh with high frequency periods could create a performance issue in the openNAC Analytics.
Over all the User Devices Dashboards a time range can be used, syntax like last 30 days, Yesterday, Today, Moth to data and many others time range are available as is shown at the step 2.
Remember that is important to have NTP properly configured on the system, if time is not synchronized can cause unexpected behavior.
Customized relative and absolute time range are also available as shown at the step 3.
As a reference and example we describe a few common dashboards:
Dashboard 1: This user device dashboard shows business profiles.
Dashboard 2: This user device dashboard shows the use of TAGS associated with user device operating systems.
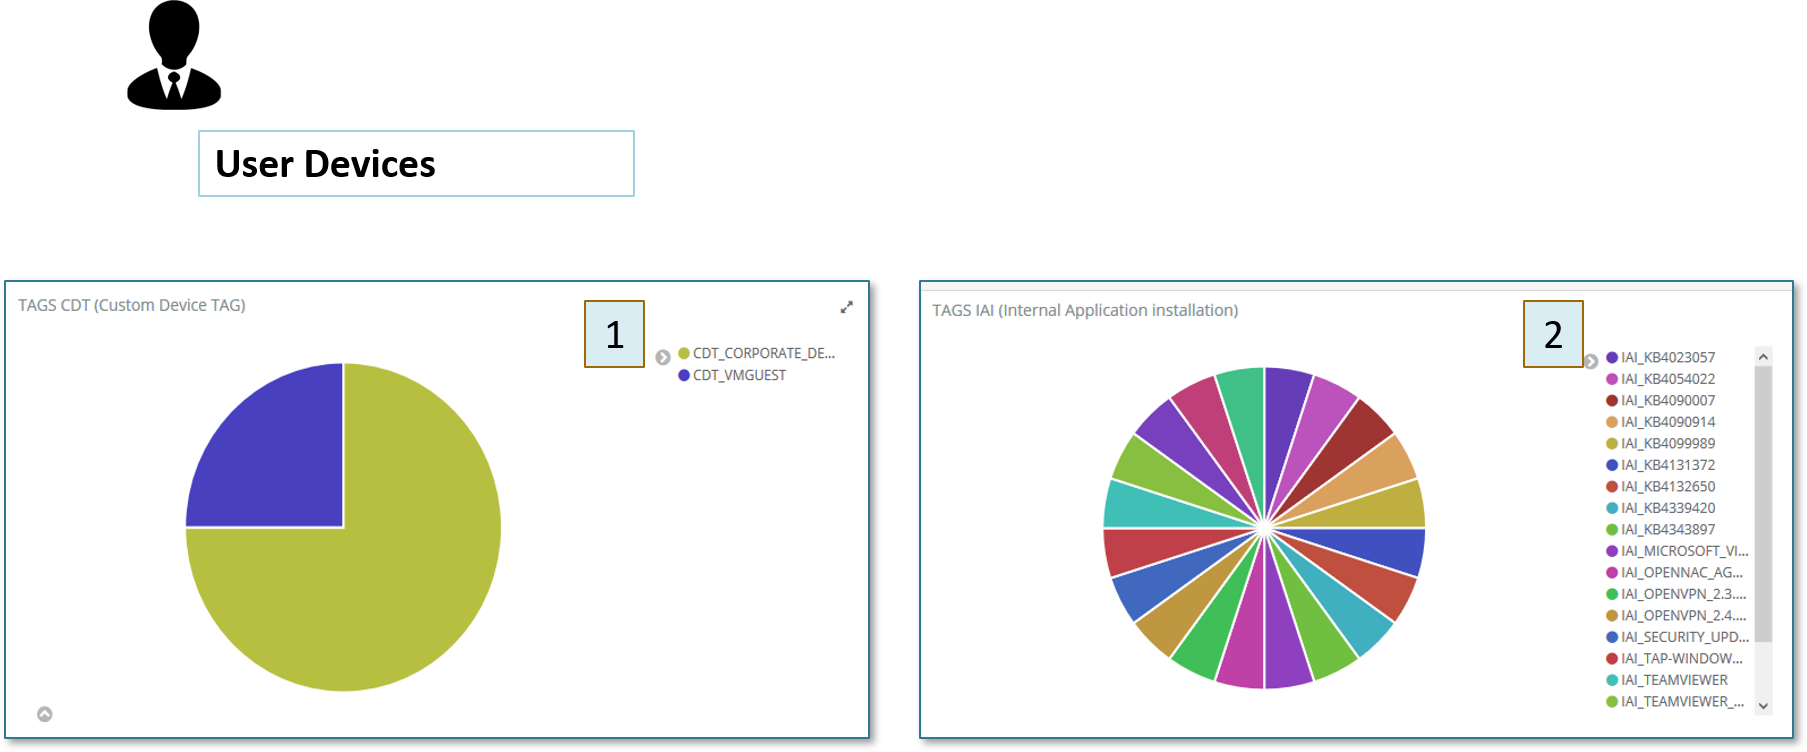
A few other user devices common dashboards:
- Dashboard 1:
This dashboard shows the internal application that is installed, to be populated this Tag must be added using openNAC Agent information.
- Dashboard 2:
This user device dashboards include the TAGS created by the customer, normally called Custom Device TAGs or CDT.
- Dashboard 3:
This user device dashboard shows internal security status, this shows the security status of user devices. This tags includes a Prefix named ISS which means Internal Security status, this information can be collected through openNAC Agent (Recommended) or using plugins (WMI).
A few other user devices common dashboards:
- Dashboard 1:
This dashboard shows the status about openNAC agent Inventory. Hardware, Software inventory are carried about openNAC Agent along other openNAC agent modules.
- Dashboard 2:
This user device dashboard include the TAGS created by openNAC as product, a few out of the box TAGS are created and use when openNAC technologies are deployed, the prefix used by this dashboards is ONC.
Dashboard 3:
This user device dashboard shows the type of end points in the network, This tags includes a Prefix named EPF which means End point Type.
- Dashboard 4:
This user device dashboard shows with user device application is installed, to get this information WMI plugin must be configured to check it., openNAC Agent can be also used. As other tags we can use it in the policy engine.
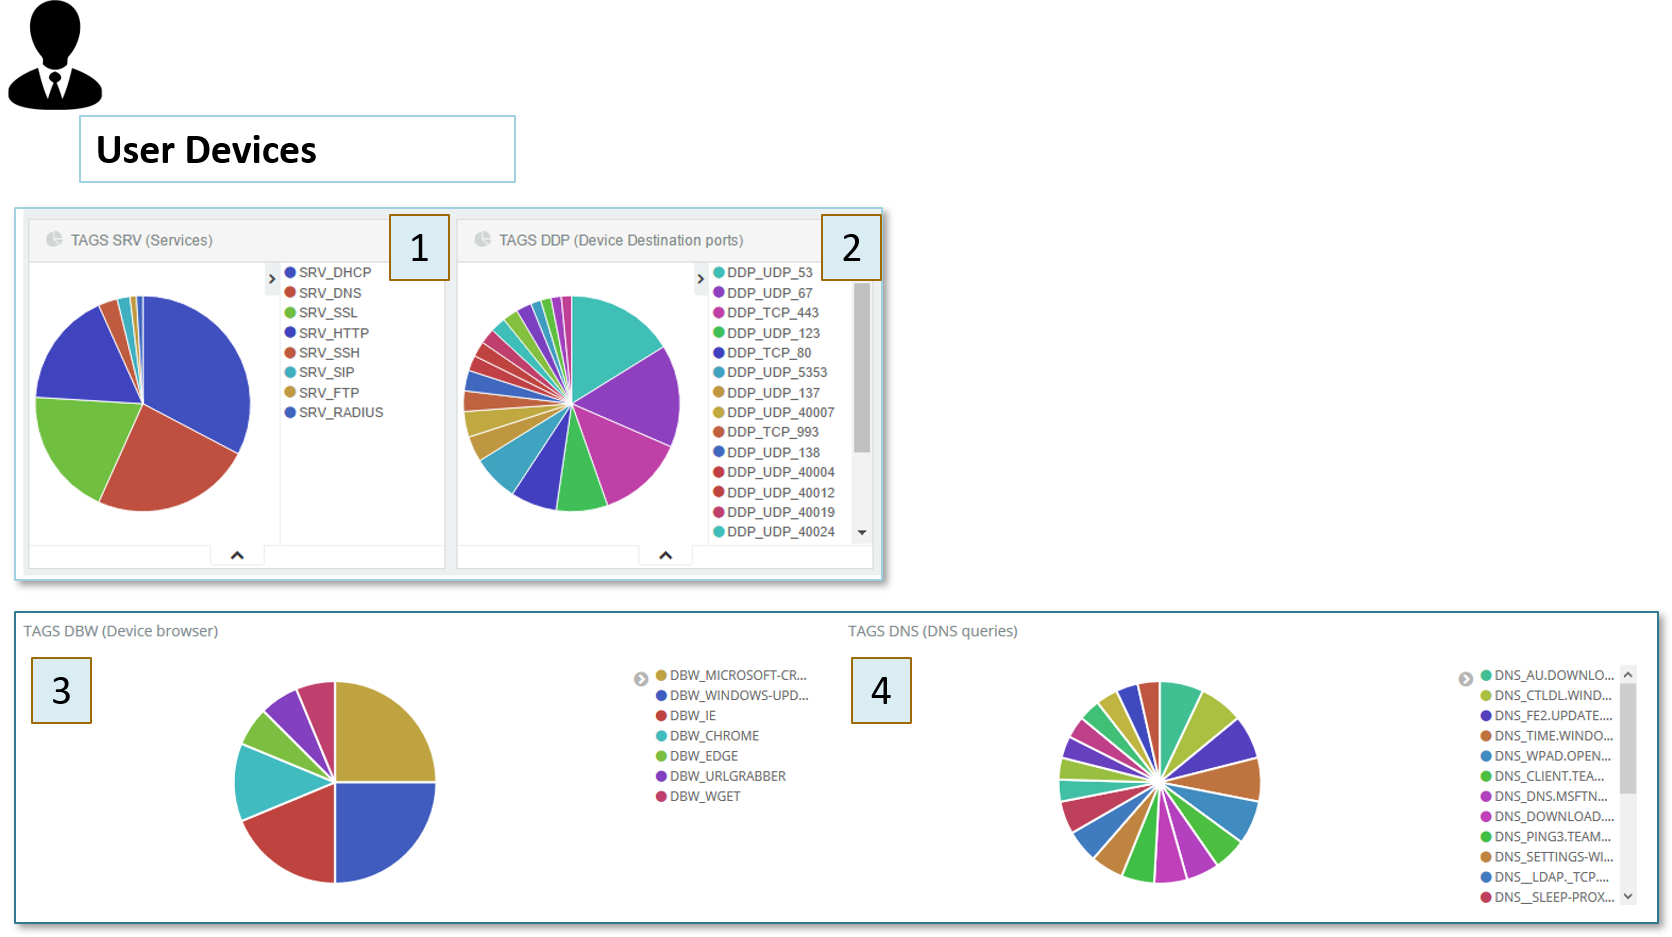
A few other user devices common dashboards:
- Dashboard 1:
This dashboard shows services found in the network after protocol decoding made by openNAC Sensor.
- Dashboard 2:
This user device dashboard include the TAGS created for Destination port, openNAC Sensor decode protocol sessions, with this protocol decoding we can identify destination port. The prefix associated with this TAG is DDP (Device Destination Port).
- Dashboard 3:
This user device dashboard shows the type of browsers installed in the end points, This tag include a prefix named DBW which means Device Browser.
Dashboard 4:
This user device dashboard shows which DNS queries are launched by end users. This tag include a prefix named DNS_, after this prefix is included the DNS FQDN record.
