Discovery
Regarding Discovery search engine:
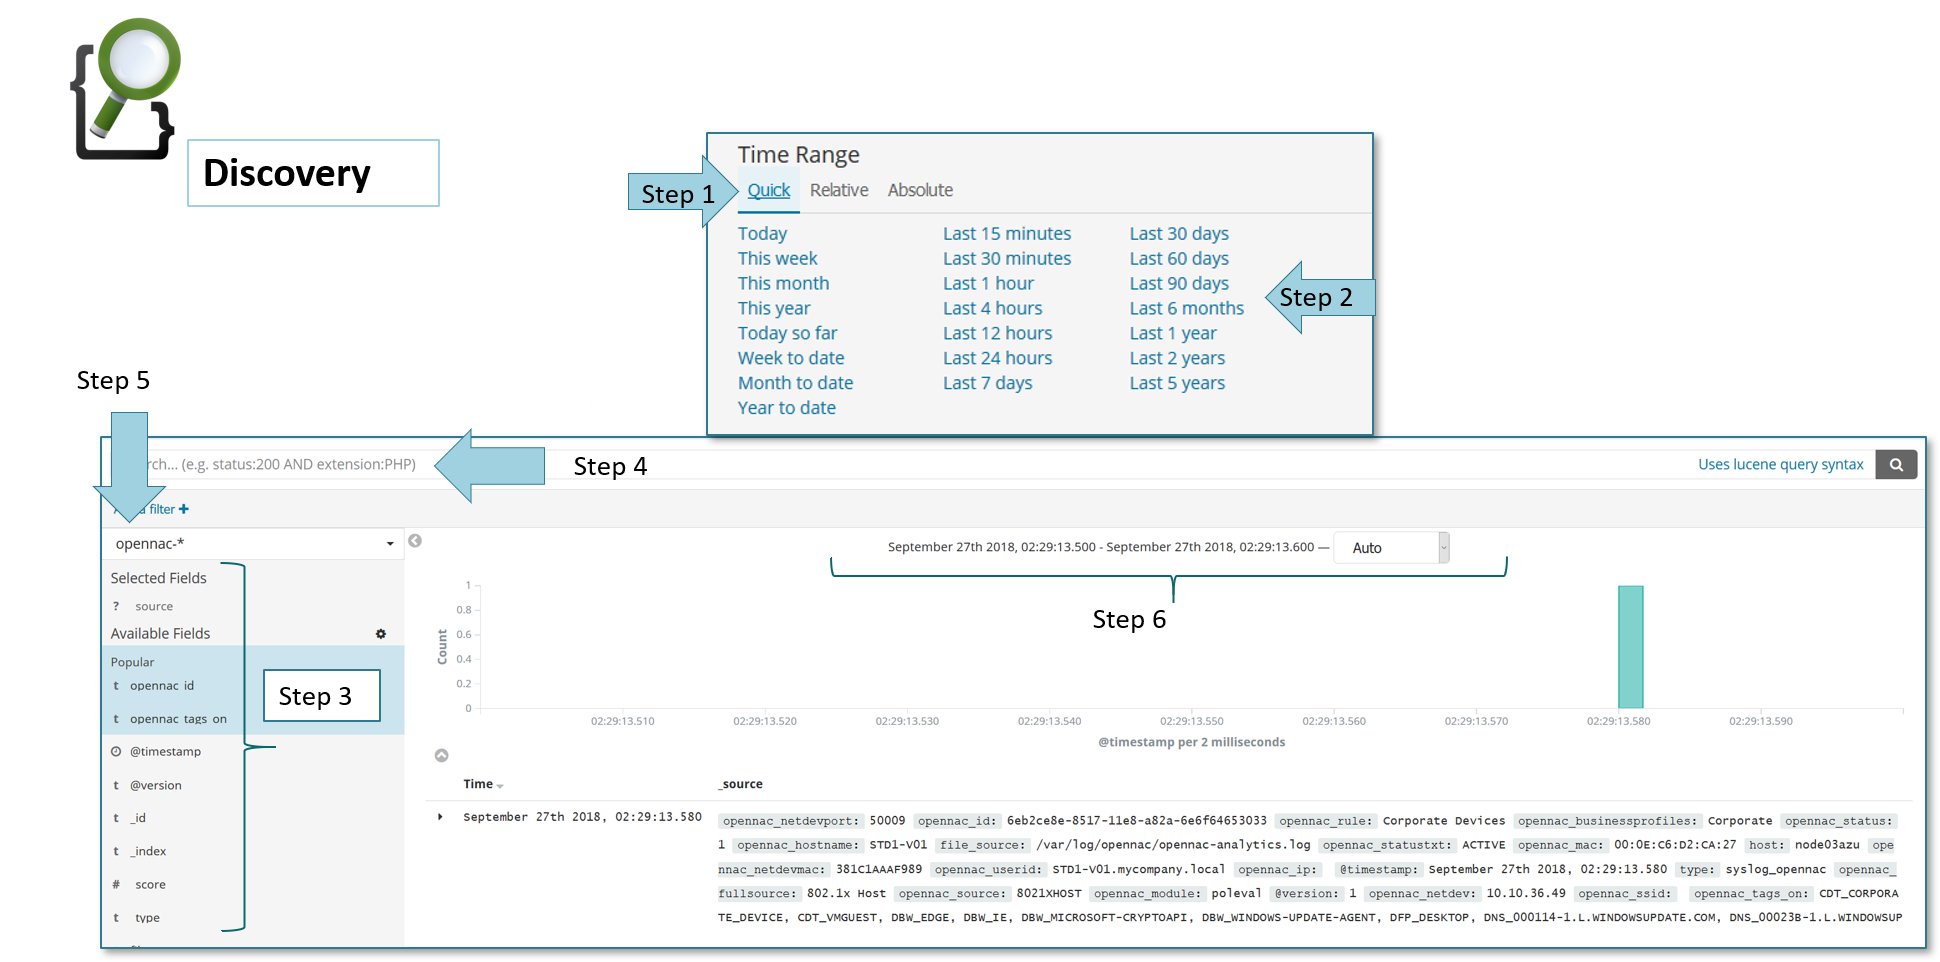
Auto-refresh is enabled by default as shown at the step 1 with a time range of Last 15 minutes.
Auto-refresh with high frequency periods could create a performance issue in the openNAC Analytics.
Over all the User Devices Dashboards a time range can be used, syntax like last 30 days, Yesterday, Today, Moth to data and many others time range are available as is shown at the step 2.
Remember that is important to have NTP properly configured on the system, if time is not synchronized can cause unexpected behavior.
All the events that are generated by the openNAC technologies is parsed in JSON which provide flexibility and the use of event fields as shown at the step 4.
The search input engine allow us to include fields and values. For instance conn_proto=tcp and logical expressions are allowed (AND, OR…) and other advance filters as shown in the step 5.
A few indexes are created to store different pieces of information, you can select all the indexes or select one as shown by the step 6. We have different types of index:
- Logstash index: This collects information from sensor events.
- openNAC index: This collects information from openNAC.
- opennac-UD index: This collects information about updated user devices status.
Time range can be review as shown by the step 7.
Number of result are shown at the step 8.
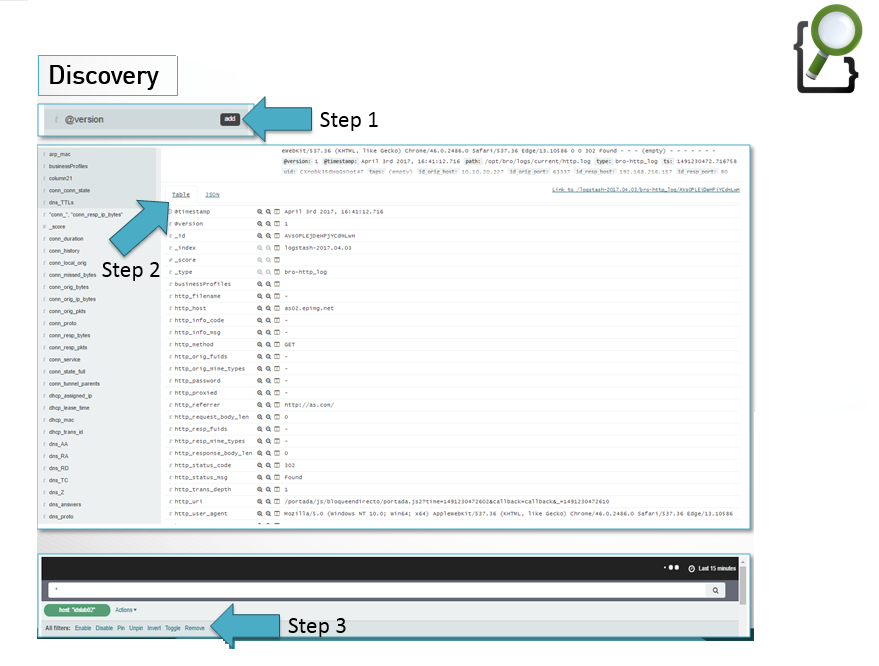
If we use the search engine through Discovery section at Analytics -> Discovery we can add filtering selecting the fields as shown at the step 1.
The event itself can be viewed as a table or as a JSON as shown at the step 2.
Additional and advanced filters can be set, filters and actions can be graphically added as shown by the step 3.