openNAC DashBoards
Regarding openNAC dashboards:
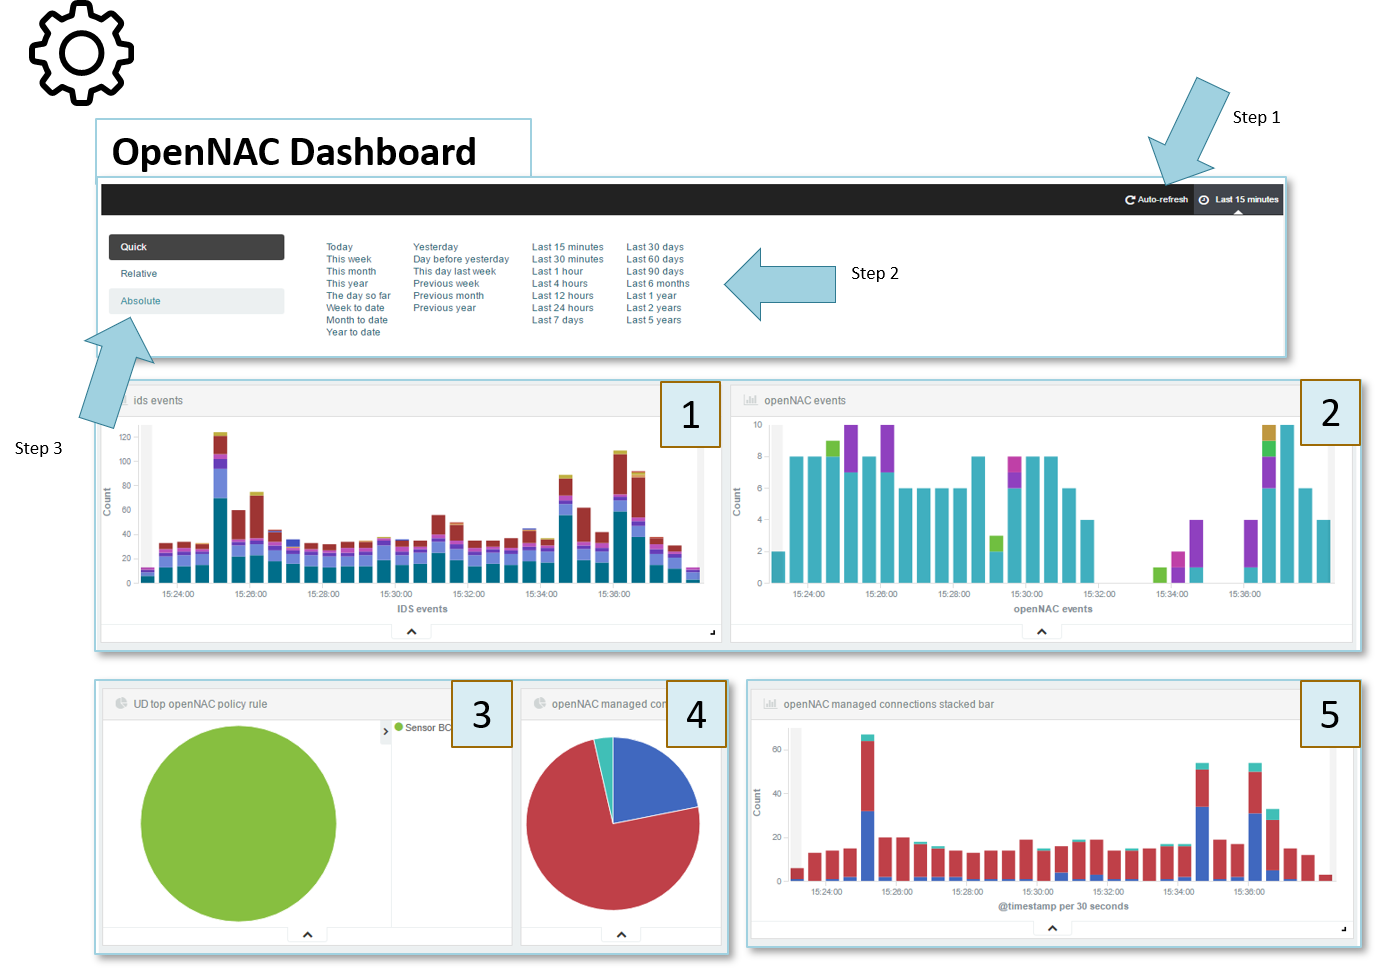
Auto-refresh is enabled by default as shown at the step 1 with a time range of Last 15 minutes.
Auto-refresh with high frequency periods could create a performance issue in the openNAC Analytics.
Over all the openNAC Dashboards a time range can be used, syntax like last 30 days, Yesterday, Today, Moth to data and many others time range as is shown at the step 2.
Remember that is important to have NTP properly configured on the system, if time is not synchronized can cause unexpected behavior.
Customized relative and absolute time range are also available as shown at the step 3.
As a reference and example we describe a few common dashboards:
- Dashboard 1:
This dashboard shows IDS events collected by count and time range.
- Dashboard 2:
This dashboard openNAC events collected by count and time range.
- Dashboard 3:
This dashboard shows user devices events arranged by policy.
- Dashboard 4:
This dashboard shows events managed and unmanaged by openNAC Engine.
- Dashboard 5:
This dashboard shows openNAC managed connection by time.
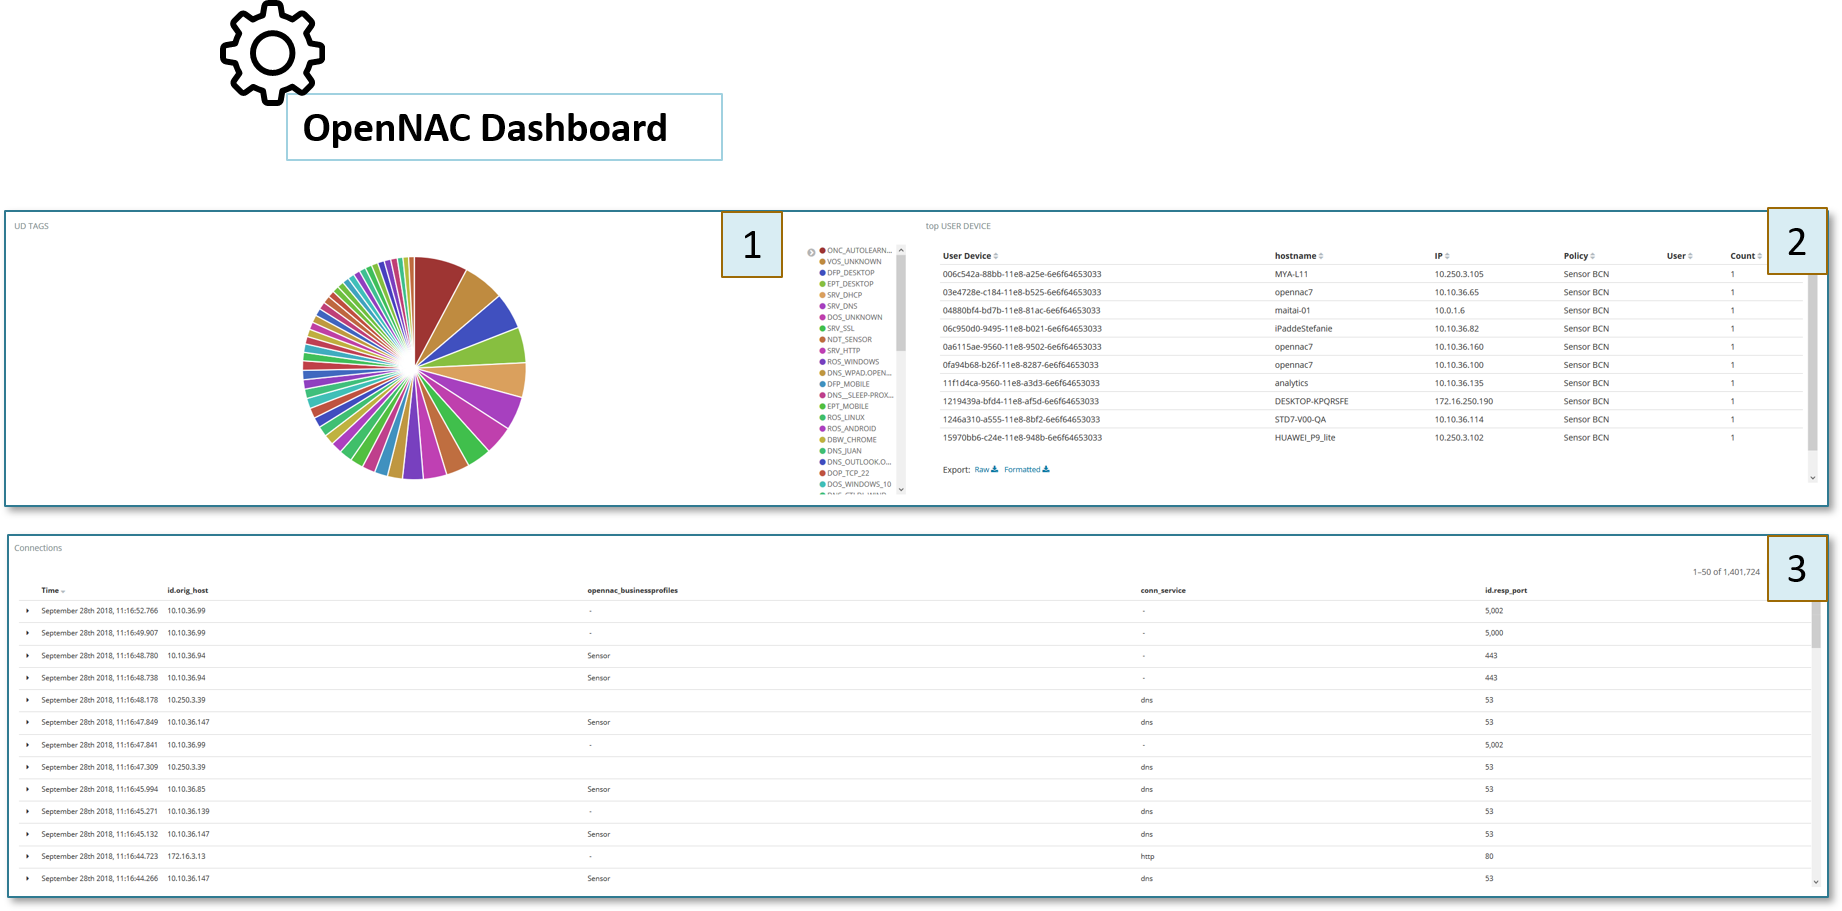
A few common dashboards:
- Dashboard 1:
This dashboard shows User devices TAGs.
- Dashboard 2:
This dashboard shows user device information, policy matched, users device used, username group by count.
- Dashboard 3:
This dashboard shows protocols decode, destination port used and its business profile.
- Dashboard 4:
This dashboard shows events founds from denylisted IPS (a free reputation services are used), low reputation countries, source and destination.