Sensor DashBoards
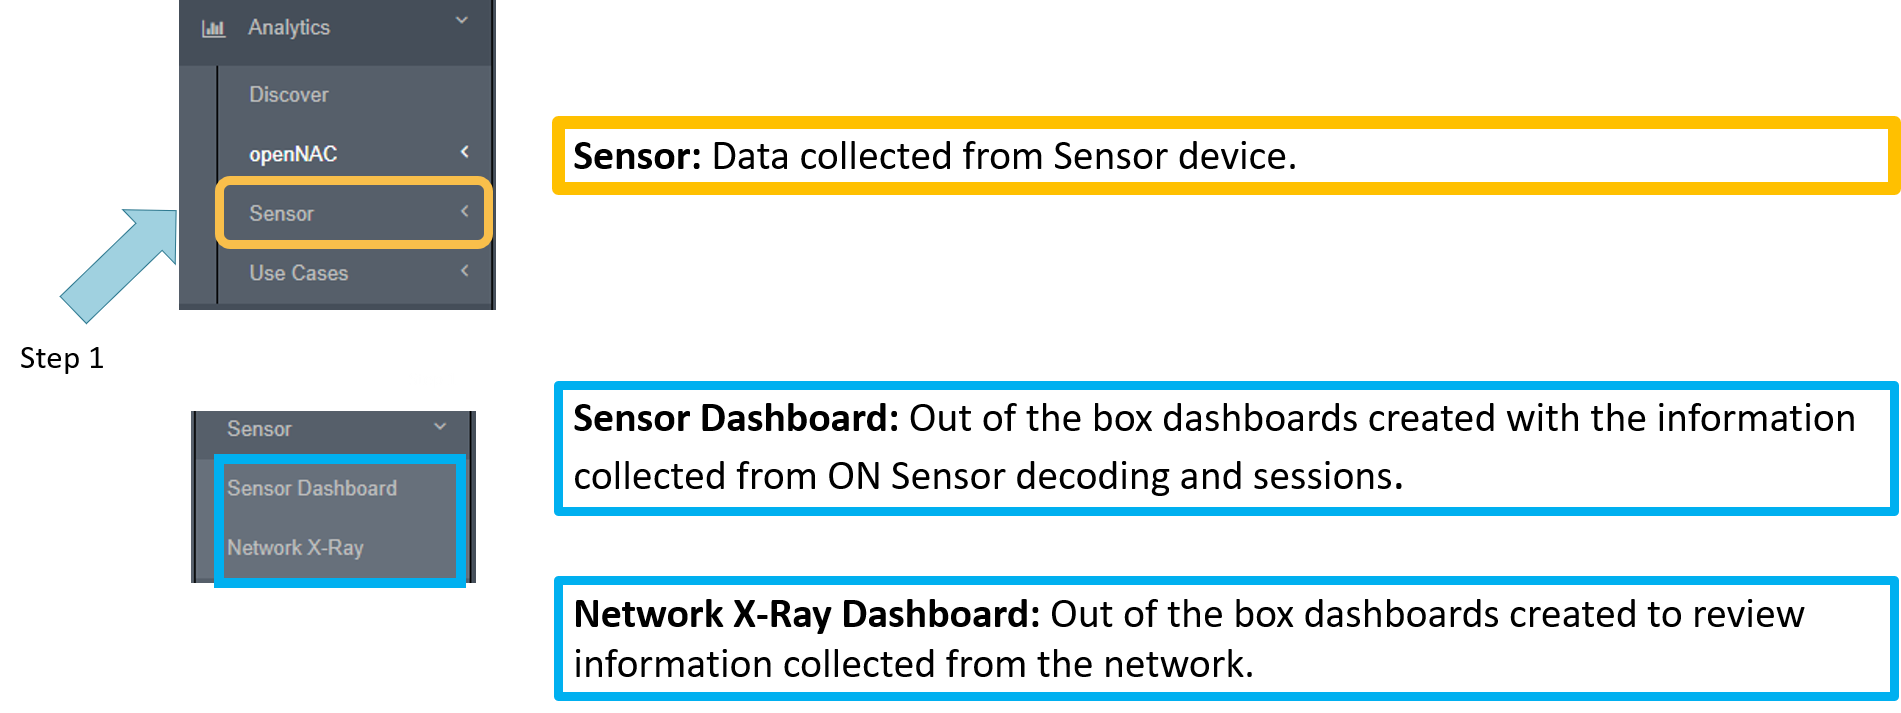
Regarding Sensor dashboard
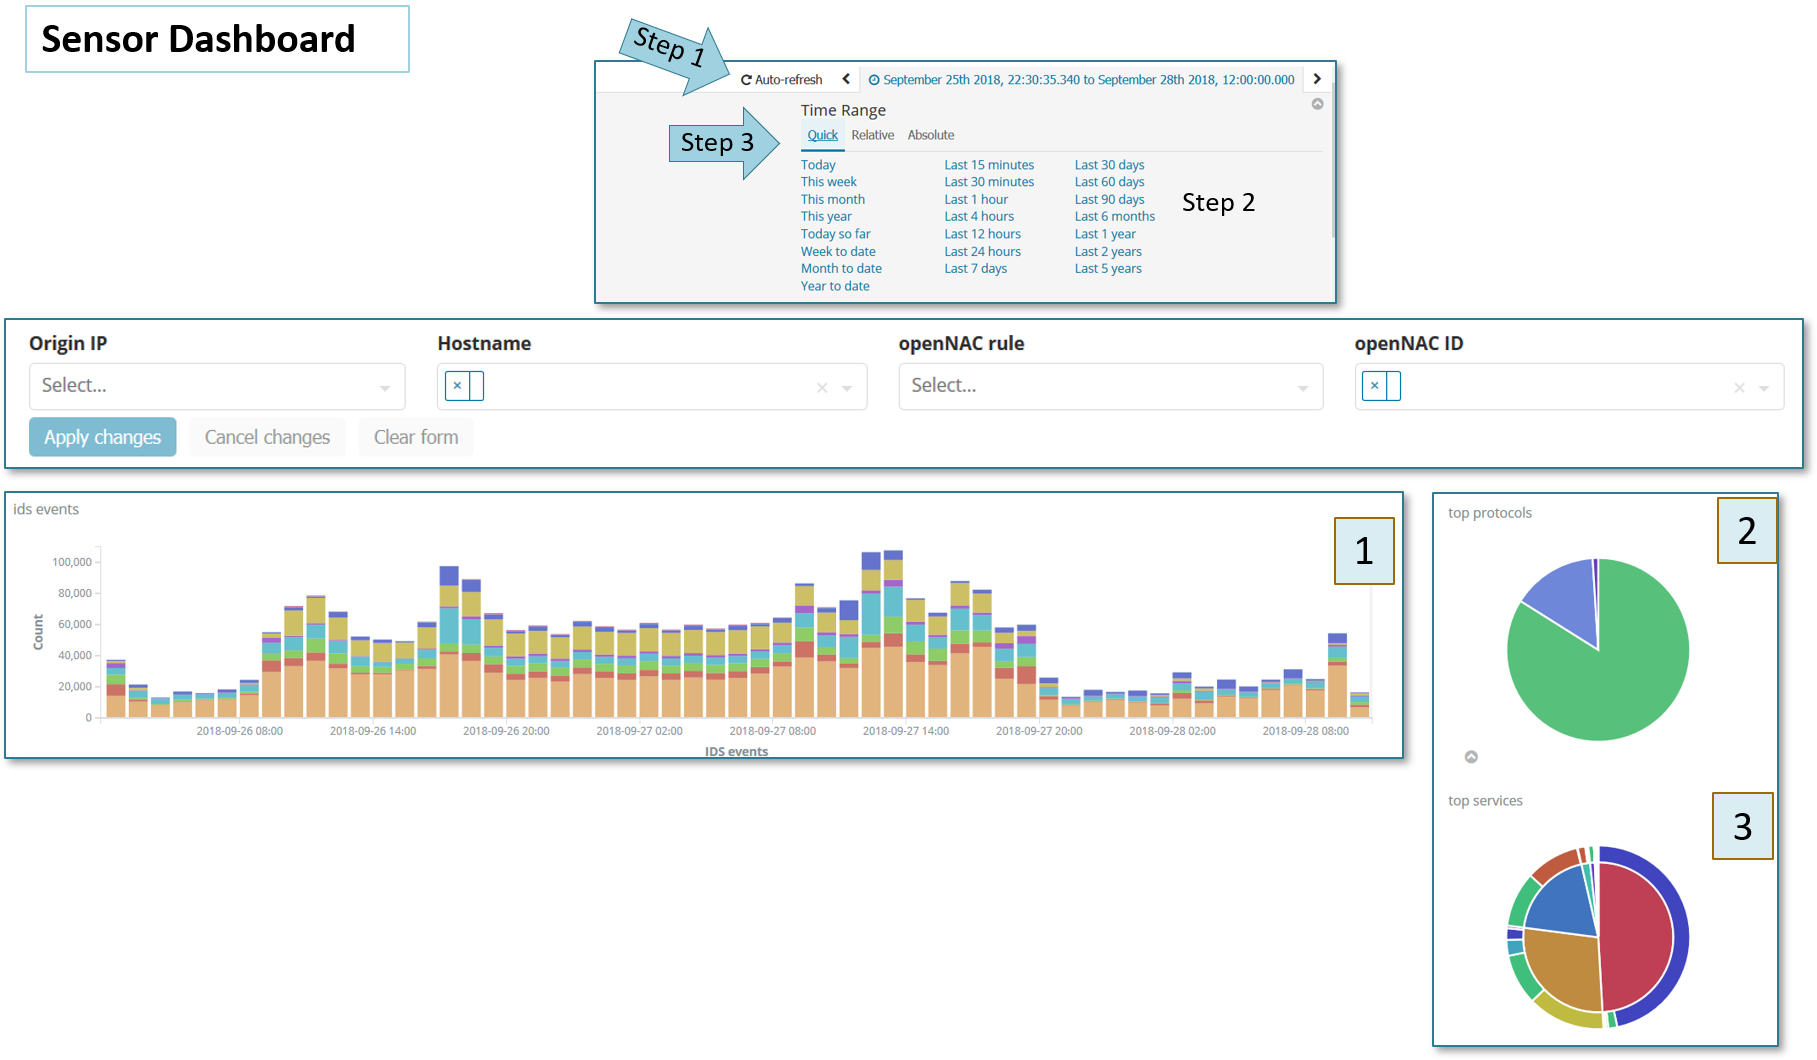
Auto-refresh is not enabled by default as shown at the step 1 with a time range of Last 15 minutes.
Auto-refresh with high frequency periods could create a performance issue in the openNAC Analytics.
Over all the openNAC Dashboards a time range can be used, syntax like last 30 days, Yesterday, Today, Moth to data and many others time range as is shown at the step 2.
Remember that is important to have NTP properly configured on the system, if time is not synchronized can cause unexpected behavior.
Customized relative and absolute time range are also available as shown at the step 3.
As a reference and example we describe a few common dashboards:
- Dashboard 1:
This dashboard shows sensor events, arranged by types of decoding extracted.
- Dashboard 2:
This dashboard shows sensor events, arranged by protocols (TCP, UDP, ICMP) decoded by Sensor engine.
- Dashboard 3:
This dashboard is a table that shows sensor events, arranged by user device, hostname, source IP, policy name, user and counter (how may times the same event appears).
- Dashboard 4:
This dashboard shows sensor events, including all the protocols and services decoded by openNAC sensor engine.
Other Sensor dashboards:
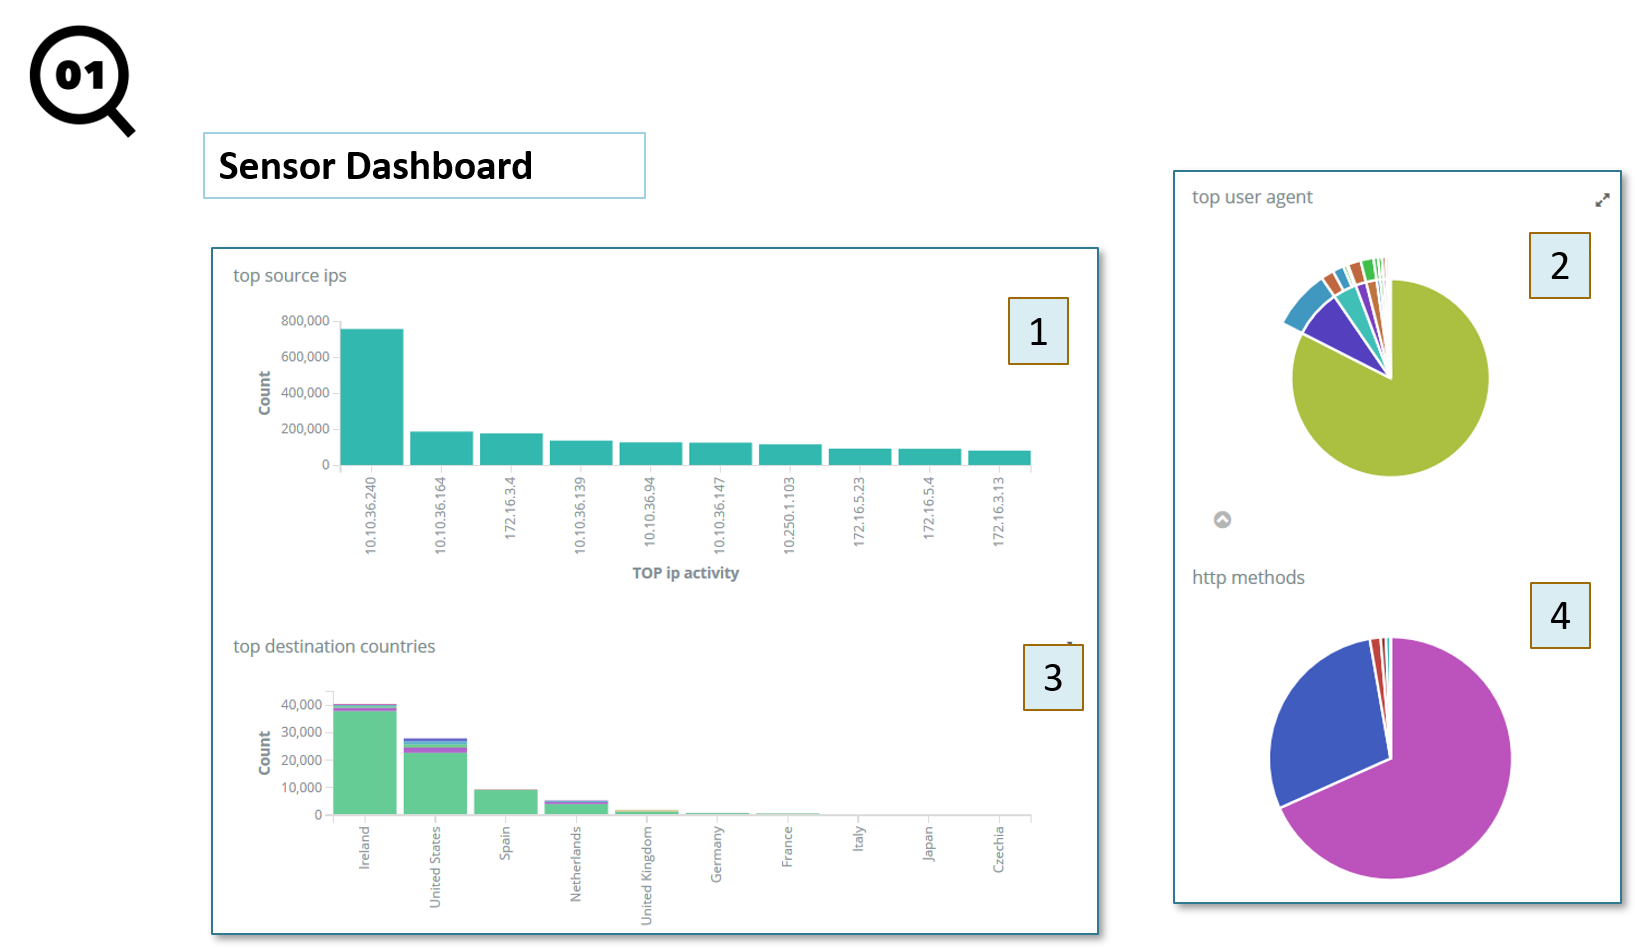
- Dashboard 1:
This dashboard shows sensor events, arranged by source IP and Top 10.
- Dashboard 2:
This dashboard shows sensor events, arranged by browser user agent.
- Dashboard 3:
This dashboard shows sensor events, arranged destination countries.
- Dashboard 4:
This dashboard shows sensor events, arranged by http methods .
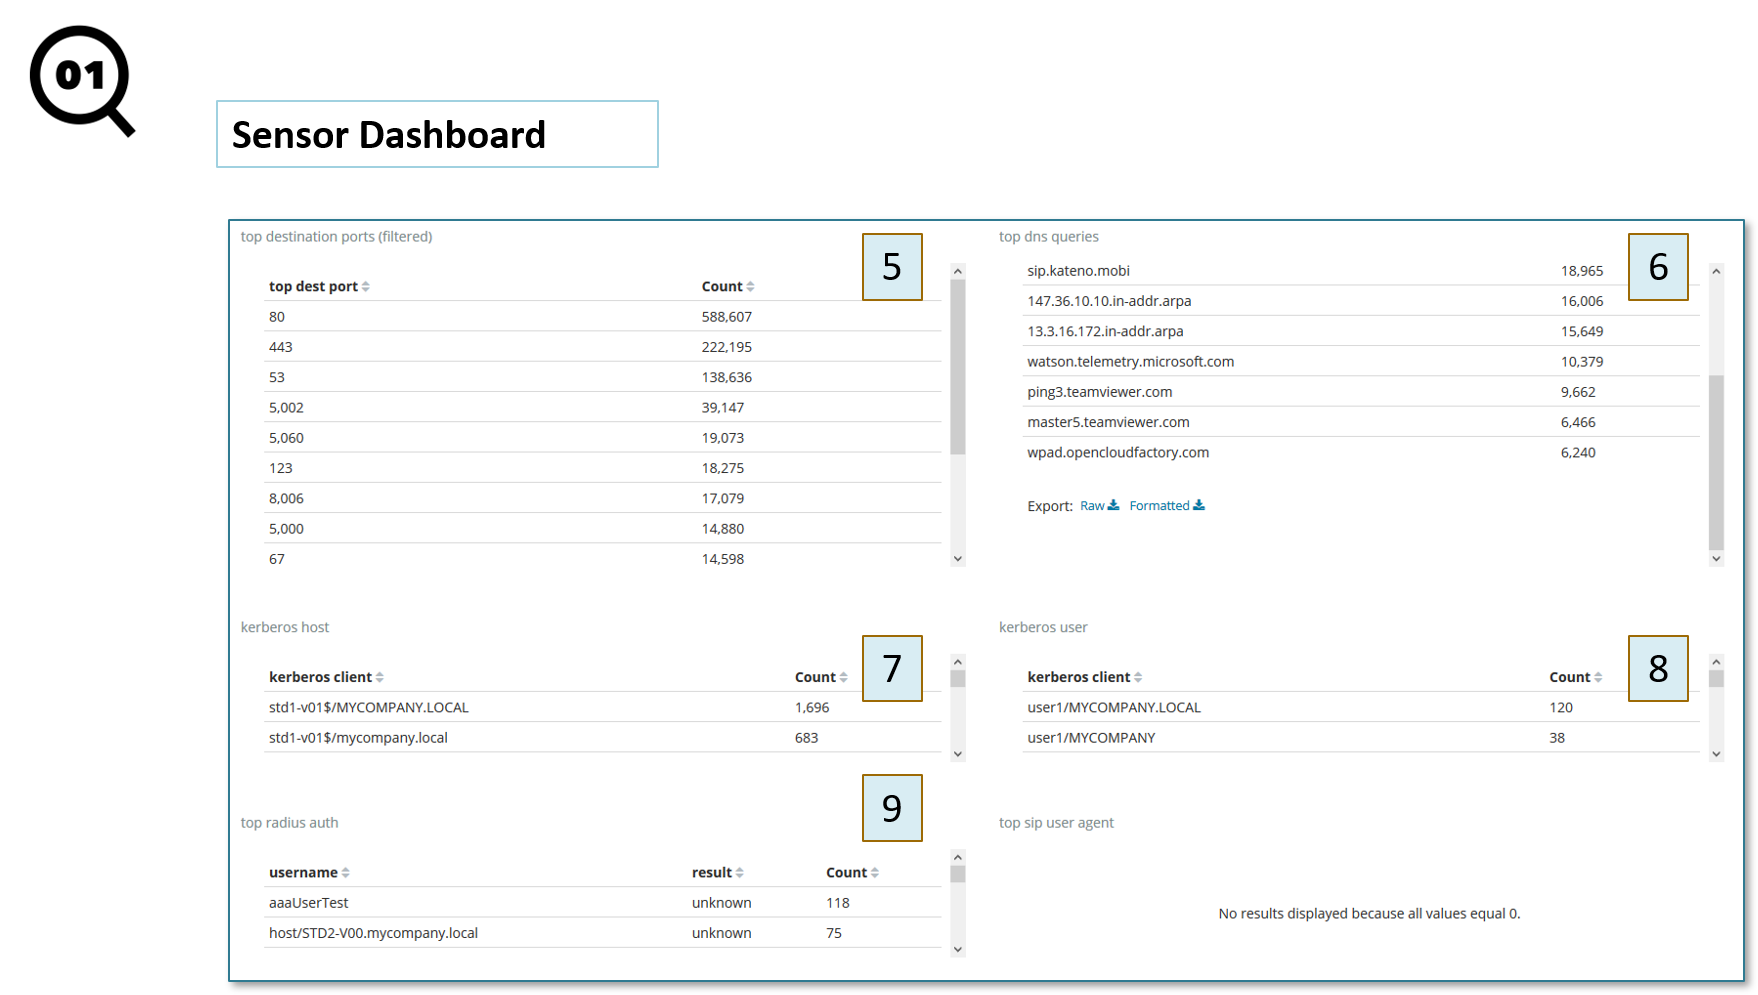
Other Sensor dashboards:
- Dashboard 1:
This dashboard is a table that shows filtered destination ports filtered by Top 10 and by count.
- Dashboard 2:
This dashboard is a table that shows top DNS queries by queried FQDN name, by Top 10 and by count.
- Dashboard 3:
This dashboard is a table that shows top SSL FQDN Server name, by Top 10 and by count.
- Dashboard 4:
This dashboard is a table that shows top Radius authentications, by Top 10 and by count.